Are the FANG stocks agreeing with our short-term bullish view?
The ASX200 slipped -0.23% yesterday but looks poised to regain these losses early this morning courtesy of the Dow’s +293-point overnight rally although the futures market is unfortunately suggesting not a great deal more – BHP closed up +0.5% in the US but a -1.7% fall in gold and copper respectively looks likely to weigh on our broader resources today.
The story remains the same for the Australian market, to show some backbone the influential Banking Sector needs to regain some believers i.e. its down 5% for the month, almost double the weakness of the overall local market. So much for seasonal strength!
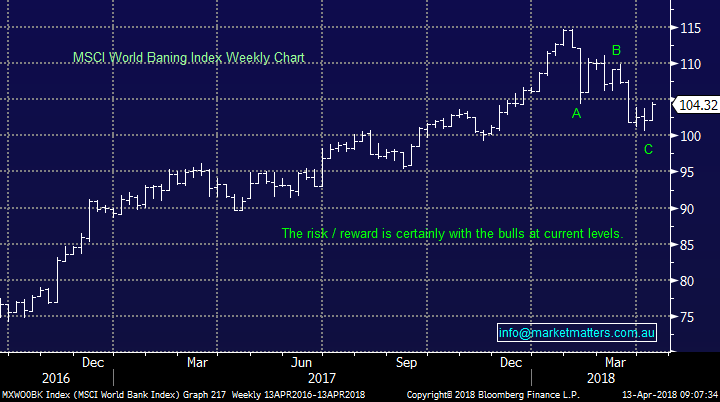
However, the global banking index has actually corrected -12.2% since its February high which is surprisingly more than our local banks, even with the local pressures of the Royal Banking Commission – note global banks have been rallying strongly since mid-2016.
What’s caught our eye this morning is the global banks are looking very bullish technically from a risk / reward perspective assuming they can hold recent lows – A net bullish sign for stocks.
Global Banking Index Chart
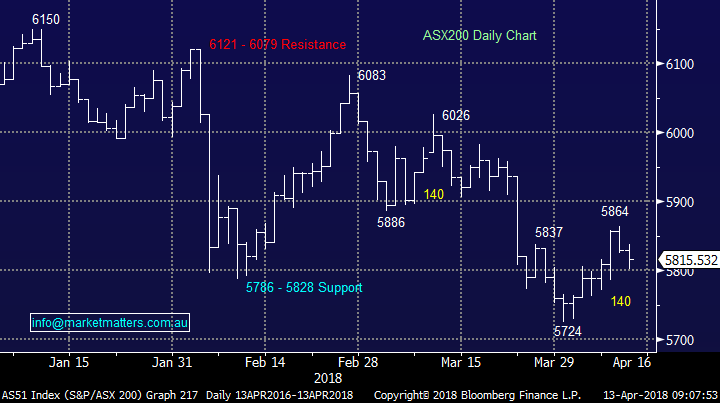
This morning, following the solid gains by global stocks, the ASX200 is set to open right in the middle of the psychological 5800 and 5850 levels – up around 40-points / 0.8% for the week.
We still need a close back above 5900 before we can see a real possibility of a test of 2018 highs, while a failure to hold the 5800-support area will concern us.
ASX200 Chart
Today we are again going to turn our attention the FANG stocks which we last looked at in the middle of the February share market plunge as we turned to these new market leaders for a gauge to the health of stock markets moving forward.
Back in January / February we had been making some pretty aggressive calls e.g. Amazon was set to fall over 10%.
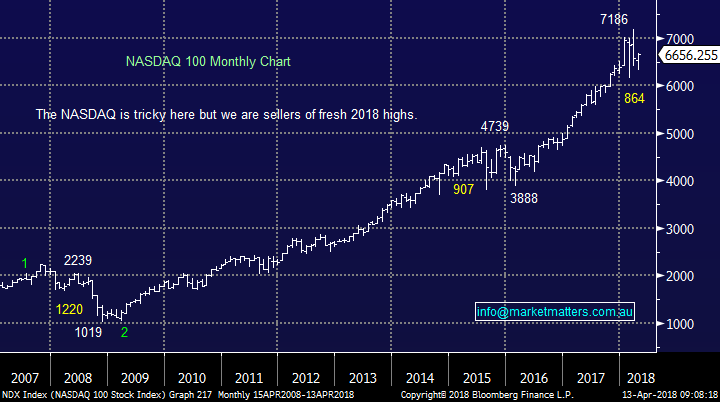
Hence as this was unfolding, albeit in a more aggressive manner than we expected, we saw no reason not to step in and buy stocks – “volatility stops” created the hysteria in February so by understanding why stocks were down closer to 15% (as opposed to the 10%) we had expected we bought the panic. Today the tech-based NASDAQ is tricky although it is resembling the 2015-6 correction on an accelerated level, just before we saw the index break out to the upside.
US NASDAQ
Investors should consider the following very sobering statistics when evaluating the current risk / reward from the FANG’s, especially following the Facebook / Cambridge Analytica privacy debacle which has shown clear “chinks in the armour” of Mark Zuckerberg’s social media goliath.
· The S&P500 is up over 300% since the start of this bull market in March 2009, while Amazon is up around 2000% and Netflix a remarkable +5000%.
· The valuations on some of these FANG’s are simply scary with Netflix Est P/E for 2018 at 112x and Amazon 172x compared to say A2 Milk on 43x estimated 2018 earnings.
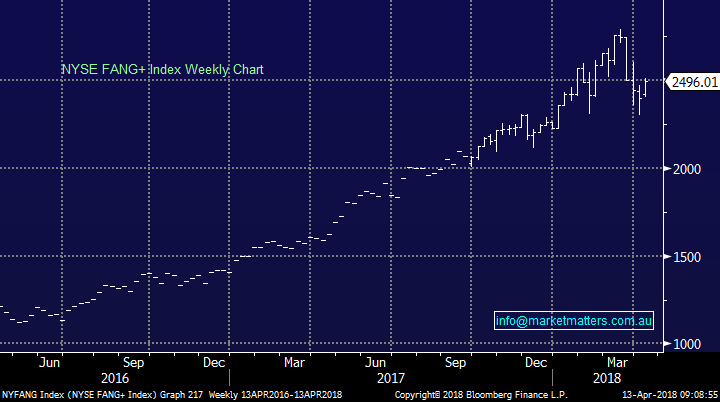
We now even have a FANG + index which also includes the likes of Tesla which enables investors to buy a basket of these relatively new technology stocks but as we saw in February with “volatility positions” a potentially very dangerous scenario when people all want to get off the train at the same time – remember we are not fans of Tesla.
NYSE FANG+ Index Chart
Similar to February let’s look at the 5 NASDAQ driving FANG stocks on an individual level especially as the overall index is a touch hard to pick at present.
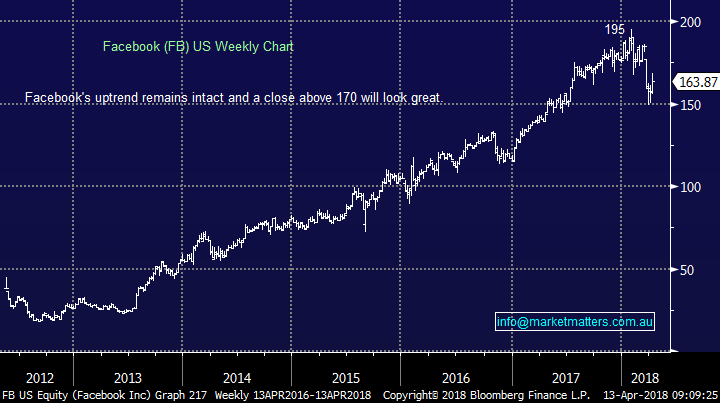
1 Facebook $US163.87
Facebooks had a tough time recently as the market digests its extra risks / costs of privacy issues. However, the stock is still trading within 16% of its all-time high and will look good technically if it can close ~4% higher.
Facebook is (only) trading on a valuation of 23x which is cheap compared to many of its piers. While we find it hard to image significant growth moving forward the stock is not screamingly expensive.
We are bearish Facebook closer to the $US200 area as opposed to today, at least for now.
Facebook Chart
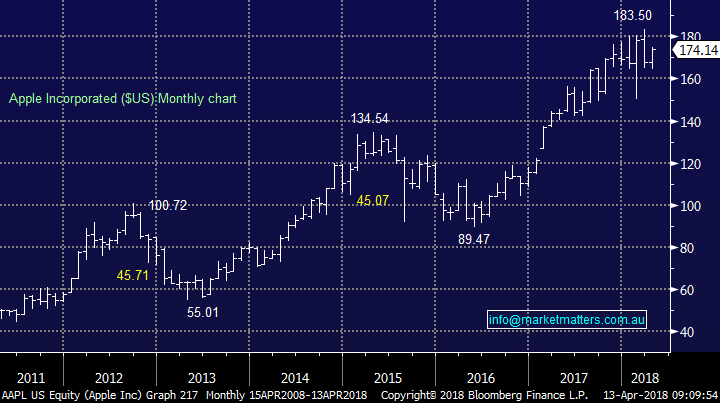
2 APPLE $US174.14
The sensible one amongst the group only trading on a valuation of 15.3x as the market clearly sees constrained growth for the IT giant.
Technically we would be sellers closer to the $US200 level.
APPLE (US) Chart
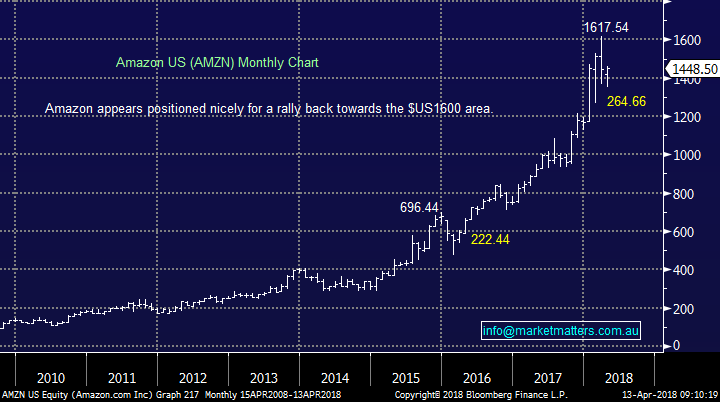
3 Amazon.com $US1448.50
The on-line retail giant is sitting just over 10% below its March’s all-time high. We find the current high valuation scary and if anything were to go a miss we could very quickly see a painful rerating of the stock.
We are neutral at current levels but would be technical sellers into fresh 2018 highs.
Amazon.com Chart
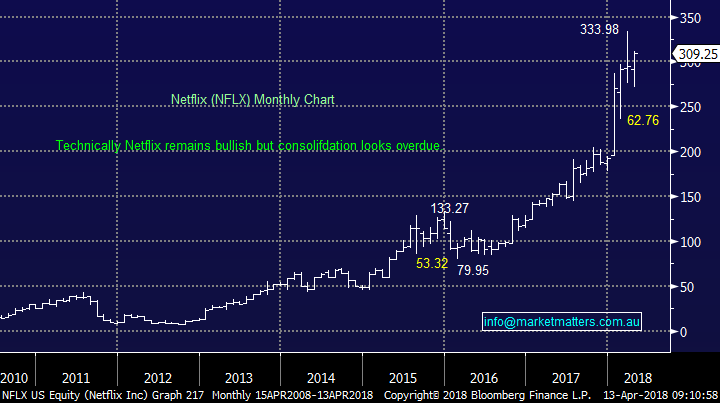
4 Netflix $US309.25
Amazingly Netflix, even as the company trades on a huge valuation, looks very strong technically.
We can see Netflix trading between $US250 and $US350 over the next year hence we are neutral / slightly bullish just here.
Netflix (FFLX) Chart
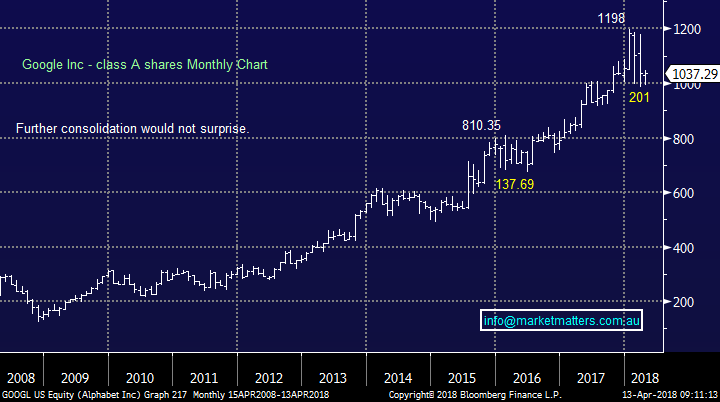
5 Google US $US1037.29
Another relatively sensible one in the group from a valuation perspective trading on 25x forward. It’s certainly not a business model we would argue with and we would not be surprised to see fresh all-time highs moving forward in 2018.
We can see Google trading between $US1000 and $US1200 over the next year hence we are neutral / slightly bullish just here.
Google Inc – Class A Chart
Conclusion (s)
1. The FANG’s are unfortunately not giving us any major insight into stock markets at present.
2. We are currently neutral / bullish the FANG’s short-term.
3. Medium-term we can see some big issues on the horizon for stocks like Amazon and Netflix who are priced for perfection and then some– plus of course Tesla which still losses more $$ than I can comprehend!
Overnight Market Matters Wrap
· Geopolitical tensions eased overnight, as the US major indices rallied following comments from US President Trump considering to join back to the Tran-Pacific Partnership trade deal that he withdrew from along with corporate earnings season kicking off.
· The financials were the winners of the broader US market following Blackrock’s first quarter earnings beating analysts’ consensus, with further financials to report tonight. Macquarie Group (MQG) is expected to benefit from this and outperform the broader local market today.
· Gold declined as tensions eased, with gold futures off 1.61% this morning.
· The June SPI Futures is indicating the ASX 200 to open 16 points higher, back above the 5830 level this morning.
Have a great day!
James & the Market Matters Team
Disclosure
Market Matters may hold stocks mentioned in this report. Subscribers can view a full list of holdings on the website by clicking here. Positions are updated each Friday, or after the session when positions are traded.
Disclaimer
All figures contained from sources believed to be accurate. Market Matters does not make any representation of warranty as to the accuracy of the figures and disclaims any liability resulting from any inaccuracy. Prices as at 13/04/2018. 8.26AM
Reports and other documents published on this website and email (‘Reports’) are authored by Market Matters and the reports represent the views of Market Matters. The MarketMatters Report is based on technical analysis of companies, commodities and the market in general. Technical analysis focuses on interpreting charts and other data to determine what the market sentiment about a particular financial product is, or will be. Unlike fundamental analysis, it does not involve a detailed review of the company’s financial position.
The Reports contain general, as opposed to personal, advice. That means they are prepared for multiple distributions without consideration of your investment objectives, financial situation and needs (‘Personal Circumstances’). Accordingly, any advice given is not a recommendation that a particular course of action is suitable for you and the advice is therefore not to be acted on as investment advice. You must assess whether or not any advice is appropriate for your Personal Circumstances before making any investment decisions. You can either make this assessment yourself, or if you require a personal recommendation, you can seek the assistance of a financial advisor. Market Matters or its author(s) accepts no responsibility for any losses or damages resulting from decisions made from or because of information within this publication. Investing and trading in financial products are always risky, so you should do your own research before buying or selling a financial product.
The Reports are published by Market Matters in good faith based on the facts known to it at the time of their preparation and do not purport to contain all relevant information with respect to the financial products to which they relate. Although the Reports are based on information obtained from sources believed to be reliable, Market Matters does not make any representation or warranty that they are accurate, complete or up to date and Market Matters accepts no obligation to correct or update the information or opinions in the Reports.
If you rely on a Report, you do so at your own risk. Any projections are estimates only and may not be realised in the future. Except to the extent that liability under any law cannot be excluded, Market Matters disclaims liability for all loss or damage arising as a result of any opinion, advice, recommendation, representation or information expressly or impliedly published in or in relation to this report notwithstanding any error or omission including negligence.
To unsubscribe. Click Here


