How long can the recent fund managers rebound last? (IFL, JHG, PDL, CGF, PPT)
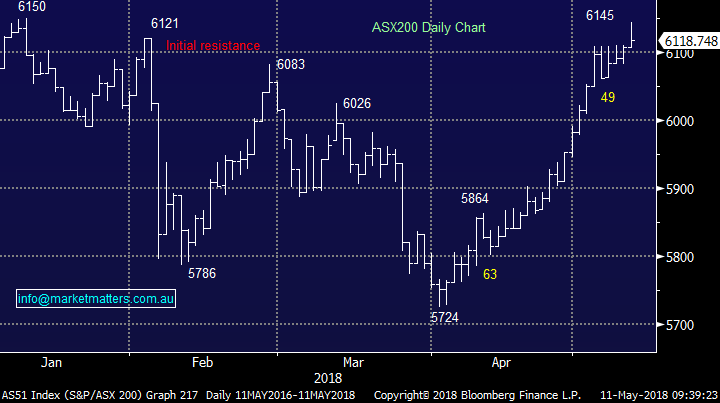
The ASX200 gained another 10-points yesterday but its struggling to meaningfully rally above the psychological 6100 area, primarily because of the banks who understandably remain under pressure in the wake of the royal commission.
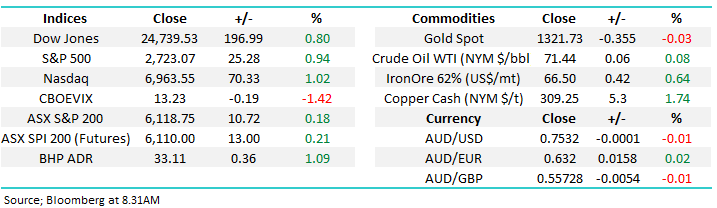
Overnight US stocks rallied ~1%, BHP is trading 35c higher but the local futures have only managed to reclaim half of Thursday’s intra-day losses – the broad local market simply feels tired and we would not be surprised to see a few more days consolidation / relative weakness.
- MM remains bullish targeting ~6250 for the ASX200 BUT we remain in “sell mode”.
Today we are going to look at 5 local fund managers who’ve mostly bounced nicely during the last week, even as the sector has been under the AMP cloud.
Both our Growth Portfolio positions in IOOF Holdings (IFL) and Janus Henderson (JHG) have been causing us some discomfort, while the same is also true for our position in Perpetual in the Income Portfolio - the question we ask ourselves – is the current market optimism an opportunity to exit poor positions?
ASX200 Chart
Global indices
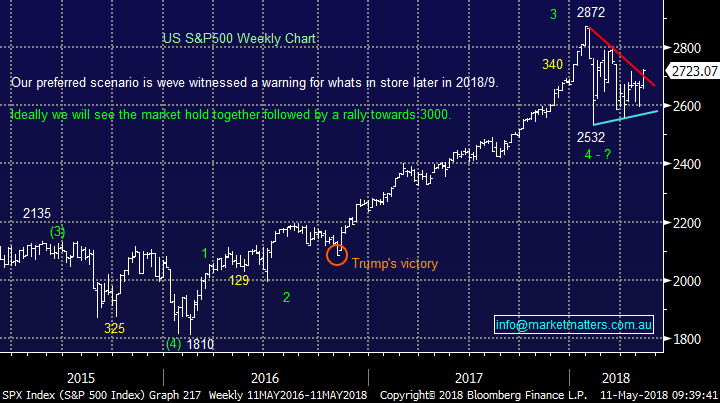
Overnight we saw tame US inflation numbers which led to a pullback in the $USD, US 10-year yields slipping back beneath 3% and another rally in stocks. The respective US indices are breaking out to the upside from their 2 ½ month consolidation, led by the small cap Russell 2000 index which is now less than 1% below its all-time high and the tech-based NASDAQ which is only 3.2% below its equivalent milestone.
- We are short-term bullish US stocks targeting ~6-8% upside for the S&P500.
US S&P500 Chart
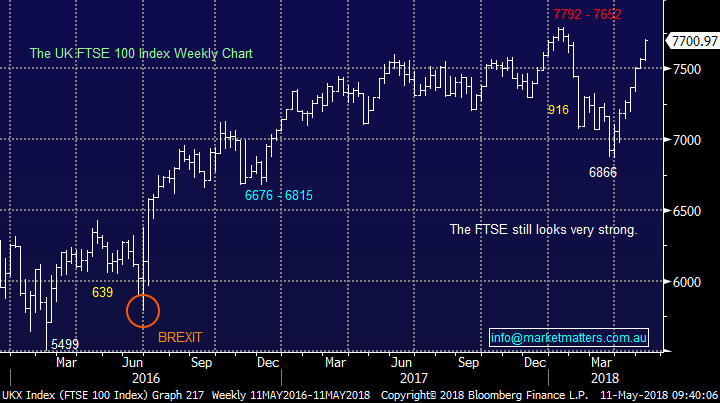
European stocks remain strong with the UK FTSE now sitting around 1% below its all-time high.
UK FTSE Chart
Moving onto 5 local fund managers, many of whom have rallied ~10% over the last month.
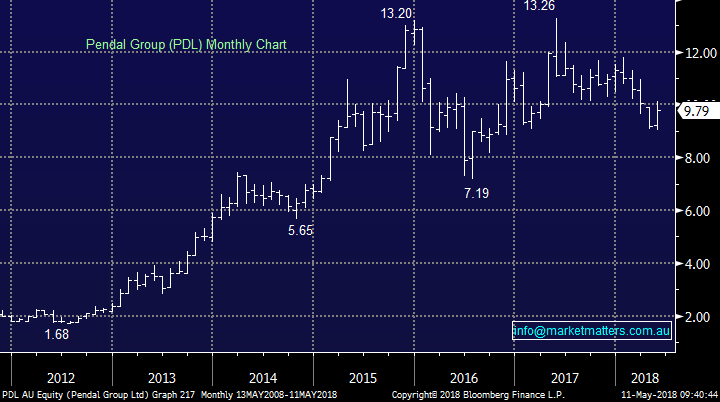
1 Pendal Group (PDL) $9.79
The former BT Investment Group has rallied ~10% over the last 2-days following the release of its half-year results, PDL delivered a 30% increase in its net cash profit to $114.5m with the driver a healthy 9% increase in the funds under management (FUM).
PDL is trading on an forward PE of 15.4x while yielding 3.7% unfranked.
- We are neutral PDL around the current $10 region.
Pendal Group (PDL) Chart
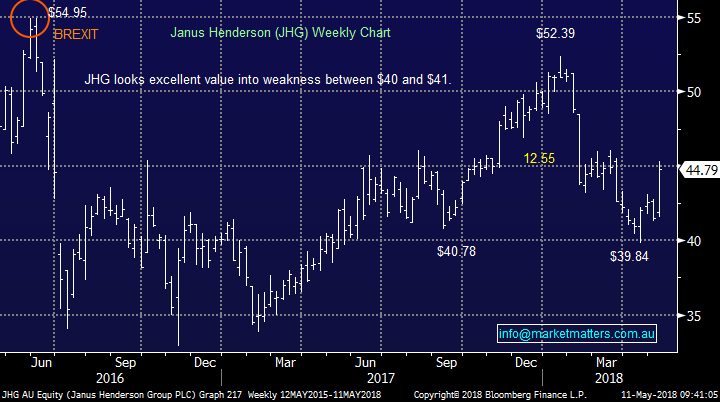
2 Janus Henderson (JHG) $44.79
JHG has surged almost 14% since late April with the majority of the gains this week. JHG is well positioned to benefit from the depreciating $A and US tax cuts, a powerful combination. However, its operations in the UK understandably concern many investors as BREXIT unfolds – its cheap without European concerns.
JHG is trading on a forward PE of 11.65x while yielding 4.6% part franked.
- We remain optimistic that we can at least exit our position around the $47 regions, which happens to be around breakeven point.
Janus Henderson Group (JHG) Chart
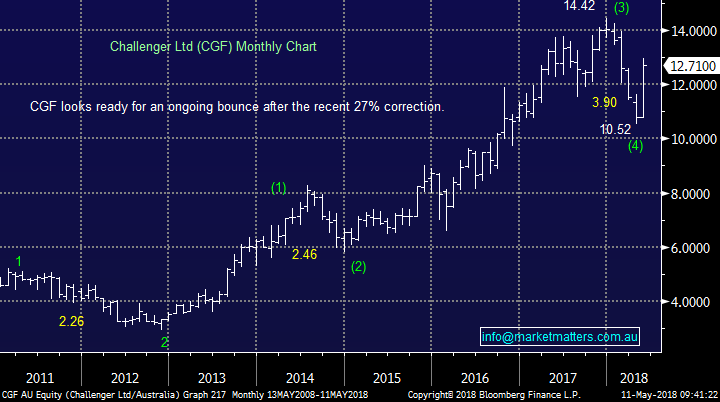
3 Challenger Group (CGF) $12.71
Challenger has roared back to life following a 27% correction which was hurting many investors who saw nothing but upside for this annuity play. However, if / when markets do have a major correction CGF is likely to underperform as it must continue to pay out its annuities while its respective investments are likely to struggle.
Short-term CGF has been a major beneficiary of the recent budget whose retirement reforms open the doors for growth in annuities / similar products.
CGF is trading on a forward PE of 19.1x while yielding 2.75% fully franked – expensive for the complexity in the business.
- We are neutral CGF around $13 but would turn negative technically if it can make fresh highs above $14.50.
Challenger Group (CGF) Chart
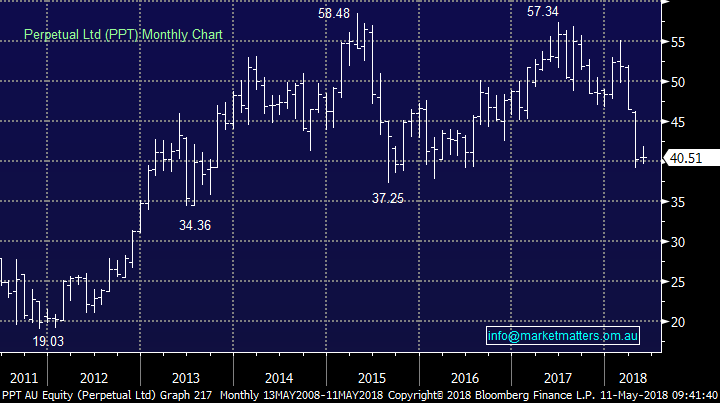
4 Perpetual Ltd (PPT) $40.51
Perpetual (PPT) have endured a torrid time recently after announcing a $2.6bn drop in FUM last month – it’s fallen 9.3% over the last month when many of its peers are up 10%. The vertically integrate model of advice + funds management has also come into question and we covered this in an Income Report 2 weeks ago. Once PPT can stabilise its FUM the stock looks very good value with a yield that should attract many local investors.
PPT is trading on a forward PE of 13.4x while yielding 6.7% fully franked.
- Technically PPT looks destined to test the $38 which we believe will represent good value.
Perpetual (PPT) Chart
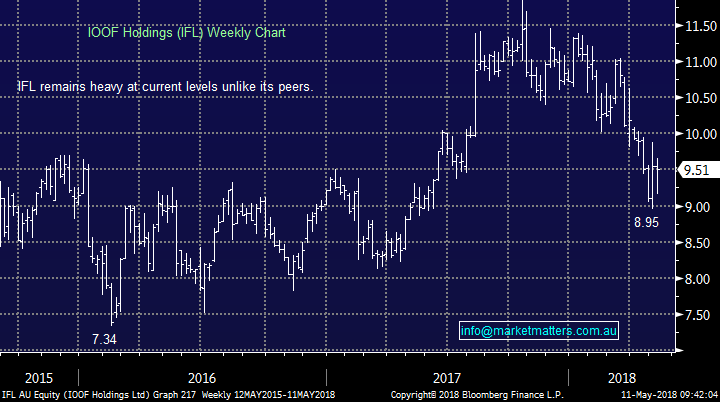
5 IOOF Holdings (IFL) $9.51
IOOF recently released a statement highlighting the strong performance of ANZ Wealth, which reported 1H18 NPAT at $39 million compared to $33 million in 1H17. However, the question remains has IFL purchased ANZ wealth near the top of the cycle, it would probably have been cheaper following the Hayne royal commission as other “big 4” banks look to exit wealth management.
IFL is trading on a forward PE of 17.2x while yielding 5.7% fully franked.
- Technically IFL looks good value ~$8.50 but worth selling close to $10.
IOOF Holdings (IFL) Chart
Conclusion (s)
Considering our medium term negative outlook for stocks we believe the current rally in wealth managers should be considered a selling opportunity.
With regard to our positions:
1 Growth Portfolio – We believe that JHG will get close to our breakeven $47 area but IFL will struggle to rally above $10.
2 Income Portfolio – We would only consider adding to PPT around $38 but would be looking to exit in the mid $40’s.
Overnight Market Matters Wrap
· The US equity markets rallied overnight as lower than expected US inflation data in April dampened investors’ aggressive expectations on the pace of the US Fed Reserve interest rate rise targets.
· Commodities rose on US$ weakness, with copper rallying 1.8%, while crude oil firmed again, rallying towards US$71.44/bbl. this morning.
· BHP is expected to outperform the broader market this morning after ending its US session up an equivalent of 1.09% from Australia’s previous close.
· The June SPI Futures is indicating the ASX 200 to open 16 points higher towards the 6135 level this morning.
Have a great day!
James & the Market Matters Team
Disclosure
Market Matters may hold stocks mentioned in this report. Subscribers can view a full list of holdings on the website by clicking here. Positions are updated each Friday, or after the session when positions are traded.
Disclaimer
All figures contained from sources believed to be accurate. Market Matters does not make any representation of warranty as to the accuracy of the figures and disclaims any liability resulting from any inaccuracy. Prices as at 11/05/2018. 8.31AM
Reports and other documents published on this website and email (‘Reports’) are authored by Market Matters and the reports represent the views of Market Matters. The MarketMatters Report is based on technical analysis of companies, commodities and the market in general. Technical analysis focuses on interpreting charts and other data to determine what the market sentiment about a particular financial product is, or will be. Unlike fundamental analysis, it does not involve a detailed review of the company’s financial position.
The Reports contain general, as opposed to personal, advice. That means they are prepared for multiple distributions without consideration of your investment objectives, financial situation and needs (‘Personal Circumstances’). Accordingly, any advice given is not a recommendation that a particular course of action is suitable for you and the advice is therefore not to be acted on as investment advice. You must assess whether or not any advice is appropriate for your Personal Circumstances before making any investment decisions. You can either make this assessment yourself, or if you require a personal recommendation, you can seek the assistance of a financial advisor. Market Matters or its author(s) accepts no responsibility for any losses or damages resulting from decisions made from or because of information within this publication. Investing and trading in financial products are always risky, so you should do your own research before buying or selling a financial product.
The Reports are published by Market Matters in good faith based on the facts known to it at the time of their preparation and do not purport to contain all relevant information with respect to the financial products to which they relate. Although the Reports are based on information obtained from sources believed to be reliable, Market Matters does not make any representation or warranty that they are accurate, complete or up to date and Market Matters accepts no obligation to correct or update the information or opinions in the Reports.
If you rely on a Report, you do so at your own risk. Any projections are estimates only and may not be realised in the future. Except to the extent that liability under any law cannot be excluded, Market Matters disclaims liability for all loss or damage arising as a result of any opinion, advice, recommendation, representation or information expressly or impliedly published in or in relation to this report notwithstanding any error or omission including negligence.
To unsubscribe. Click Here


