Gold Stocks Are Ignoring the Gold Price as We Know It! (EVN, NST, NCM)
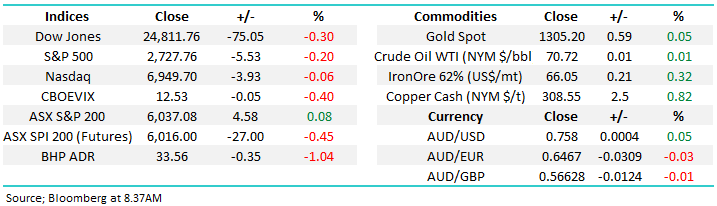
The ASX200 finally managed to close in the green, although it was only up 4-points it was a decent recovery of 26-points from the morning’s low – a few buyers appeared to have obviously earmarked the 6000-area as a level to slowly start accumulating shares. On a sector level the gold and real estate sectors performed strongly while the banks drifted lower yet again.
Individual stock volatility remains very elevated with Aristocrat (ALL) +8% and A2 Milk (A2M) +5.7%, while four medium sized stocks all fell by over 4%. As we’ve said in the last 2 Weekend Reports, MM is becoming increasingly uncomfortable with the huge wings in many stocks on an almost a daily basis. i.e. volatility may be quiet on an index level but its increasing “under the hood”.
• MM remains mildly bullish ideally targeting ~6250 for the ASX200 BUT we remain in “sell mode”.
Fund managers are expecting some MSCI selling to hit the local market into the end of this month, due to China’s inclusion into the global index which by definition will marginally dilute the Australian stocks component – the major large cap names and hence the index are the most likely targets.
The MSCI World Index for example is a market cap weighted stock index of 1649 stocks from throughout the world which is used as a common benchmark for fund managers to simply attempt representation of a broad cross-section of global markets. Hence if some Chinese stocks join the list of the World Index, or other MSCI indices, it creates selling elsewhere to balance the index.
Following on from comments in yesterday afternoons note, today’s report is going to look at the Australian gold sector which remains firm while the precious metal has been slipping lower on a strengthening $US.
ASX200 Chart
The Strength Within the Australian Gold Sector
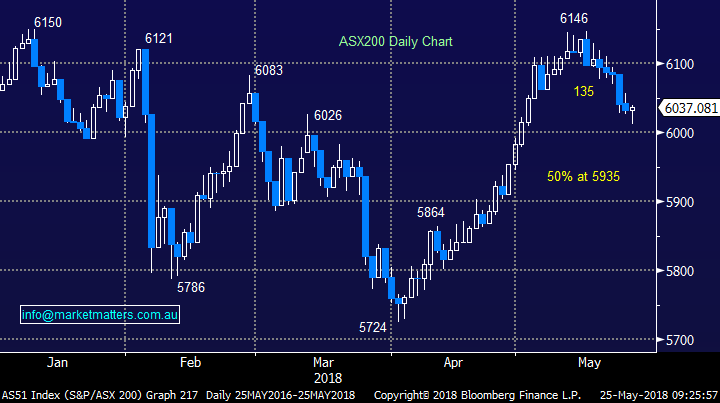
In the press we always see gold quoted in $US/oz and as such the precious metal has traded sideways to lower for the last 5-months with it actually making fresh 21-week lows on Monday, down around 6% from the highs of 2018.
Gold $US Chart
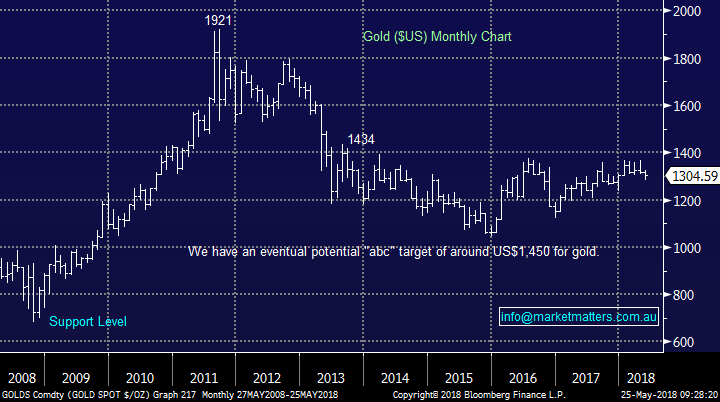
However, the story is very different when we look at gold in Australian dollar terms. In $A terms gold had rallied slowly all year actually making fresh 18-month highs on Monday.
This clearly shows the benefits of a weak local currency ($A) to our gold miners and importantly remember we are bearish the $A targeting the 65c area, over 10% lower.
Gold $A Chart
The Australian dollar has fallen in 2018 but remains ~10% above its lows of 2016 i.e. below the psychological 70c area.
Interestingly the 2 ½ year recovery in the $A coincides perfectly with the boom in our resources sector e.g. BHP has more than doubled.
The Australian Dollar ($A) Chart
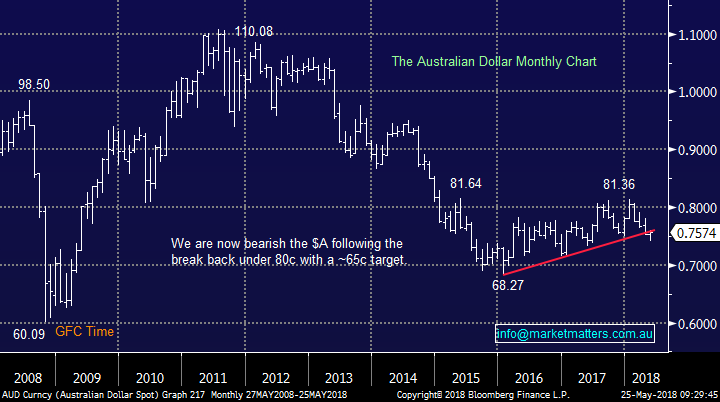
As you know at MM we believe the $A will ultimately fall to around 65c due to a number of aligning macro-economic factors, hence our gold stocks being effective offshore earners should perform well.
Also, if we are correct and global equities will experience a correction of ~20% in 2018/19 the gold sector has a good chance of being a perfect place to “hide”.
Hence today we are going to review our thoughts on 3 leading Australian gold stocks with a view to buying one in the coming weeks / months – seasonally, like much of the local market, the end of June / start of July is the time to wade into our gold sector.
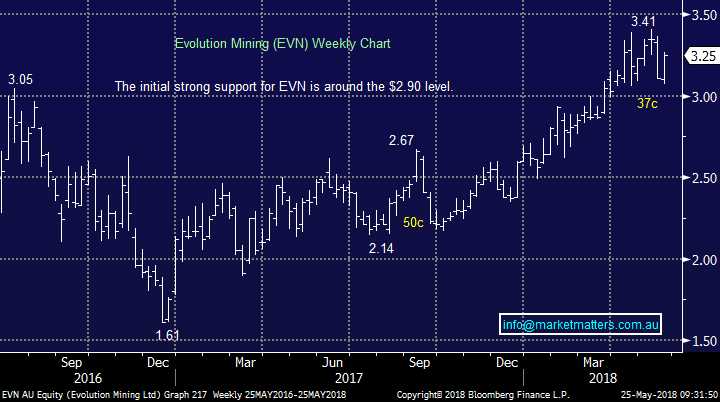
1 Evolution Mining (EVN) $3.25
EVN again looks strong after correcting ~10% over the last 3-weeks and flirting with our $2.90-$3 targeted buy region. This stock like many in the resources space can be fairly volatile and has already experienced 4 corrections of between 10 and 23% since its major swing low in December 2016. Hence while we are a buyer of EVN into weakness we are not chasing strength at this point in time.
• MM is currently a buyer of EVN below $3.
Evolution Mining (EVN) Chart
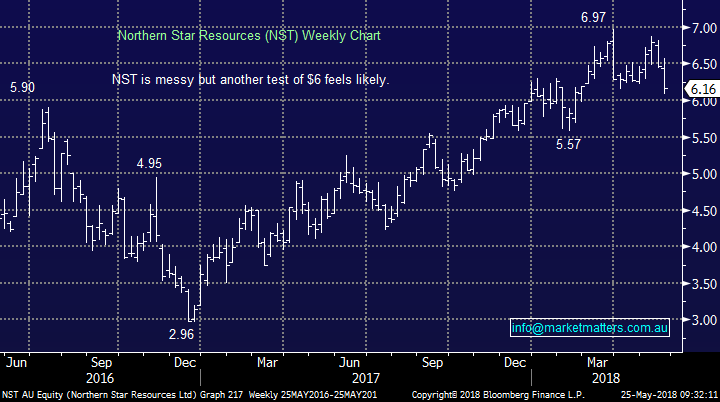
2 Northern Star (NST) $6.16
NST has enjoyed a strong 18-months but after correcting ~13% since the end of March continued weakness below $6 would not surprise.
• We are neutral NST at present and prefer EVN into any sector weakness.
Northern Star (NST) Chart
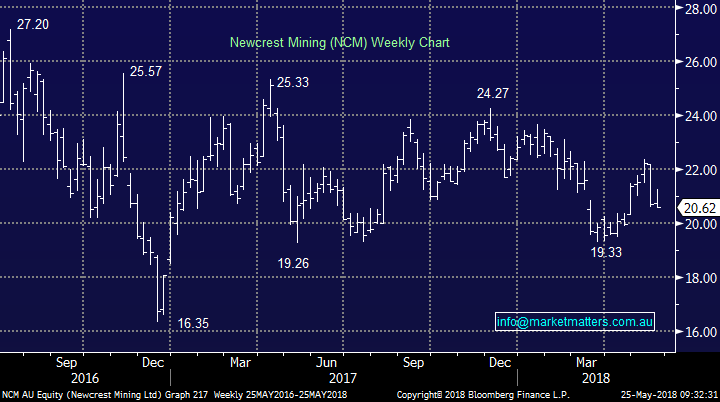
3 Newcrest Mining (NCM) $20.62
Heavyweight NCM has been the clear “dog” of the sector not only failing to rally with EVN and NST but actually managing to fall – over the last 12-months NCM is down -0.8% compared to EVN which is +32%. Unfortunately, NCM has been a serial market disappointment on the corporate level, at times rivalling QBE with its negative consistency.
However, as we regularly say successful investing is about looking forward, not back and NCM would become interesting below $19 in the coming months.
• MM may consider accumulating NCM into weakness below $19 later in the year but EVN is our preferred play at current prices.
Newcrest Mining (NCM) Chart
Conclusion (s)
MM likes the gold sector into potential weakness in June, EVN is our current preference but this may waiver depending on relative performance and of course company news.
Global indices
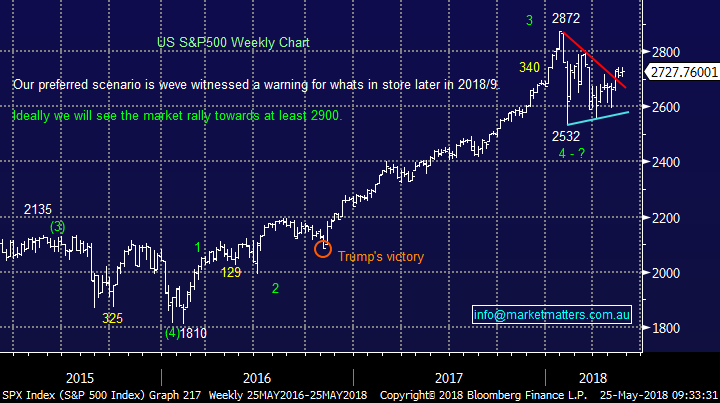
Overnight markets were quiet with the US S&P500 falling only 0.2%, although it did recover well from an early drop of almost 1%.
We remain short-term bullish US stocks targeting ~6% upside for the S&P500.
US S&P500 Chart
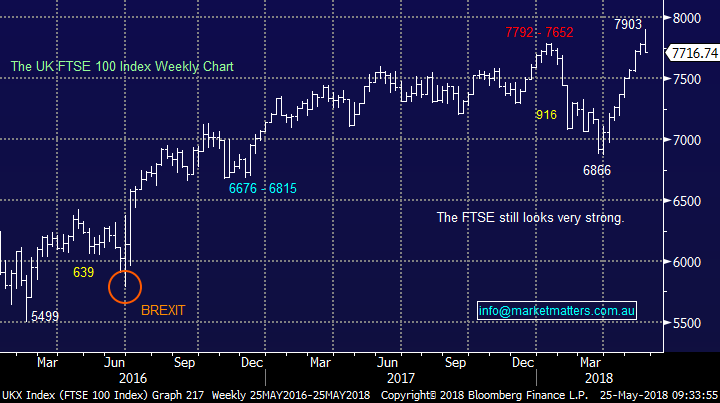
European stocks remain solid although they have struggled in recent sessions since the UK FTSE made fresh all-time highs. We are becoming increasingly cautious although ideally the German DAX can catch up with the UK.
UK FTSE Chart
Overnight Market Matters Wrap
- The US closed marginally lower overnight, following President Trump’s decision to cancel the proposed US-North Korean summit.
- Gold, which is seen as a traditional safe haven in times of escalating geopolitical tensions, had one of its best nights in a month, rallying 1.2% to US$1310/oz. The broader base metal suite was also slightly stronger, with iron ore recovering recent lost ground, with a 3.5% rebound, back above US$66.38/t. The oil price on the other hand slipped with crude oil down to US$70.72/bbl.
- The June SPI Futures is indicating the ASX 200 to open 27 points lower towards the 6010 level this morning.
Have a great day!
James & the Market Matters Team
Disclosure
Market Matters may hold stocks mentioned in this report. Subscribers can view a full list of holdings on the website by clicking here. Positions are updated each Friday, or after the session when positions are traded.
Disclaimer
All figures contained from sources believed to be accurate. Market Matters does not make any representation of warranty as to the accuracy of the figures and disclaims any liability resulting from any inaccuracy. Prices as at 25/05/2018. 8.31AM
Reports and other documents published on this website and email (‘Reports’) are authored by Market Matters and the reports represent the views of Market Matters. The MarketMatters Report is based on technical analysis of companies, commodities and the market in general. Technical analysis focuses on interpreting charts and other data to determine what the market sentiment about a particular financial product is, or will be. Unlike fundamental analysis, it does not involve a detailed review of the company’s financial position.
The Reports contain general, as opposed to personal, advice. That means they are prepared for multiple distributions without consideration of your investment objectives, financial situation and needs (‘Personal Circumstances’). Accordingly, any advice given is not a recommendation that a particular course of action is suitable for you and the advice is therefore not to be acted on as investment advice. You must assess whether or not any advice is appropriate for your Personal Circumstances before making any investment decisions. You can either make this assessment yourself, or if you require a personal recommendation, you can seek the assistance of a financial advisor. Market Matters or its author(s) accepts no responsibility for any losses or damages resulting from decisions made from or because of information within this publication. Investing and trading in financial products are always risky, so you should do your own research before buying or selling a financial product.
The Reports are published by Market Matters in good faith based on the facts known to it at the time of their preparation and do not purport to contain all relevant information with respect to the financial products to which they relate. Although the Reports are based on information obtained from sources believed to be reliable, Market Matters does not make any representation or warranty that they are accurate, complete or up to date and Market Matters accepts no obligation to correct or update the information or opinions in the Reports.
If you rely on a Report, you do so at your own risk. Any projections are estimates only and may not be realised in the future. Except to the extent that liability under any law cannot be excluded, Market Matters disclaims liability for all loss or damage arising as a result of any opinion, advice, recommendation, representation or information expressly or impliedly published in or in relation to this report notwithstanding any error or omission including negligence.
To unsubscribe. Click Here


