US stocks & the Chinese yuan remind us of 2015/6
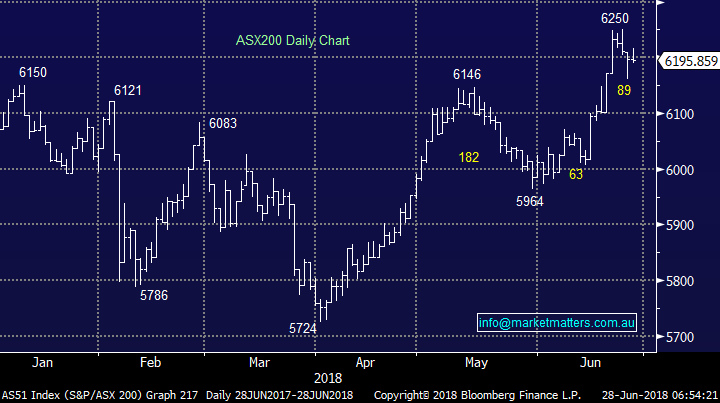
The ASX200 had a pretty choppy day finally closing down just 2-points, coincidentally just where the SPI futures indicated the market would open in the morning. Now only 2-days until the EOFY, time certainly flies and while the market has clearly been under pressure the last few days an interesting statistic came to our attention last night:
- Australian stocks usually enjoy the 4-day period that straddles the financial year end (Last 2-days of FY & first 2-days of FY) is inordinately Bullish for Australian equity investorsaveraging a return of +0.95%, significantly above the average.
This not surprisingly shows us that fund managers want to look good around EOFY and if the market does struggle here it’s a warning that all is not well with the Australian market, or alternatively it stocks can hold up into mid next week they may just crack when least expected i.e. after fund managers have ruled off for EOFY. This is another easy to understand characteristic of the local markets seasonality similar to the “Christmas rally” when fund managers want all to look healthy at the end of the calendar year, another rule off period for many.
Overnight US stocks were again sold-off fairly aggressively, particularly from early highs with the tech based NASDAQ leading as is so often the case, it fell -1.4% and has now already corrected almost 5% from last week’s all-time high. The SPI futures are only indicating an initial 15-point fall by the ASX200 which concurs with the above seasonal strength but if we are correct and the US market is in real trouble here then this year is likely to be a test for local stocks.
- Short-term MM is neutral with a close below 6140 required to switch us bearish, however we remain in “sell mode”.
Today’s report is going to focus on what’s happening between China and the US plus importantly their respective markets. Also, a second section which includes a video with Charlie Aitken and myself touching on momentum investors – around $500m being managed between us hence could be worth a read / listen.
ASX200 Chart
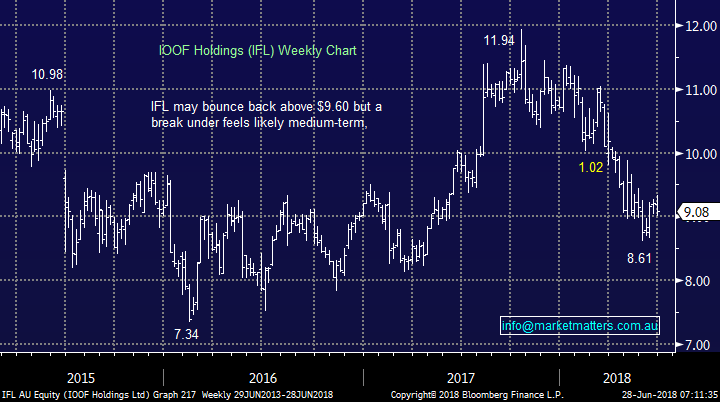
Yesterday MM sold our position in IOOF Holdings (IFL) deciding to follow the path of cutting our least favourite position into EOFY, unfortunately realising a loss of ~12% in the process.
While we believe IFL is cheap relative to its current earnings profile, we are concerned around the increasing complexity of future earnings on a number of fronts.
- Following the Royal Commission into financial advice, the Govt has put forward a proposal to cap superannuation fees to 3% for balances below $6,000. This will have a negative impact on IFL earnings in future years.
- Furthermore, the Royal Commission has put pressure on planners to forgo grandfathered commissions – which is 100% the right call, however if IFL do this it will have a further negative impact on earnings.
Simply, we think there are too many variables for IFL at this point in time. i.e. Sell – take a loss and look elsewhere.
Technically the picture is also weak and although a bounce towards $9.60 remains a possibility a break back below $8 looks the most likely direction medium-term.
MM’s Growth Portfolio can now be summed up as below:
- We are holding 17% in $A cash and effectively 3% in $US cash through an ETF.
- We hold 72% in Australian equities with a relatively low Beta i.e. they don’t tend to accelerate down when the market corrects.
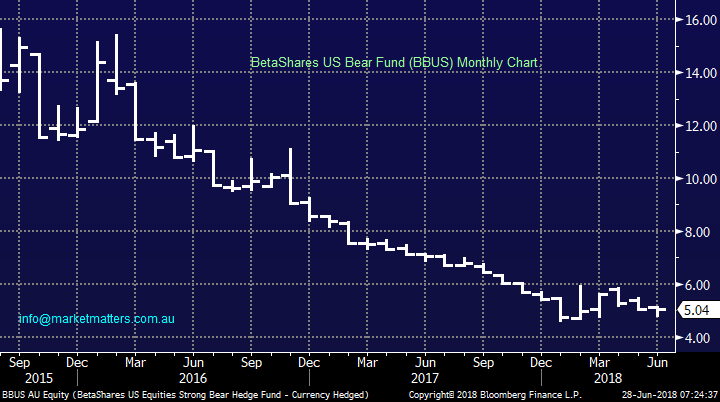
- We hold 5% in the Australian BEAR ETF and 3% in the US strong bear ETF (BBUS) effectively hedging over 10% of our portfolio.
Hence it could be interpreted that we have about a ~60% exposure to stocks at present i.e. reasonably defensive.
IOOF Holdings (IFL) Chart
China and the US (Trump) are real cause for concern.
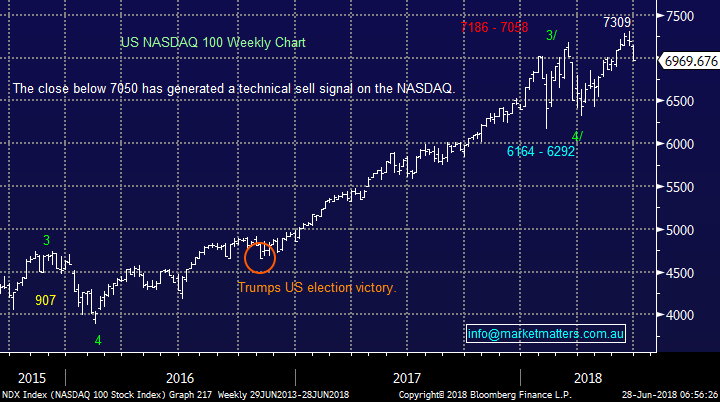
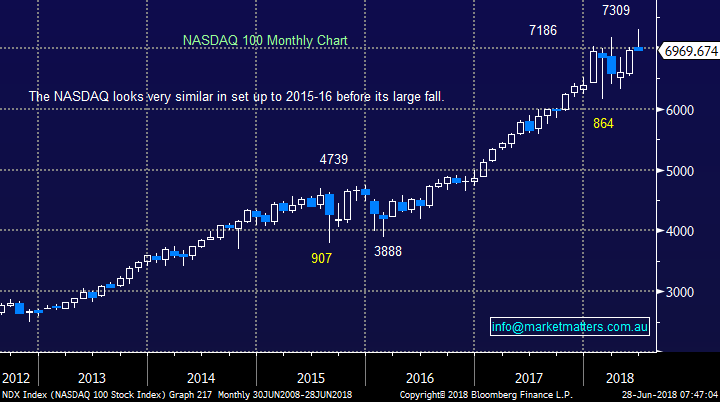
Firstly let’s look at US stocks because while we have been running our own race week to week in more sinister falls we do follow suit e.g. when the NASDAQ fell ~12% in January / February the ASX200 followed in its footsteps retreating -6.9%.
- Medium / short-term MM is now clearly bearish the NASDAQ targeting at least a further 10% decline – that would make it a 15% pullback in total.
NB MM is long the BetaShares US strong bear ETF which is likely to rally close to 20% if the NASDAQ and more importantly S&P500 test their years lows of February.
US NASDAQ Chart
BetaShares US strong bear ETF (BEAR) Chart
As we’ve pointed out previously the US market looks and feels very similar to how it did back in 2015 /6 and if this unfolds according to our roadmap not only will the NASDAQ correct another 10% but it will probably take at least a year before finding enough strength for an attempt at further meaningful gains.
It finally feels like the market has had enough of Donald Trump threatening trade relations with China, and the rest of the world - fight as he may the US population of 325-million v a booming China with 1.38 billion people makes it inevitable where the mantle of leading global economic power is heading, and its realistically already commenced the 11,640 km journey!
US NASDAQ Chart
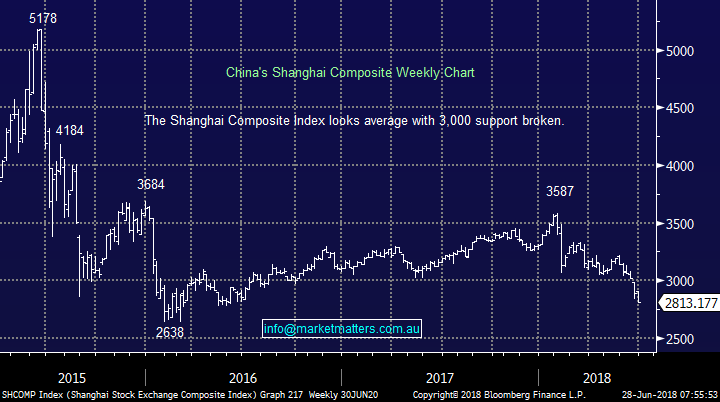
Western indices have largely ignored the meltdown of the Emerging Markets and especially the Chinese market which is already in a bear market falling over 20% but for how long we ask ourselves, they are a large part of the global economy.
However while the Chinese equity market is cause for concern it’s the move in currency land that’s catching our attention:
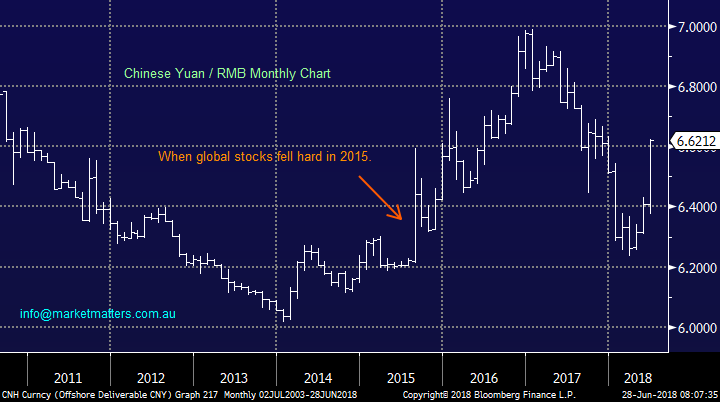
- Back in August 2015 stocks got smacked as China devalued their currency (yuan) – the Dow ultimately corrected over 16%.
- The move this month in the yuan looks extremely similar – see the second chart below.
We believe the risk / reward for stocks is currently all on the downside.
Chinese Shanghai Composite Index Chart
Chinese Yuan currency Chart
Earnings / price momentum investing.
Yesterday morning I sat down with Charlie Aitken from AIM for a quick update on his macro views and the susceptibility of the market at current levels. We discuss US tech, Asian growth, crowded trades and the scope for a large correction in global stocks. Click here to view
Charlie made a very interesting point around what a momentum investor will pay for a stock and what a value investor will pay. Momentum investors simply buy momentum in earnings / price and when that momentum slows or stops, they’re out. However, how cheap does a stock need to become to entice the value guys from the sidelines? How big is that void when a stock is not attractive to the momentum guys, nor is it cheap enough for the deep value guys. That can often create a void of buyers in a particular stock for a period of time – where either the price gets cheaper, or earnings catch up.

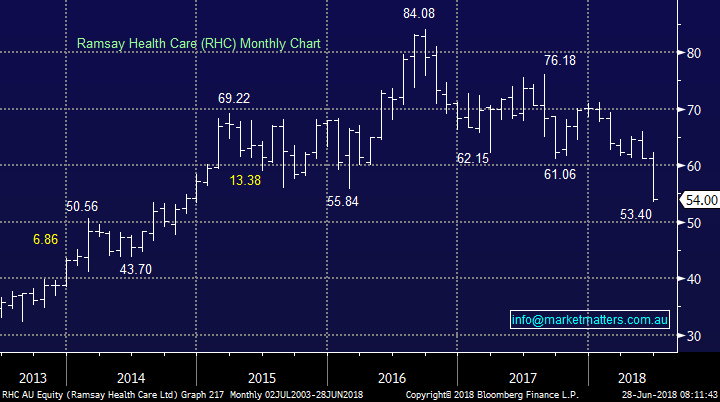
One area of the market we have been concerned around for a while is the “go to” stocks which have in most cases rallied a lot harder than we expected but with the large gains often comes increased risks which a forgetful market inevitably seems to ignore, consider the below 2 respective small groups of stocks:
Fallen from grace – Ramsay Healthcare (RHC) has corrected 36%, A2 Milk (A2M) 33.3% and Domino’s Pizza (DMP) 52%.
The above 3 stocks were all high performing stocks where investors gave little thought to the downside hence when the music stopped playing and the earnings growth faltered there were few buyers insight until a decent rerating of price had occurred.
Some standout winners (for now) – CSL Ltd (CSL), Seek Ltd (SEK), Cochlear (COH), REA Group (REA), Wistech (WTC) plus most tech based Australian stocks.
As subscribers know we like a number of the stocks above BUT not at today’s prices.
We believe a number of the above stocks, especially in the tech sector, will jump over to the “fallen” list as the euphoric earnings projections will not all be met. Too many investors are chasing the earnings growth story leaving a number of companies extremely vulnerable to the elastic band effect we so often refer to. The NASDAQ is waving a red flag here!
Ramsay Healthcare (RHC) Chart
Conclusion
We are very negative US stocks at present and by definition believe the risk / reward for Australian stocks is unattractive for now.
We can see some significant pullbacks looming in some of the markets favourite “go to” stocks which will ultimately provide some excellent buying opportunities.
Overnight Market Matters Wrap
· US stocks initially rallied after President Trump softened his stance on Chinese investment in the US, but stocks quickly moved into reverse after Larry Kudlow reiterated the US’s hard-line stance on trade with the tech. heavy, Nasdaq 100 the major lower of its peers, off 1.39%.
· Some of the funds that are flowing out of equities are moving into bonds and some analysts are thinking about revising their forecasts. A trade war could slow down global growth with less need to hike rates.
· A big US inventory draw saw oil hitting levels not seen for nearly four years amid talk of stopping Iranian oil imports by November.
· The September SPI Futures is indicating the ASX 200 to open down 20 points towards the 6175 level this morning, with plenty of the Reit sector trading ex-dividend today.
Have a great day!
James & the Market Matters Team
Disclosure
Market Matters may hold stocks mentioned in this report. Subscribers can view a full list of holdings on the website by clicking here. Positions are updated each Friday, or after the session when positions are traded.
Disclaimer
All figures contained from sources believed to be accurate. Market Matters does not make any representation of warranty as to the accuracy of the figures and disclaims any liability resulting from any inaccuracy. Prices as at 28/06/2018
Reports and other documents published on this website and email (‘Reports’) are authored by Market Matters and the reports represent the views of Market Matters. The MarketMatters Report is based on technical analysis of companies, commodities and the market in general. Technical analysis focuses on interpreting charts and other data to determine what the market sentiment about a particular financial product is, or will be. Unlike fundamental analysis, it does not involve a detailed review of the company’s financial position.
The Reports contain general, as opposed to personal, advice. That means they are prepared for multiple distributions without consideration of your investment objectives, financial situation and needs (‘Personal Circumstances’). Accordingly, any advice given is not a recommendation that a particular course of action is suitable for you and the advice is therefore not to be acted on as investment advice. You must assess whether or not any advice is appropriate for your Personal Circumstances before making any investment decisions. You can either make this assessment yourself, or if you require a personal recommendation, you can seek the assistance of a financial advisor. Market Matters or its author(s) accepts no responsibility for any losses or damages resulting from decisions made from or because of information within this publication. Investing and trading in financial products are always risky, so you should do your own research before buying or selling a financial product.
The Reports are published by Market Matters in good faith based on the facts known to it at the time of their preparation and do not purport to contain all relevant information with respect to the financial products to which they relate. Although the Reports are based on information obtained from sources believed to be reliable, Market Matters does not make any representation or warranty that they are accurate, complete or up to date and Market Matters accepts no obligation to correct or update the information or opinions in the Reports. Market Matters may publish content sourced from external content providers.
If you rely on a Report, you do so at your own risk. Past performance is not an indication of future performance. Any projections are estimates only and may not be realised in the future. Except to the extent that liability under any law cannot be excluded, Market Matters disclaims liability for all loss or damage arising as a result of any opinion, advice, recommendation, representation or information expressly or impliedly published in or in relation to this report notwithstanding any error or omission including negligence.
To unsubscribe. Click Here