Copper – another Canary chirping away! (OZL, BHP, CYB, CWN)
Riding to the office this morning sort of felt like a trip up the slow Mount Perisher double chair on a hazy morning just before first runs…a blanket of cloud engulfing the harbour and filtering between the sky scrapers, ahead of what will be cracking day in Sydney!
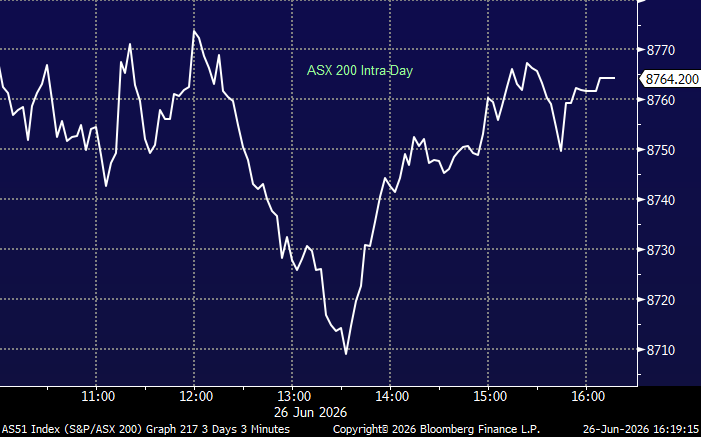
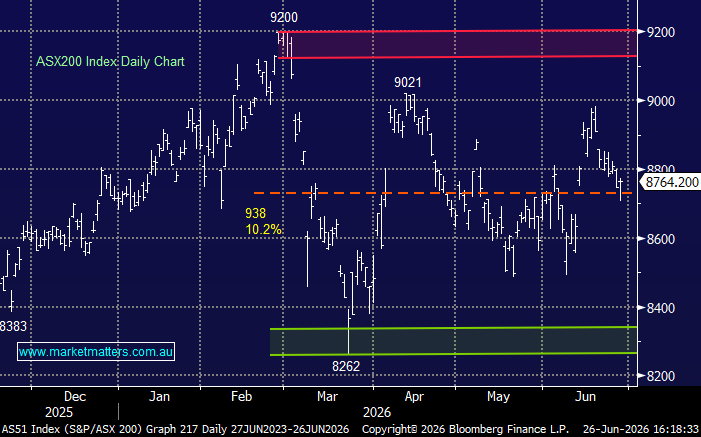
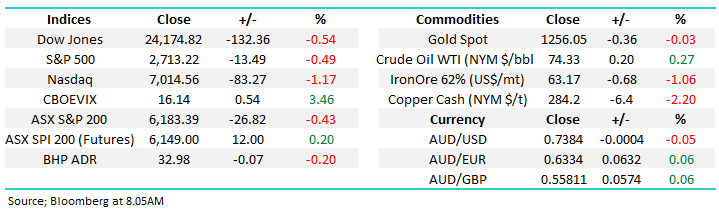
The ASX200 had a weaker session yesterday although volumes were light courtesy of school holidays and ahead of the Independence Day break in the US overnight. Selling was sustained throughout the day with both the banks and resources coming under some pressure ensuring the market simply grinded lower into the close. It was a typical sort of ‘risk off’ day with the Telco’s seeing most love followed by the Utilities and the Real Estate stocks, however selling was far from aggressive.
ASX 200 Chart
Overnight, US markets were closed however the leads from Europe were muted, although some early weakness in the French CAC and the German DAX was bought into early on. U.S Non-Farm payrolls data is out of Friday however more importantly, the U.S is scheduled to impose $US34b of tariffs on Chinese goods on Friday, with Beijing confirming they’ll reciprocate. The outcome of Friday will provide a good road map for the negotiating tactics of each side. We know Mr Trump goes in with bluster and fury early before calming the rhetoric, it’s hard to the see Chinese President Xi Jinping blinking at the first opportunity.
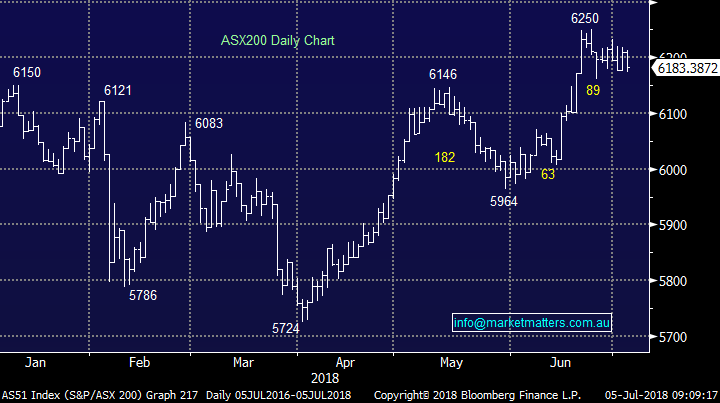
This morning, the ASX200 is set to test the 6200 level again or up around 19 points from yesterdays close
- We maintain our short term neutral / bearish view with a close below 6140 for the ASX 200 generating a clear sell signal - however we remain in “sell mode” overall.
Today’s report is going to focus mainly on Copper which traded to a 11 month low overnight. The term Doctor Copper is used widely around financial markets given the base metal is thought to have a Ph.D. in economics because of its ability to predict turning points in the global economy. The move overnight is yet another sign that caution here is warranted. As we’ve written at some length in recent notes, we believe stocks are very close to an inflection point with at least a 10% correction in the offing hence we are investing defensively at this moment in time.
Firstly to recap our current positioning in the MM Growth Portfolio.
1 - We are now holding 17% of our portfolio in $A cash and 3% in a $US ETF which means we have 3% in USD – we consider this a 20% cash position, spread between two currencies.
2 - We are now holding 8% of the portfolio in negative facing index ETF’s with the 5% exposure in Australian unleveraged while the 3% exposure in the US has leverage of 2 – 2.75x – this means we have a short exposure of around ~11%
3 - We are holding 27% in “big 4” banks plus 15% in related Suncorp (SUN) and Clydesdale Bank (CYB).
4 - We hold 30% of our portfolio in 7 other stocks
1 Copper
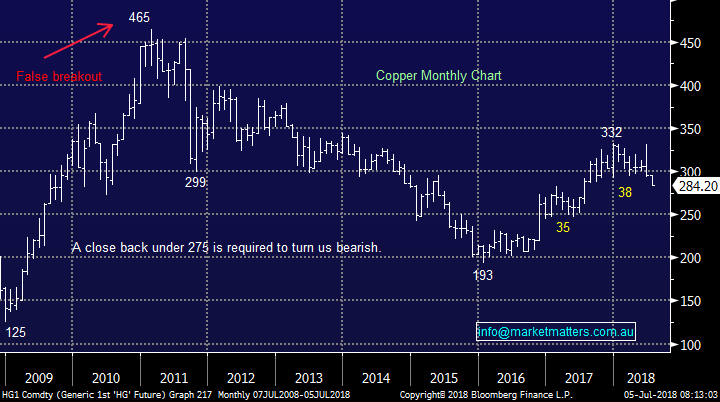
Commonly known as the bell weather of global economic activity, Copper is having a tough time in the last few months and overnight it was down another ~2% to trade near 12 month lows – the metal is now down around 10% year to date and the worst performer across most of the base metals complex. An interesting theme is now playing out known as backwardation. Normally, longer dated contracts trade at a premium to shorter dated contracts which makes sense, it costs money to store physical copper plus the usual cost of capital that plays into the equation. If traders want to ‘pay up’ for near term supply over and above longer dated supply its often viewed as a positive for prices, it sort of shows a strong near term appetite for the product, however recent prices are not really supporting that view.
The reasons for that could be put down to the usual supply and demand dynamics, where short term demand remains strong, however a likely uptick in supply over coming months / years has the market more bearish copper longer term giving traders a dimmer future view. Or in other words, buyers need to pay up now to secure supply, but they remain confident of new supply in the future.
Technically, copper needs to break 275 for us to turn bearish however momentum is clearly to the downside.
Copper Futures Chart
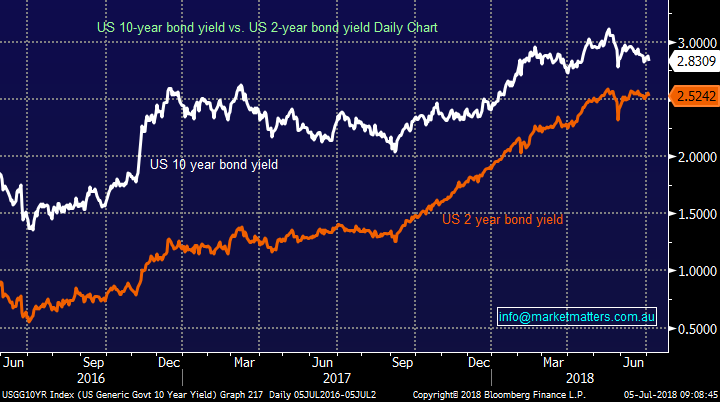
However, if we think more broadly around copper as a bell weather of economic activity and overlaying it with what we’re seeing in the bond market , it seems that both of these very different areas of the market are singing the same tune. The copper price is more optimistic about near term economic trends but less optimistic as time goes by - Bond yields are telling a similar story. Shorter term interest rates have been rising more strongly than longer term rates causing a flattening of the yield curve. A flattening yield curve can often be a sign that the markets longer term outlook for growth has become less optimistic. On the rare occasions where the curve has become inverted – short term rates higher than long term rates – it’s been a warning sign of a recession. This week the yield curve has continued to flatten with the spread between 2 & 10 year yields now sitting at 0.31% - the narrowest of margins since before the GFC.
This is another sign that the market is becoming less optimistic about the trajectory of future growth.
US 10 year bond yields v US 2 year bond yields
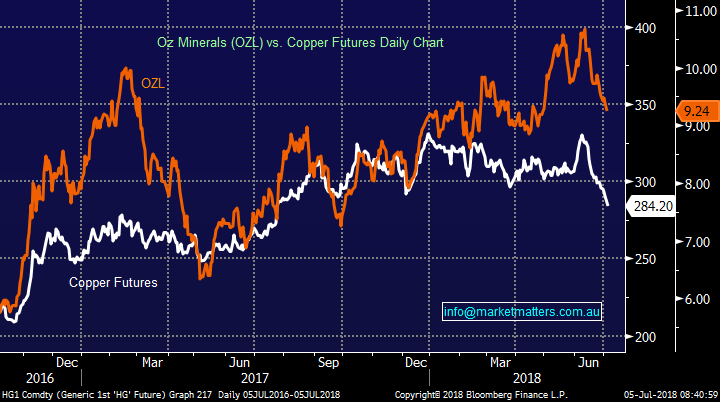
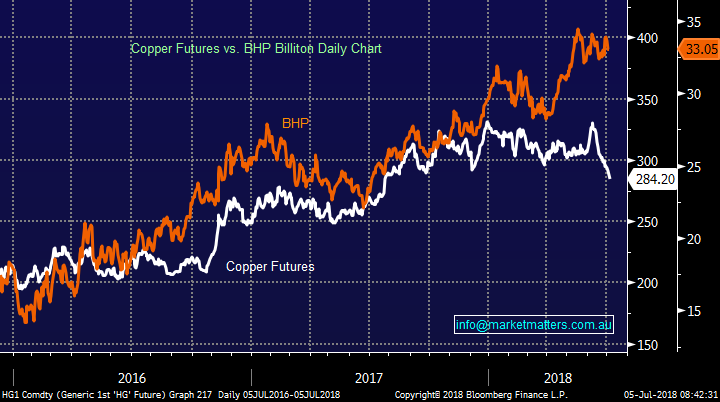
Without stating the obvious, copper prices have a strong impact on Copper focussed equities such as OZ Minerals (OZL), BHP and Sandfire Resources (SFR). In the bigger picture we remain do bullish both interest rates and inflation - excellent ingredients for resource stocks to rally however it’s important to remember that resource stocks and their underlying commodities are historically volatile beasts which creates opportunities for the relatively nimble.
We have been targeting a buy level in OZL below $9.00 and BHP below $30. The current trends in the copper price are clearly making these targets realistic ones.
Oz Minerals (OZL) v Copper Price
BHP v Copper Price
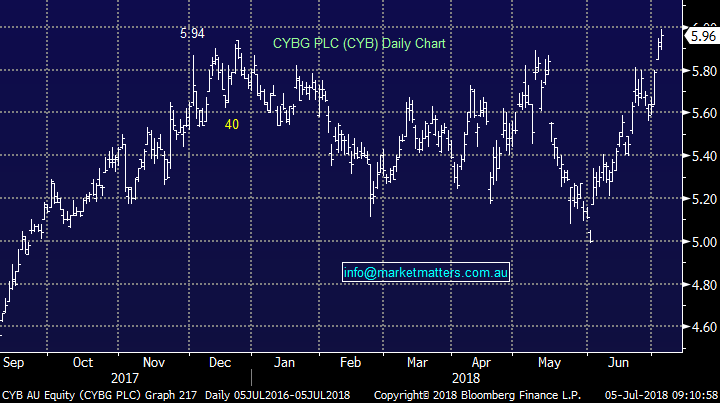
2 CYBG (CYB) $5.96
CYB has been a very rocky journey for MM since we went long in November with the stock oscillating in large ~18% range. While we like its current merger with Virgin Money the recent rally in share price has been explosive and now we see a lot of future optimism been built into the price. We gave this stock room to move during bouts of weakness while holding the the long held view of selling into strength around $6. We may get that opportunity today.
We are sellers of CYB around $6.00 **Watch for alerts**
CYB Chart
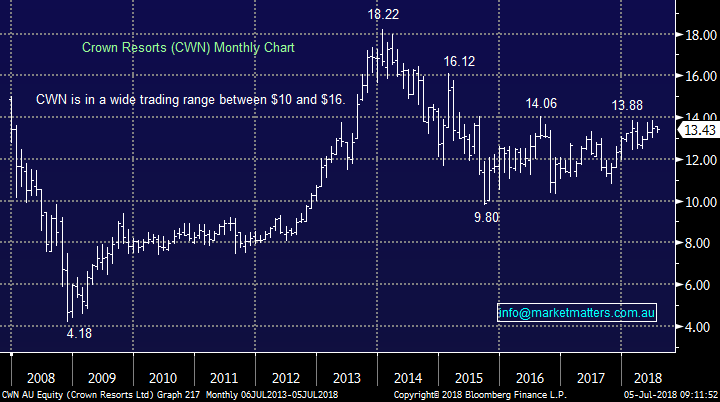
3 Crown Resorts (CWN) $13.43
We spoke about CWN a few weeks ago looking to buy below $13 into weakness or on a technical break above the key $14 resistance region that CWN has held for over 2 years. Given the positive undercurrents in CWN we believe it’s a matter of time before it gets rerated to the upside – the opening date for the upmarket 6-star, pokies free Barangaroo casino is on track for 2021 . CWN is currently trading on 25.6x while yielding a solid 4.4% fully franked – the next dividend is due in September.
We like CWN below $13 but will be tempted to buy at higher prices if the stock generates technical buy signals
Crown Resorts (CWN) Chart
Overseas Indices
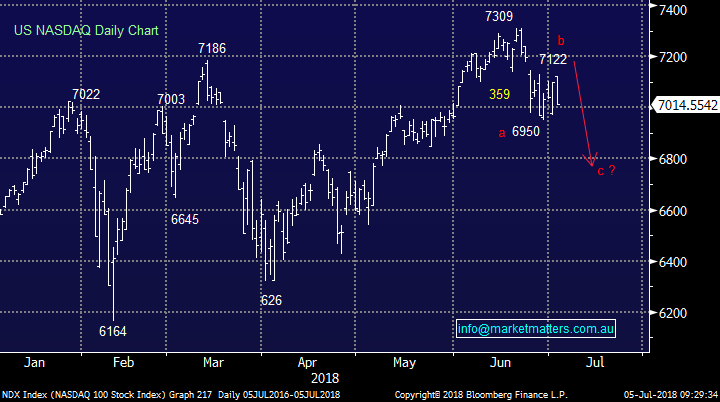
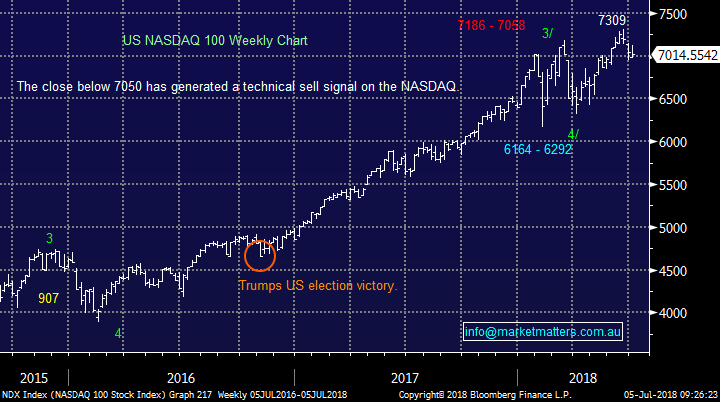
Firstly looking at the high flying tech based NASDAQ which we believe often leads other indices both up and down.
1. We have been targeting a consolidation between 7500 and 6500, this now looks more likely to be between 7300 and 6300 i.e. we see another 10% downside.
2. In the shorter-term we have been targeting a close below 7050 to generate a sell signal targeting 6200, over 10% lower – achieved today.
We are now bearish the NASDAQ and US stocks until further notice.
US NASDAQ Chart
US NASDAQ Chart
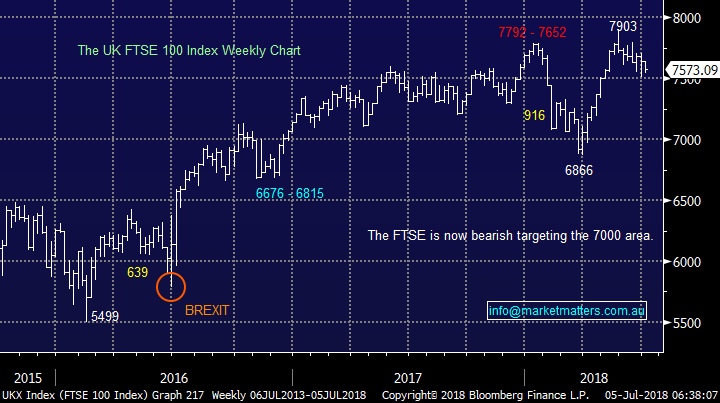
We’ve been watching the UK FTSE very carefully over the last month for 2 important reasons:
1. The FTSE has provided a clear technical roadmap for MM and last night it generated a strong sell signal targeting ~7000.
2. The correlation between the UK FTSE and the ASX200 is far stronger than say with US indices.
UK FTSE Chart
Conclusion (s)
Recent weakness in the copper price is another negative sign for equities in the near term
We will look to sell CYB if the opportunity arises today
We have Crown on the radar as a potential buy
Have a great day!
James & the Market Matters Team
Disclosure
Market Matters may hold stocks mentioned in this report. Subscribers can view a full list of holdings on the website by clicking here. Positions are updated each Friday, or after the session when positions are traded.
Disclaimer
All figures contained from sources believed to be accurate. Market Matters does not make any representation of warranty as to the accuracy of the figures and disclaims any liability resulting from any inaccuracy. Prices as at 05/07/2018
Reports and other documents published on this website and email (‘Reports’) are authored by Market Matters and the reports represent the views of Market Matters. The MarketMatters Report is based on technical analysis of companies, commodities and the market in general. Technical analysis focuses on interpreting charts and other data to determine what the market sentiment about a particular financial product is, or will be. Unlike fundamental analysis, it does not involve a detailed review of the company’s financial position.
The Reports contain general, as opposed to personal, advice. That means they are prepared for multiple distributions without consideration of your investment objectives, financial situation and needs (‘Personal Circumstances’). Accordingly, any advice given is not a recommendation that a particular course of action is suitable for you and the advice is therefore not to be acted on as investment advice. You must assess whether or not any advice is appropriate for your Personal Circumstances before making any investment decisions. You can either make this assessment yourself, or if you require a personal recommendation, you can seek the assistance of a financial advisor. Market Matters or its author(s) accepts no responsibility for any losses or damages resulting from decisions made from or because of information within this publication. Investing and trading in financial products are always risky, so you should do your own research before buying or selling a financial product.
The Reports are published by Market Matters in good faith based on the facts known to it at the time of their preparation and do not purport to contain all relevant information with respect to the financial products to which they relate. Although the Reports are based on information obtained from sources believed to be reliable, Market Matters does not make any representation or warranty that they are accurate, complete or up to date and Market Matters accepts no obligation to correct or update the information or opinions in the Reports. Market Matters may publish content sourced from external content providers.
If you rely on a Report, you do so at your own risk. Past performance is not an indication of future performance. Any projections are estimates only and may not be realised in the future. Except to the extent that liability under any law cannot be excluded, Market Matters disclaims liability for all loss or damage arising as a result of any opinion, advice, recommendation, representation or information expressly or impliedly published in or in relation to this report notwithstanding any error or omission including negligence.
To unsubscribe. Click Here