The $US, crude oil, copper & gold are making a fascinating puzzle (ORE, KDR, CSL, MQG, ORG, OZL, EVN, RRL)
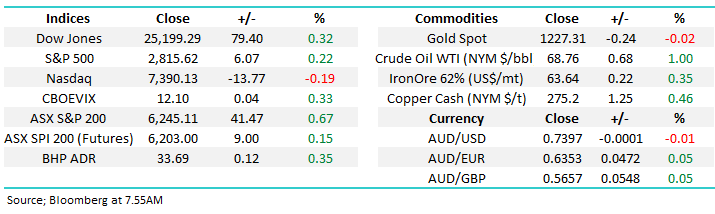
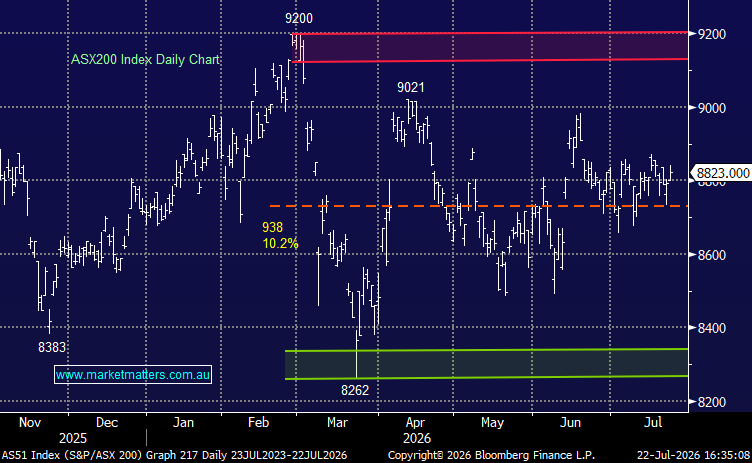
The ASX200 enjoyed an excellent rebound as the day to day choppy price action continues, this time it was the BHP show as the “Big Australian” rallied over 3% following some strong production numbers. Overall the broader market was also strong with the exception of the energy sector which continues to decline in line with our bearish view, and of course the underlying crude oil price.
A weak $A again helped the offshore earners yesterday with the likes of Macquarie Group (MQG) +2.3%, ResMed (RMD) +1.5% and CSL Ltd (CSL) +1.3% all enjoying the strong earnings tailwind. Longer-term we remain bearish the $A but are slowly becoming concerned that the consensus is too becoming bearish the “little Aussie battler” and a short-term snap back maybe close at hand.
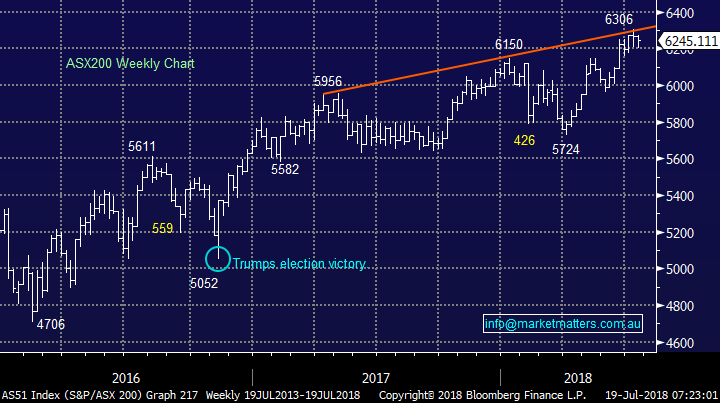
· Short-term MM is neutral the ASX200 with a close below 6140 required to switch us to a more bearish stance, however we remain in “sell but patient mode”.
Overnight stocks were quiet with small gains in the financials within the S&P500 were offset by a weaker NASDAQ, the local market looks set to open a few points firmer.
Today’s report is going to focus on the $US (including the $A) touched on above and the recent weakness in mainstream commodities crude oil, copper and gold.
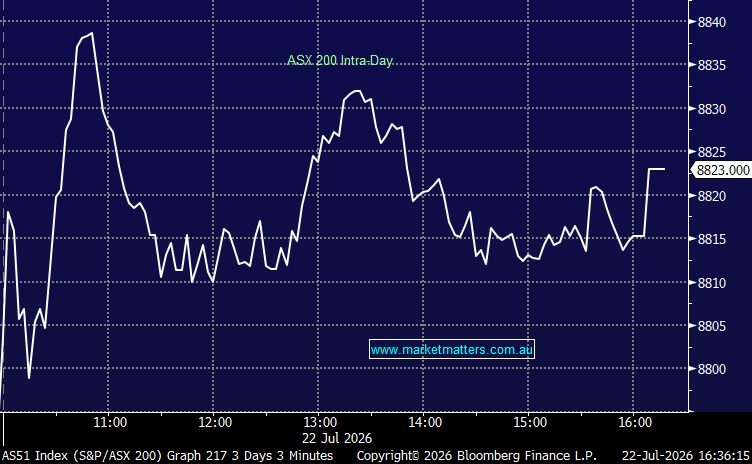
ASX200 Chart
Potential “moves” by MM
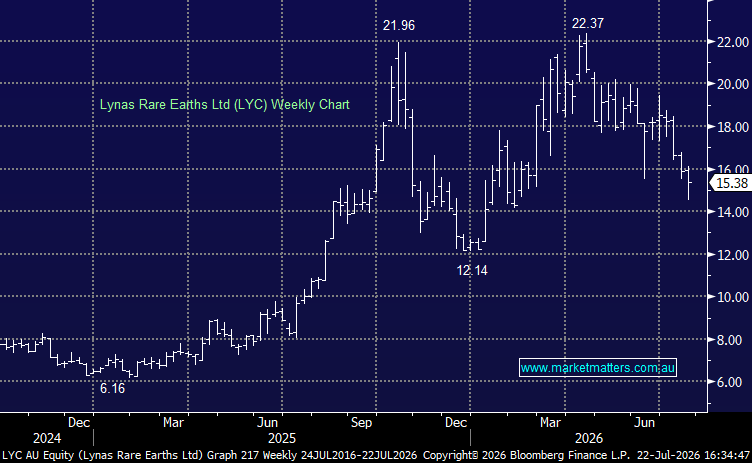
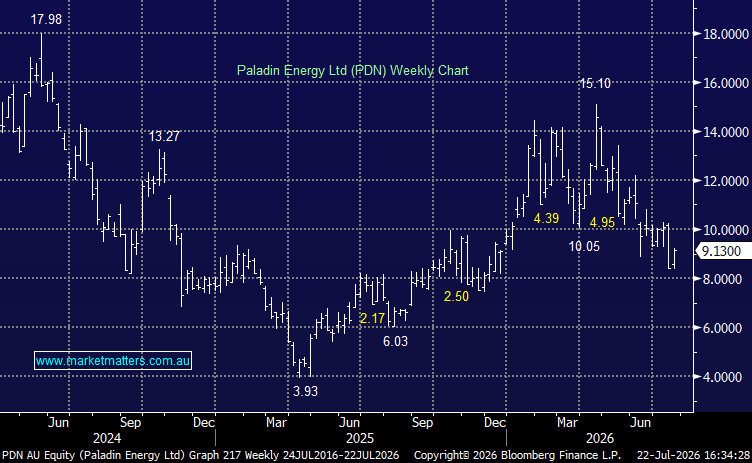
We’ve enjoyed the boom in lithium stocks at MM over the last 12-months although our current position long ORE is down on paper.
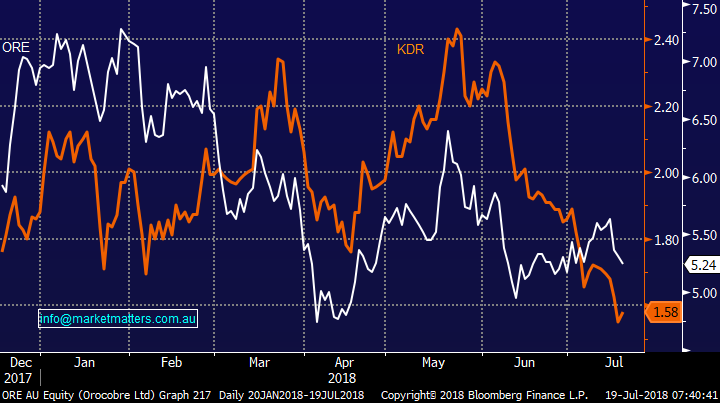
Basically we’ve been investing via our two favourite vehicles in the space Orocobre (ORE) and Kidman Resources (KDR), at times being happy to switch between the two miners. Currently we are watching closely their respective strength since late May:
· ORE has slipped 18% from a high of $6.40 while KDR has plunged 36% from $2.48.
We are considering taking a loss in ORE because we feel KDR is presenting better exposure / value to the sector at current prices.
Orocobre (ORE) v Kidman Resources (KDR) Chart
1 The $US and $A
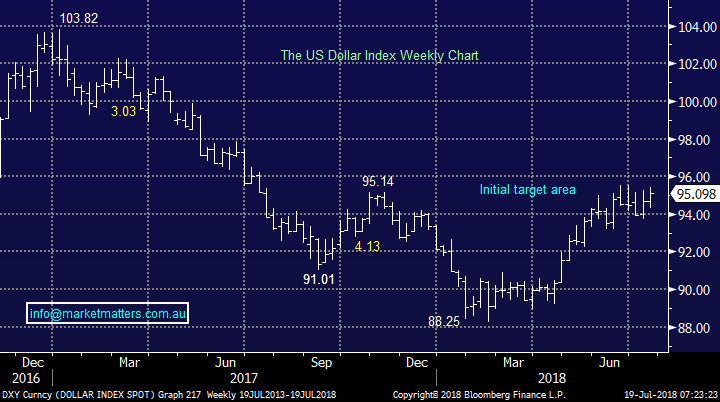
A rising $US was one of our favourite picks for 2018 and its followed our script so far with over half the year behind us. The $US has been bid higher on the back of rising US-China trade uncertainties and simply the Fed pushing US interest rates higher.
· At this stage we are ideally looking for a last push to fresh annual highs by the $US index, probably above the 96 area before some consolidation is likely to unfold.
If this does materialise the currency led pressure on the commodities should be close to ending. We are very mindful that the “masses” who were bearish the $US at the start of the year have turned on a sixpence to become bullish, a concern to us short-term.
The $US Index Chart
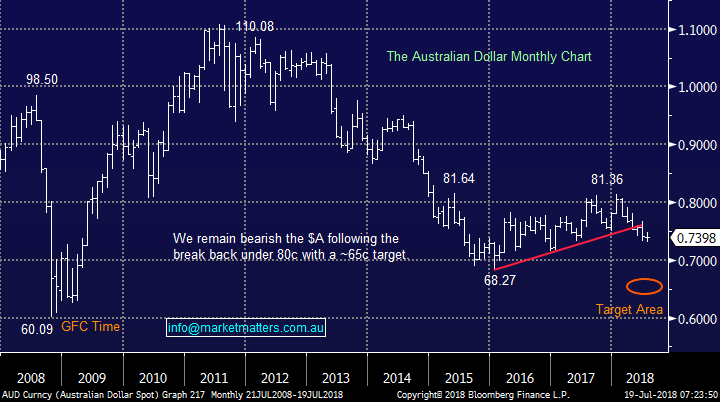
The Australian Dollar ($A) remains in a long-term downtrend with its GFC low down at 60c slowly creeping into view.
Both the current / future interest rate differential between the US and Australia is very supportive of the $US at this pointy in time i.e. investors get paid more interest on the $US holdings, a rare occurrence on a historical level. Conversely a resurgent China / commodities market would certainly help the $A short-term.
At MM we remain bearish the $A into 2019 targeting the 65c area and hence hold a position in the BetaShares $US ETF within our Growth Portfolio.
The $A Chart
Following our bearish opinion on the $A exposure to $US earners makes sense but the trouble is they have run hard and are certainly not sitting in the “cheap” basket.
However we do feel local investors have almost stampeded into some of the more high profile candidates to $US revenue leaving scope for a quick snap back if / when the $US gives back some its 2018 gains – we are buyers of weakness but not chasers of strength.
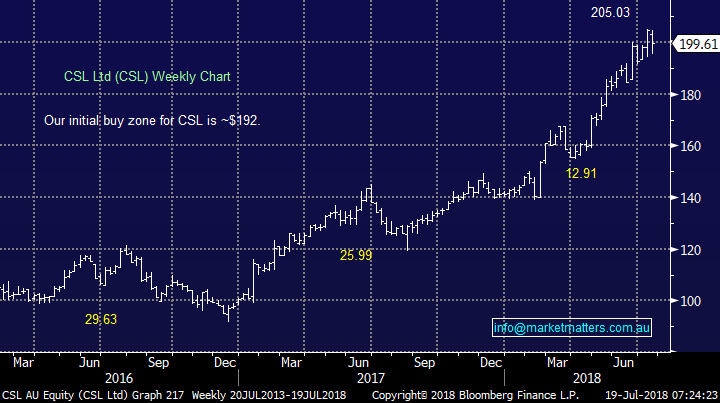
· MM likes Macquarie Bank (MQG) into a $9 pullback and similarly CSL Ltd (CSL) $13 lower.
CSL Ltd (CSL) Chart
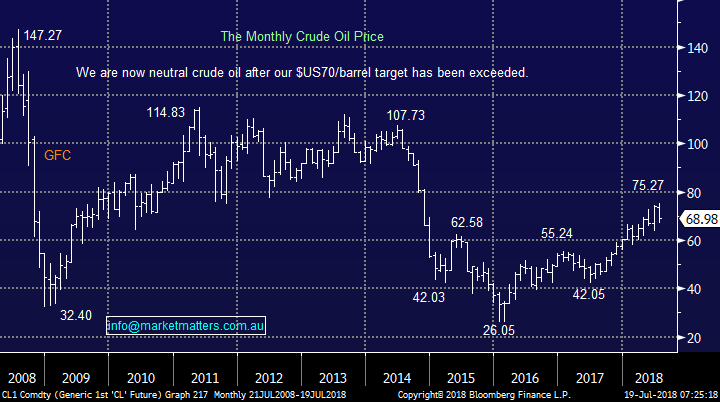
2 Crude Oil $US68.75/barrel
Crude oil has enjoyed a strong 12-months with the rhetoric / actions of OPEC helping push the price up over 75% however we are mindful now that Saudi Arabia and co. are talking the price lower if anything.
· Short-term we are bearish crude targeting ~$US62/barrel, or almost 10% lower.
In the bigger picture we are now unsure what comes next for oil.
Crude oil Chart
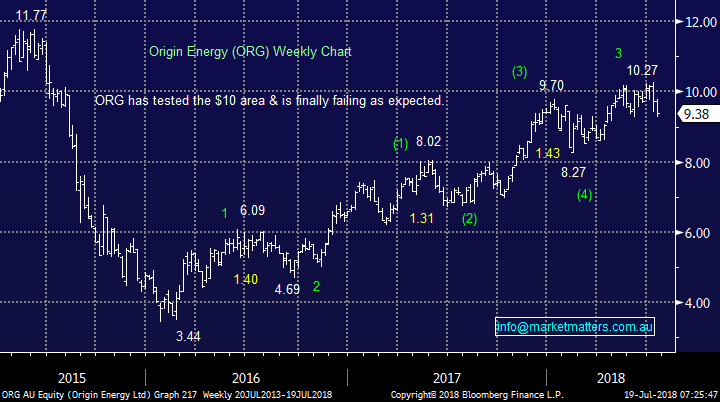
At MM we have been bearish the likes of Origin Energy from above the $10 area for a while and this coincides with our thoughts around energy prices.
· We remain bearish ORG, ideally targeting the $8.50 area.
Origin Energy (ORG) Chart
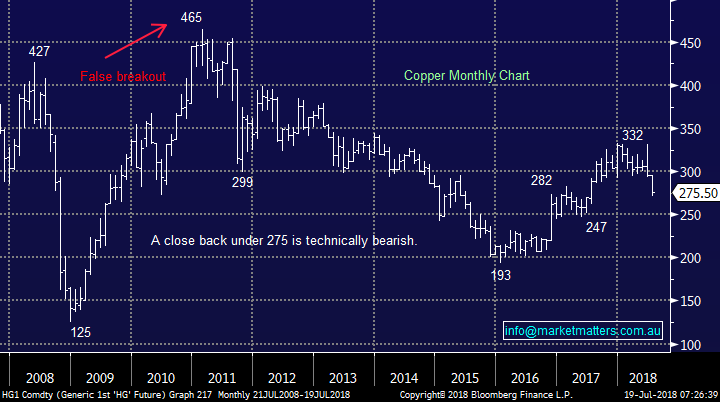
3 Copper $US277/lb
The worlds 3rd most widely used metal, copper, has been smashed over the last 2-months with strong rumours surfacing of a huge “shadowy” Chinese fund being at the centre of the close to 20% rout – the speculative short position has reached around 18%, a level not seen since 2016 which ended up being an excellent year for copper.
The catalyst for the fall has been concerns over US-China trade tensions and if they eventually dissipate like much of Trump inspired worries a solid recovery appears likely.
Copper Chart
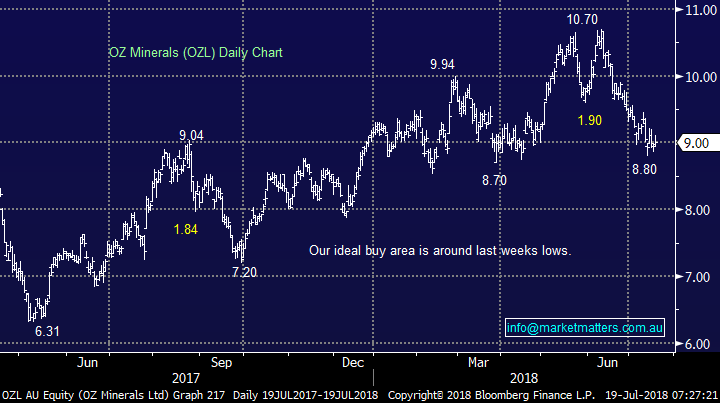
Australia’s premium copper producer Oz Minerals (OZL) has corrected 17.7% tracking copper lower almost tick for tick.
· Considering the risk / reward of a copper recovery OZL feels good value around $9 for the brave.
OZ Minerals (OZL) Chart
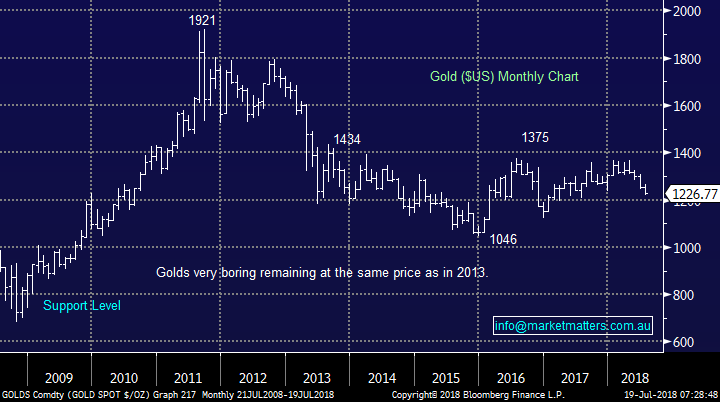
4 Gold $US1227/oz
Gold is usually quoted and discussed in $US and as such it had an extremely boring 5-years which is showing no signs of changing for now.
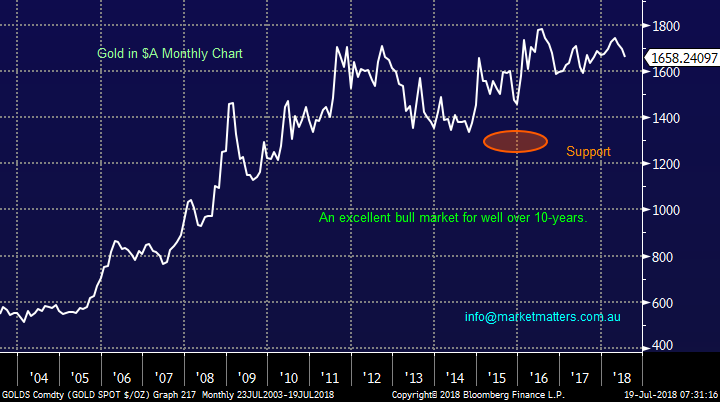
However, when we consider the precious metal in $A, which is what matters to Australian gold miners, the story is very different i.e. an almost 15-year bull market courtesy of a falling $A.
· In $A terms gold now feels tired and a 15% correction would not surprise – not good news for the local sector.
Gold ($US) Chart
Gold ($A) Chart
The local gold sector continues to trade with very different degrees of success e.g. over the last month Northern Star (NST) +12% while Newcrest Mining (NCM) -4% and Evolution mining (EWVN) down a whopping 10%.
Similar to almost the entire market the mid-cap miners have outperformed their large cap rivals, another trend we can see reverting to a degree as so many investors start discussing the phenomenon.
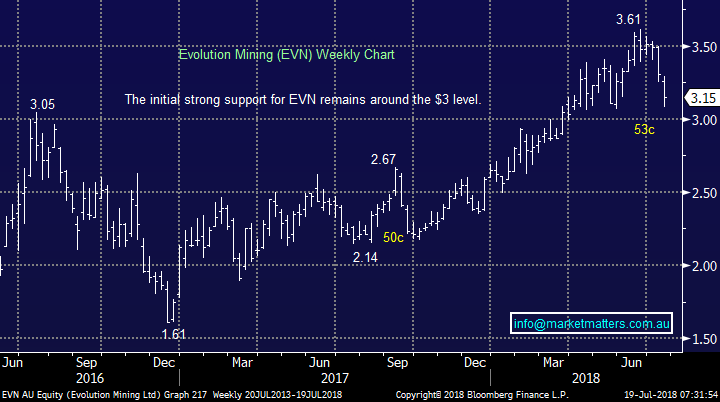
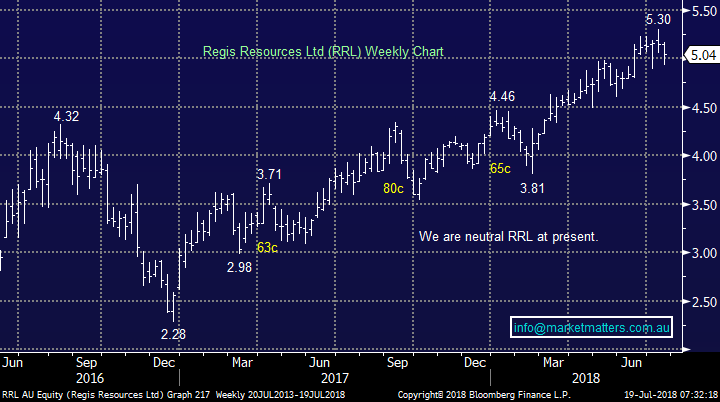
MM’s favourite 2 stocks in the sector and the levels where they will become attractive:
· Evolution Mining (EVN) below $3.10 and Regis Resources (RRL) ~$4.60.
Evolution Mining (EVN) Chart
Regis Resources (RRL) Chart
Conclusion
MM thinks a correction lower for the $US is on balance close to hand hence it’s not a time to chase $US earners but we will have interest in the likes of MQG and CSL into weakness.
We are not keen on the energy sector but see more upside potential in the copper sector at this point in time.
We are watching opportunities closely in EVN and OZL both of whom gave production reports to the market early this morning.
Overseas Indices
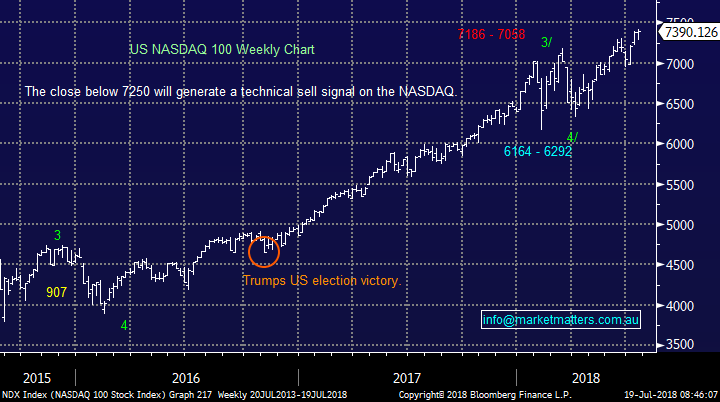
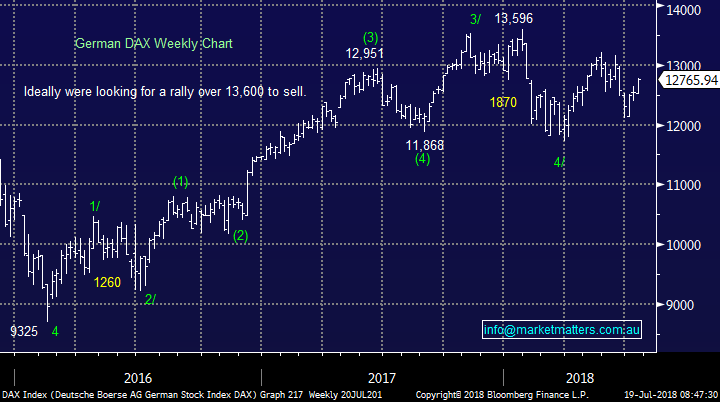
The tech-based NASDAQ is trading around its all-time high while the European markets are starting to play catch-up.
We remain on alert for a decent market correction but the time does not yet feel upon us.
US NASDAQ Chart
German DAX Chart
Overnight Market Matters Wrap
· The major US equity markets closed mixed with marginal change overnight, with the Dow and S&P 500 ending their session in positive territory, while the tech. heavy Nasdaq 100 closed lower.
· The lead was seen in the financial sector, following Morgan Stanley’s earnings beating the average estimate on the street.
· The miners are expected to extend their gains, with BHP in the US ending its session up an equivalent of 0.35% from Australia’s previous close.
· The September SPI Futures is indicating the ASX 200 to open 17 points higher, above the 6260 support level this morning.
Have a great day!
James & the Market Matters Team
Disclosure
Market Matters may hold stocks mentioned in this report. Subscribers can view a full list of holdings on the website by clicking here. Positions are updated each Friday, or after the session when positions are traded.
Disclaimer
All figures contained from sources believed to be accurate. Market Matters does not make any representation of warranty as to the accuracy of the figures and disclaims any liability resulting from any inaccuracy. Prices as at 19/07/2018
Reports and other documents published on this website and email (‘Reports’) are authored by Market Matters and the reports represent the views of MarketMatters. The Marketmatters Report is based on technical analysis of companies, commodities and the market in general. Technical analysis focuses on interpreting charts and other data to determine what the market sentiment about a particular financial product is, or will be. Unlike fundamental analysis, it does not involve a detailed review of the company’s financial position.
The Reports contain general, as opposed to personal, advice. That means they are prepared for multiple distributions without consideration of your investment objectives, financial situation and needs (‘Personal Circumstances’). Accordingly, any advice given is not a recommendation that a particular course of action is suitable for you and the advice is therefore not to be acted on as investment advice. You must assess whether or not any advice is appropriate for your Personal Circumstances before making any investment decisions. You can either make this assessment yourself, or if you require a personal recommendation, you can seek the assistance of a financial advisor. Market Matters or its author(s) accepts no responsibility for any losses or damages resulting from decisions made from or because of information within this publication. Investing and trading in financial products are always risky, so you should do your own research before buying or selling a financial product.
The Reports are published by Market Matters in good faith based on the facts known to it at the time of their preparation and do not purport to contain all relevant information with respect to the financial products to which they relate. Although the Reports are based on information obtained from sources believed to be reliable, Market Matters does not make any representation or warranty that they are accurate, complete or up to date and Market Matters accepts no obligation to correct or update the information or opinions in the Reports. Market Matters may publish content sourced from external content providers.
If you rely on a Report, you do so at your own risk. Past performance is not an indication of future performance. Any projections are estimates only and may not be realised in the future. Except to the extent that liability under any law cannot be excluded, Market Matters disclaims liability for all loss or damage arising as a result of any opinion, advice, recommendation, representation or information expressly or impliedly published in or in relation to this report notwithstanding any error or omission including negligence.
To unsubscribe. Click Here