The Healthcare stocks come under pressure (CSL, COH, RMD, ANN, RHC)
The ASX200 started the day poorly, initially falling 40-points before bargain hunters began chipping away and the market bounced to close down only 0.3% - the trend of buying weakness and selling strength remains intact. The healthcare sector was the main market drag while the telco’s outperformed – that’s certainly not been de rigueur of recent years.
With one trading day remaining July is poised to have the lowest monthly trading range since before the GFC i.e. well over 10-years. Hence while the market may have made fresh new decade highs this month the momentum has been far from convincing as stock / sector rotation remains the main game in town.
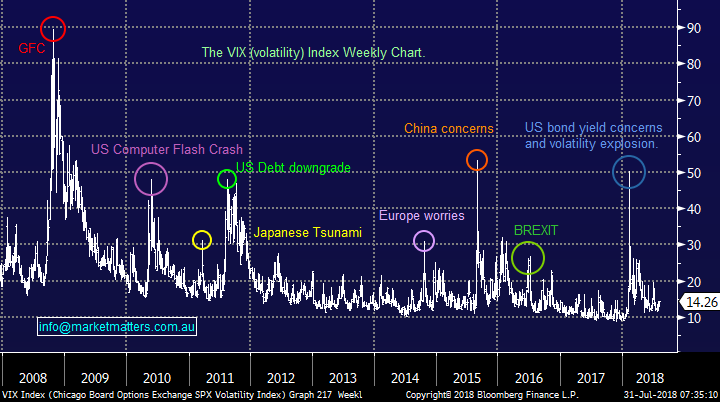
This lack of movement is currently reflected in the US VIX (Fear Index) which illustrates the comfort investors currently exude simply believing that stocks will be supported into any market weakness. However, we remain confident that the panic spike in volatility that equities experienced in January / February will be repeated in the not too distant future – how quickly markets forget, it was only a few months ago!
The US VIX (volatility / Fear Index) Chart
Locally the low volumes continue in both stocks and derivatives and we note that yet again the “seasonality statistics” are not working in 2018 – the average performance by the Australian market in July over the last 10-years is +3.3%, the strongest month of the year, but yesterday we closed up just +1.3% for the month with no signs of any improvement today.
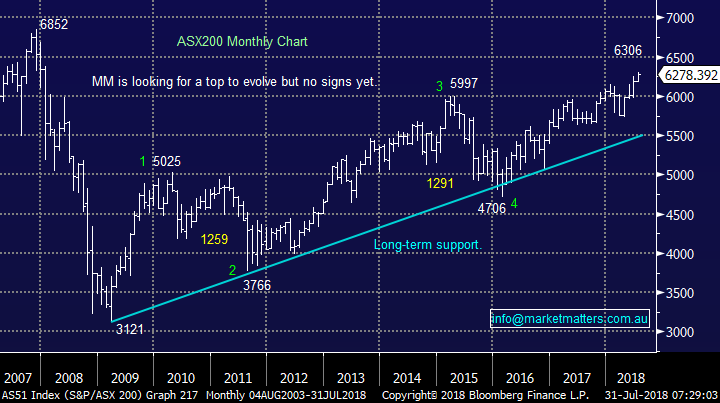
- We remain mildly short-term bullish the ASX200 while the index holds above 6250, neutral between 6250 & 6140 and bearish on a break of 6140.
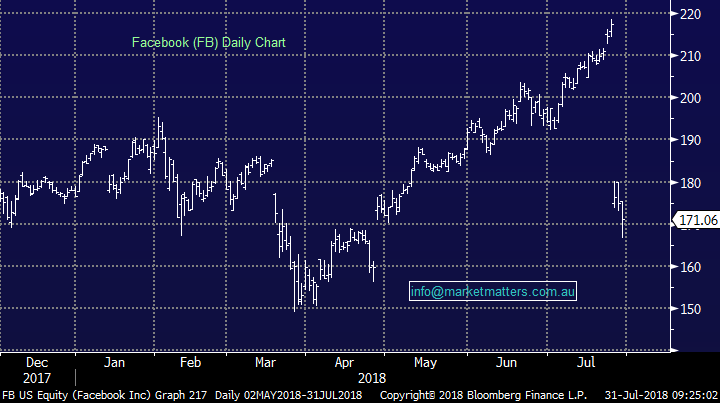
Overnight stocks were again weak as the tech based NASDAQ continued to weigh on both the market and sentiment – the tech based index is now over 4% below last week’s all-time high following Facebook & Twitter ruining the party. Overnight, we saw continued selling in Facebook & Twitter with the daily chart below of FB clearly showing how ‘left field’ their earnings and guidance miss was for the market. We continue to target a move below $US150 for FB.
Facebook (FB) Chart
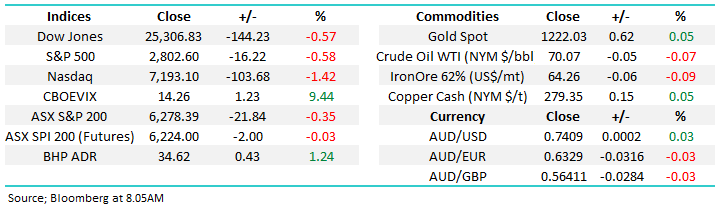
This morning, the ASX200 is set to only open unchanged with BHP closing up +1.3% likely to support early on.
Today’s report is going to focus on the important healthcare sector which feels like its big names are experiencing profit taking into any strength, especially as the $A looks to be finding a base around the 74c area.
ASX200 Chart
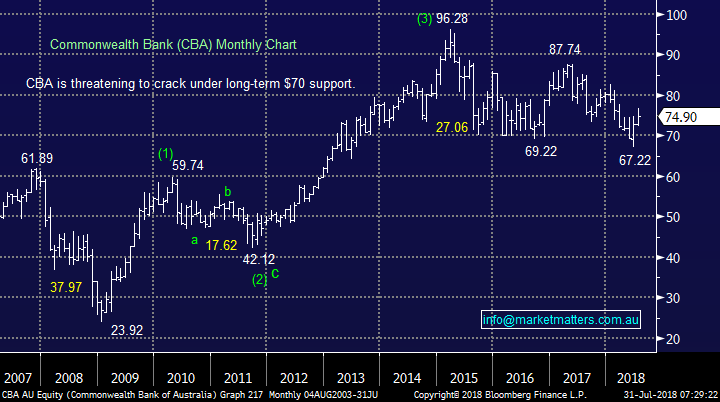
The local healthcare sector has been a simply fantastic place to be invested over recent years but we are concerned that investors have been chasing the sector without thought to value and risk, just like we saw with the banking sector in mid-2015 prior to its deep correction e.g. CBA fell 28% before dividends.
- We prefer GARP (growth at realistic price) as opposed to GAAP (growth at any price).
Also, we should always remain aware that long-term trends do eventually end just as we witnessed in early 2016 when the 5-year bear market in resources reversed and now they are regarded by many as the must own sector – we like them but just a bit lower. Since the GFC the ASX200 has doubled but the Healthcare Sector has rallied 4-fold, we simply question if this outperformance can continue.
Today we are going to expand on point 5 of the weekend report and take a close look at 5 major players in the sector as we enter reporting season.
Commonwealth Bank (CBA) Chart
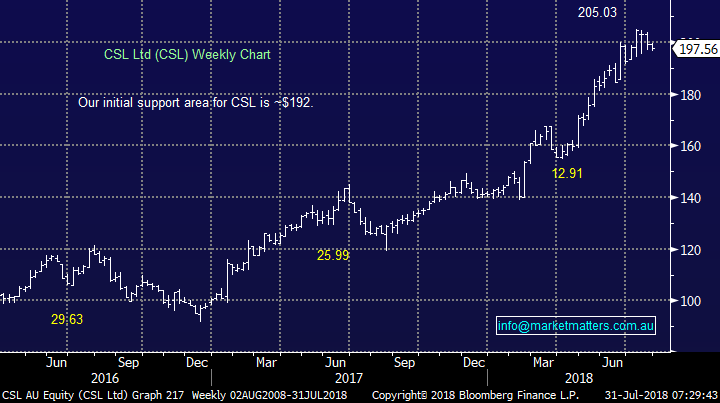
1 CSL Ltd (CSL) $197.56
CSL has now become the 4th largest company on the ASX200, with only CBA, BHP and Westpac larger – a consequence of excellent delivery on nearly all parts of their business coupled with a market that is prepared to pay huge multiples for quality growth.
However, at this stage we remain concerned by its valuation with the shares closing yesterday on a P/E of 38.5x est. earnings for 2018 – huge room for disappointment for a stock priced for perfection.
There are generally two factors that can derail growth stocks. 1. A slip up in growth rates and 2. Higher interest rates. Assuming CSL meets market expectations when they report shortly, they will have grown profit by 28% in FY18, a great result while the market is tipping profit to increase by 13% in FY19 .i.e growth is slowing while higher interest rates are clearly in play.
Technically we have support between $186 and $192 with $180 the ideal buying level i.e. between 7 and 12% below this month’s all-time high.
- MM feels CSL is overpriced around $200 but will certainly consider this excellent business into a decent correction.
CSL Ltd (CSL) Chart
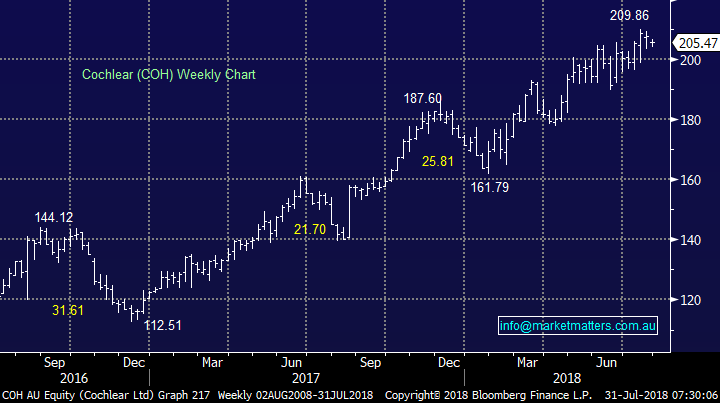
2 Cochlear (COH) $205.47
COH is a similar story to CSL, a great business but we believe simply overpriced as unchecked optimism has taken over in both stocks.
COH only sold about 30% more units in 2017 than in 2011 but the share price has rallied almost 400% which leaves plenty of room for disappointment. Also, investors should not forget that COH does often present opportunities having corrected between 13% & 20% three times since September 2016 i.e. be patient is our call.
- MM likes COH but would rather scale into weakness starting ~10% lower.
Cochlear (COH) Chart
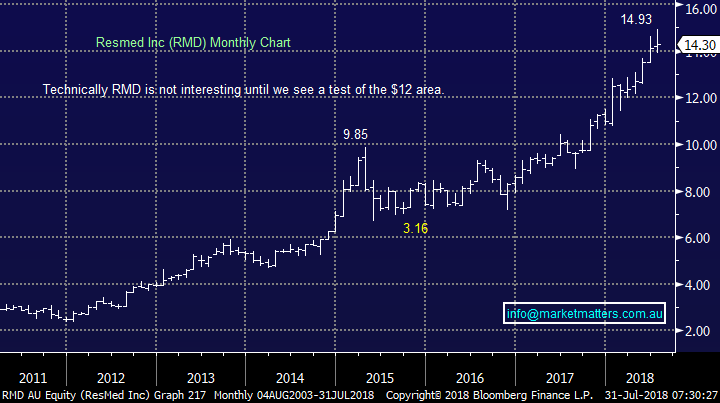
3 ResMed (RMD) $14.30
RMD like both CSL and COH has powered to all-time highs this month as the combination of unbridled optimism and tailwinds from a weak $A sends investors to the one sector they remain totally comfortable = danger!
RMD is also trading on a “rich” P/E of 30.2x est. earnings for 2018 but we do like the direction of the sleep and respiratory healthcare business as it works to grow reoccurring revenue streams with sales across Asia, Europe and the US.
- MM is keen on RMD but at this stage we are interested ~$12, around 15% lower.
ResMed (RMD) Chart
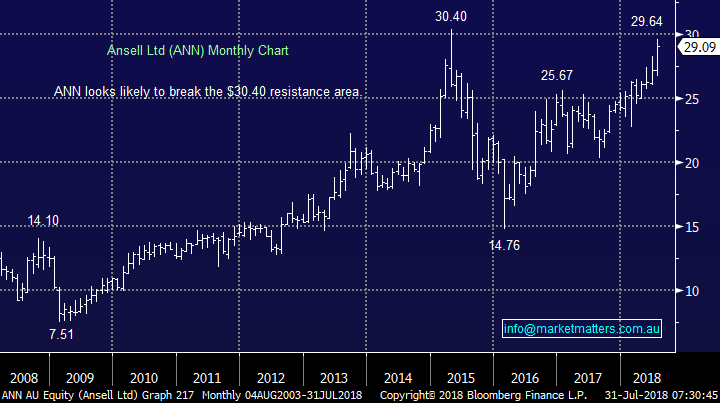
4 Ansell (ANN) $29.09
ANN is not as richly valued as some of its peers trading on a P/E of 21.2x but technically we actually believe the picture is better. There has been little news out from the health and safety business and investors will be watching closely their FY18 results on April 20th – the market is expecting a flat result at the net profit line relative to FY17.
We wonder if there has been a little switching from the high flyers CSL / COH within the sector especially following ANN’s upgrade by UBS last week.
- Technically ANN looks destined to make fresh post-GFC highs above $30.40 but from a risk / reward basis we have to be neutral at present.
Ansell (ANN) Chart
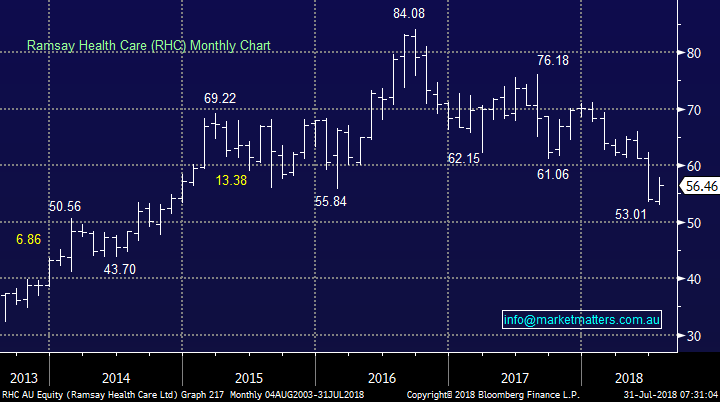
5 Ramsay Healthcare (RHC) $56.46
Last but not least RHC, which we own following its plunge to multi-year lows last month.
RHC is testament that being invested in the correct sector is no guarantee of success with the private hospital operator’s shares falling over 35% in the last 2-years – fortunately we were bearish during the decline.
The fall in RHC is a classic example of what can go wrong when optimism stretches the elastic band too far and everybody’s long – the vast majority of pundits were long and bullish RHC during its decline with many now turning bearish, roughly when we went long. We like their attempted tilt into France and feel they can pay more, obviously we don’t want them to overpay however an investment in technology that can be rolled out across the wider RHC network makes sense – sometimes it’s better to buy than build!
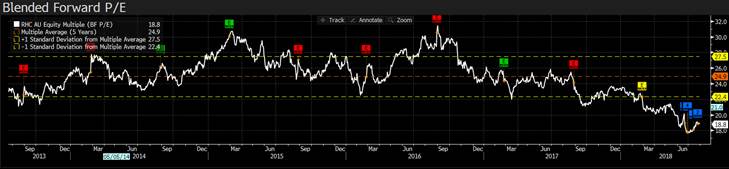
RHC is now trading on an est. P/E of 18.8x, the lowest of the 5 stocks covered today while it’s just slightly above its 5 year low (P/E) of 17.7x illustrating the pessimism that’s crept into the stock.
- We like our RHC investment at this stage but need a clear break back above $60 to feel that we may have nailed it.
Ramsay Healthcare (RHC) Chart
Conclusion
We like the healthcare sector into a decent correction but believe heavyweights CSL, COH and to a lesser degree RMD are overpriced at current levels.
Overseas Indices
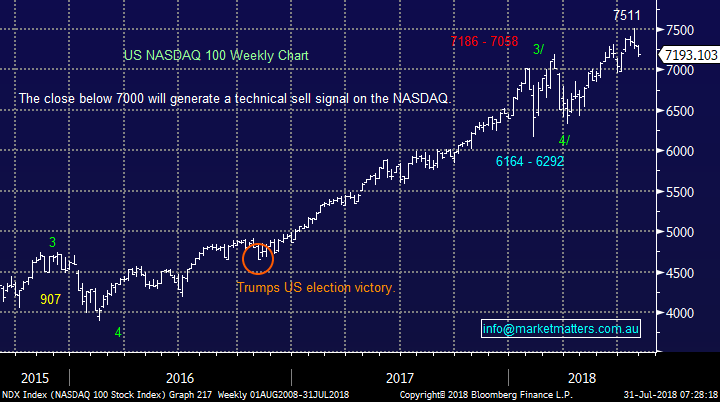
The tech-based NASDAQ is threatening a major correction after falling over 4% in the in the last 4-days. We are watching closely as we may add to our BBUS position.
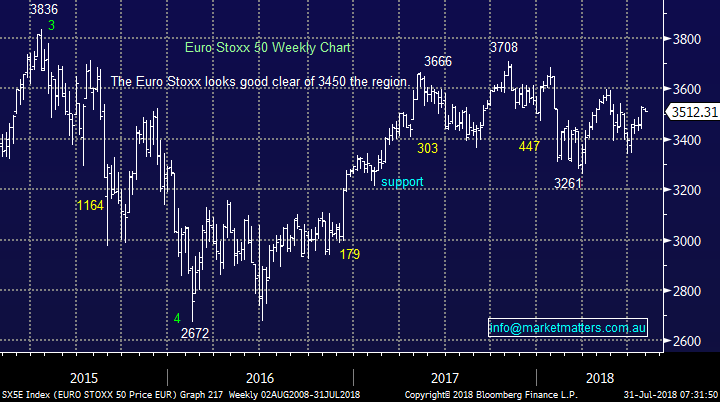
Conversely. the European market remains firm and in a bullish position technically – who said it was supposed to be easy!
US NASDAQ Chart
EuroStoxx 50 Chart
Overnight Market Matters Wrap
- A continuing selloff in technology shares once again weighed on the US markets overnight, with the tech heavy Nasdaq index falling another 1.4%, having now lost nearly 4% or 300 points from its record high levels reached mid-last week of 7933.
- The so called FANG group of stocks were all under pressure with Facebook continuing its slide post last week’s 20% drop along, with Amazon, Netflix and even Google parent Alphabet slipping back from Friday’s record level. Twitter dropped another 8% on the back of Friday’s 20% hit on lower subscribers and earnings outlook, and there was across the board weakness in the sector.
- The broad tech selloff affected the general market sentiment with the S&P 500 and the Dow falling around 0.6% each. Given concerns about the still lofty valuations of the tech sector, investors are nervously anticipating Apple’s quarterly numbers tonight.
- Locally the futures are at this stage pointing to only a small decline. Commodities were generally firmer overnight, with oil about 1% higher, with Brent at US$75/bbl, as was the aluminium price, while iron ore also improved slightly to $67.65/t. BHP firmed 1%
Have a great day!
James & the Market Matters Team
Disclosure
Market Matters may hold stocks mentioned in this report. Subscribers can view a full list of holdings on the website by clicking here. Positions are updated each Friday, or after the session when positions are traded.
Disclaimer
All figures contained from sources believed to be accurate. Market Matters does not make any representation of warranty as to the accuracy of the figures and disclaims any liability resulting from any inaccuracy. Prices as at 31/07/2018
Reports and other documents published on this website and email (‘Reports’) are authored by Market Matters and the reports represent the views of Market Matters. The MarketMatters Report is based on technical analysis of companies, commodities and the market in general. Technical analysis focuses on interpreting charts and other data to determine what the market sentiment about a particular financial product is, or will be. Unlike fundamental analysis, it does not involve a detailed review of the company’s financial position.
The Reports contain general, as opposed to personal, advice. That means they are prepared for multiple distributions without consideration of your investment objectives, financial situation and needs (‘Personal Circumstances’). Accordingly, any advice given is not a recommendation that a particular course of action is suitable for you and the advice is therefore not to be acted on as investment advice. You must assess whether or not any advice is appropriate for your Personal Circumstances before making any investment decisions. You can either make this assessment yourself, or if you require a personal recommendation, you can seek the assistance of a financial advisor. Market Matters or its author(s) accepts no responsibility for any losses or damages resulting from decisions made from or because of information within this publication. Investing and trading in financial products are always risky, so you should do your own research before buying or selling a financial product.
The Reports are published by Market Matters in good faith based on the facts known to it at the time of their preparation and do not purport to contain all relevant information with respect to the financial products to which they relate. Although the Reports are based on information obtained from sources believed to be reliable, Market Matters does not make any representation or warranty that they are accurate, complete or up to date and Market Matters accepts no obligation to correct or update the information or opinions in the Reports. Market Matters may publish content sourced from external content providers.
If you rely on a Report, you do so at your own risk. Past performance is not an indication of future performance. Any projections are estimates only and may not be realised in the future. Except to the extent that liability under any law cannot be excluded, Market Matters disclaims liability for all loss or damage arising as a result of any opinion, advice, recommendation, representation or information expressly or impliedly published in or in relation to this report notwithstanding any error or omission including negligence.
To unsubscribe. Click Here


