Agricultural stocks – Part 2 (TGR, HUO, SHV, RIC, CGC, MFG, SEK)
August is only 7-days old but the lack of volatility on an index level remains the ongoing theme from July with the markets range only 38-points to-date. We continue to witness stock / sector rotation on an almost daily basis but no apparent desire by fund managers to increase / reduce overall equities exposure.
The reporting season trundles on with the big one, Commonwealth Bank (CBA), this Wednesday. Australia’s largest company also goes ex-dividend next week and its forecast to be a whopping $2.37 fully franked hence the large discount of the September futures to the ASX200 for the curious.
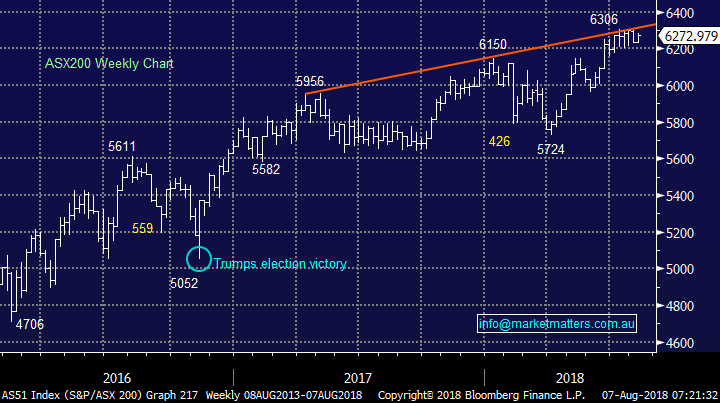
- We are neutral the ASX200 while the index holds above 6140 but we remain in “sell mode” albeit in a patient manner.
Overnight stocks were firm led by the US where the S&P500 closed only 0.8% below its all-time high. Local futures are pointing to a small positive start to the day although BHP falling over 1% implies that resources will give back some of yesterday’s gains i.e. more sector rotation.
Today’s report is going to follow on from last Thursdays and look at 5 more local agricultural stocks.
Also, we will look at a good & bad performer from yesterday in case opportunities present themselves as reporting season moves into gear.
ASX200 Chart
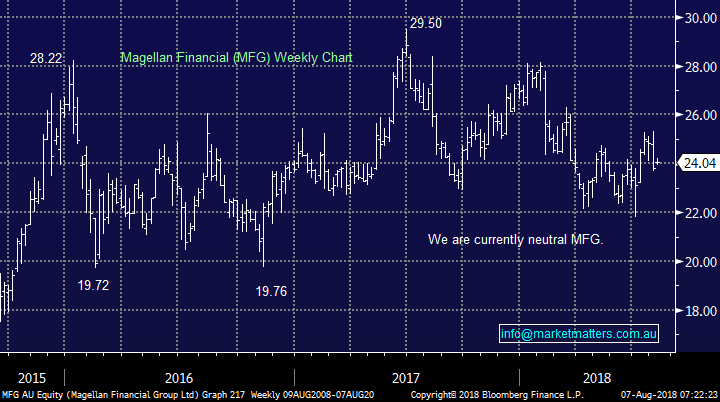
Winner: Magellan (MFG) $24.04 +1.1%
MFG rallied 1.1% yesterday after it announced net inflows of close to $100m, a notable difference to the outflows produced by Janus Henderson (JHG) last week.
The main reason we included MFG today, even after a relatively small gain, was its strong quality score compared to many of the successful high valuation growth stocks of the last few years i.e. a stock that’s more appealing to us for the next 2-3 years.
· Technically we are neutral / positive MFG.
Magellan Financial (MFG) Chart
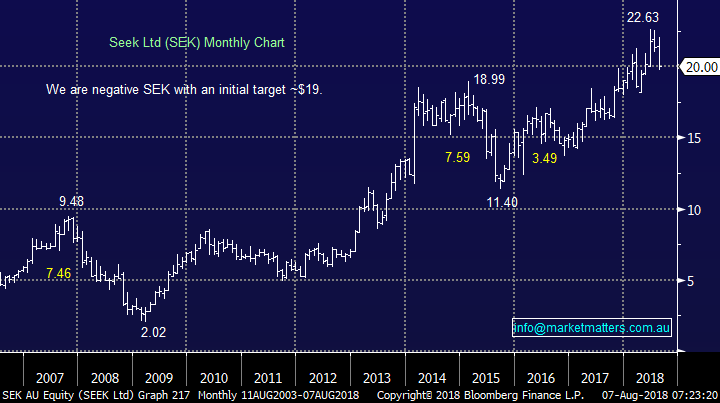
Loser: Seek (SEK) $20 / -8.8%
Seek was smacked from the opening bell yesterday following its disappointing outlook for FY19, plus a few write-downs didn’t help. This quote from our yesterday afternoon report sums it up perfectly:
“SEK has an incredible business in Australia, a market it dominates however growing overseas in larger markets will continue to cost money”.
This is another example of the dangers in the growth stocks at this stage of the cycle, SEK still closed on a rich P/E of 33.7x Est. 2018 earnings after its significant fall.
· Technically we are bearish SEK initially targeting the $19 area.
Seek (SEK) Chart
Now it’s time to look at a diverse group of 5 Australian agricultural stocks which as a sector we like as the global economy rapidly grows its middle class, - following on from last weeks report here - although obviously some parts are currently enduring extremely tough times.
We like the food space as a defensive sector for the next few years as clearly we all have to eat and the respective stocks aren’t currently commanding the high valuation of say the healthcare sector, the classic defensive space.
1 Tassal Group (TGR) $4.62
Tassal is Australia’s largest fish farming business with a large salmon operation in Tasmania plus an extensive seafood wholesale operation. TGR has generated steady growth of underlying profit over the past five years which is illustrated by its share price appreciation. The company is obviously benefitting from an increasing Australian population which continue to consume a healthier diet which includes eating more fish.
Tassal is currently trading on an Est. P/E for 2018 of 15.1x which feels about fair to us, while its 3.5% fully franked yield is not to be sneezed at.
· MM likes TGR but our ideal entry level is at least 10% lower, or sub $4.
Tassal Group (TGR) Chart

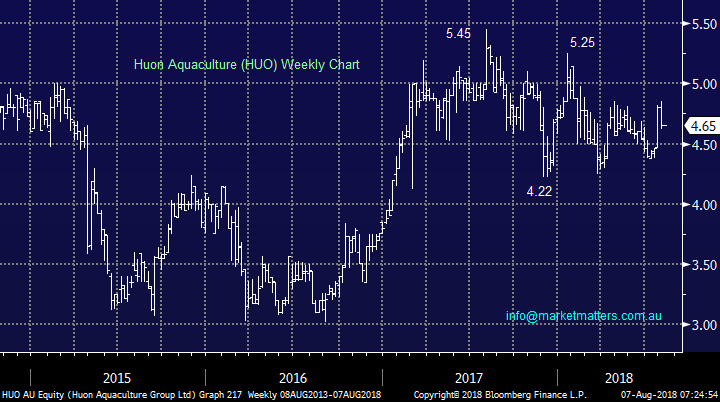
2 Huon Aquaculture (HUO) $4.65
HUO is the second largest salmon producer in Australia with a market cap of $406m, its yielding 2.15% fully franked and only trading on an Est. P/E for 2018 of 10.6x. As we said previously we like the domestic demand outlook as we all try and become more health conscious.
Importantly HUO is trading on a ~50% discount to its listed ASX peers and 35% discount to European listed salmon producers, also HUO is trading at a 20% discount to its average forward multiple since listing – perhaps investors are not yet confident in the relatively new face on the block. Some the guys on the desk actually toured the operation about 2 weeks ago and came back impressed (unfortunately I couldn’t get away). One of the most interesting comments was around the companies use of advanced technology.
· We like HUO but similar to TGR our optimum entry is ~$4, or 10% lower.
Huon Aquaculture (HUO) Chart
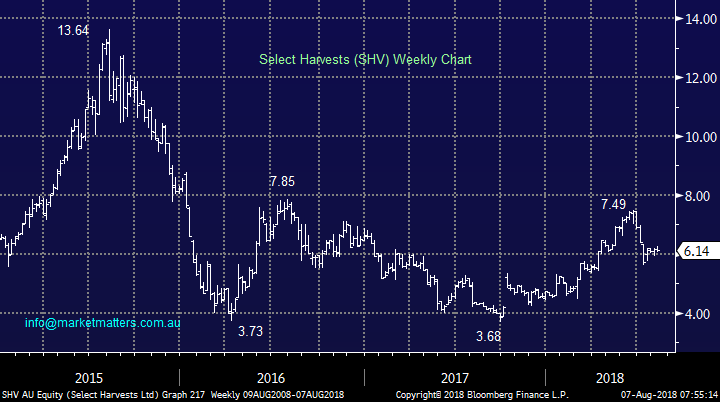
3 Select Harvests (SHV) $6.14
Almond producer SHV has had a tough few years and finds itself in a large trading range between around $4 and $8. However the company has recently entered into an attractive 5-year deal with Pepsi China to launch its Lucky Nuts brand into the huge Chinese market. Importantly though, the share price of SHV will remain largely dependent on the underlying price for almonds and hence the weather patterns in California, therefore increasing the risk of any investment.
Our major concern with this Victorian based almond business is the stock price, its trading on a Est. P/E for 2018 of 26.3x which we believe is simply too rich.
· MM is neutral SHV.
Select Harvests (SHV) Chart
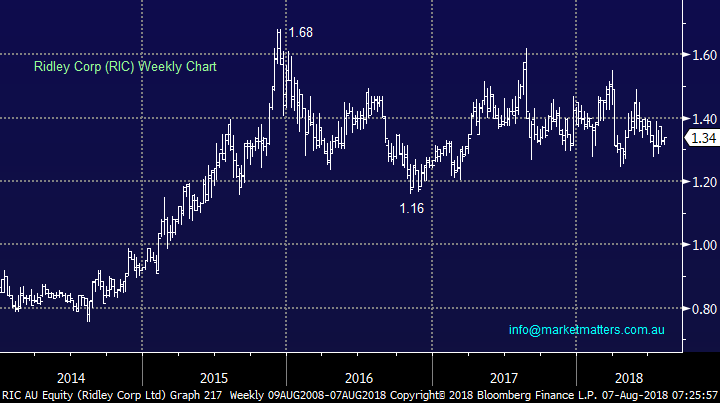
4 Ridley Corp (RIC) $1.34
RIC is not a widely followed stock but this operator of stockfeed mills for a broad group of animal industries is worth a look. The stock is trading on a Est. P/E for 2018 of 18.1x while yielding 3.2% fully franked.
One added bonus of RIC is it’s a potential takeover target with GrainCorp (GNC) the suitor, a deal that makes sense.
· MM likes RIC but it would not be a major play given upside feels limited unless GNC step up.
Ridley Corp (RIC) Chart
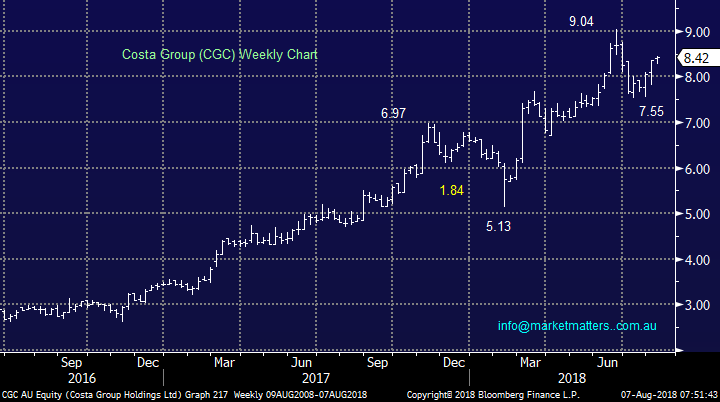
5 Costa Group (CGC) $8.42
Horticultural company Costa Group is one of Australia’s leading food-producing and distribution businesses supplying supermarket chains and independent grocers worldwide. They now have 5 main categories of food produce, being berries, mushrooms, citrus fruit, tomatoes and avocadoes. Their reliable delivery network has enabled them to command solid prices especially from the aggressive margin conscious supermarkets.
Similar to most of the sector, demand for its products is increasing due to global and Australian population growth. Costa is currently forecasting underlying profit growth of 25% this year but its currently trading on an Est. P/E for 2018 of 33x while it yields 1.4% fully franked, clearly a growth story.
· We like CGC but at this stage of the cycle believe it’s time to be fussy on price, our ideal entry level is currently ~$7.25, over 10% lower.
Costa Group (CGC) Chart
Conclusion
Of the 5 companies mentioned we like salmon farmers TGR and HUO plus CGC but ideally all a touch lower.
We think RIC is an interesting “small play“ opportunity plus it has some spice as a takeover target for GNC.
We are not keen on SHV.
Overseas Indices
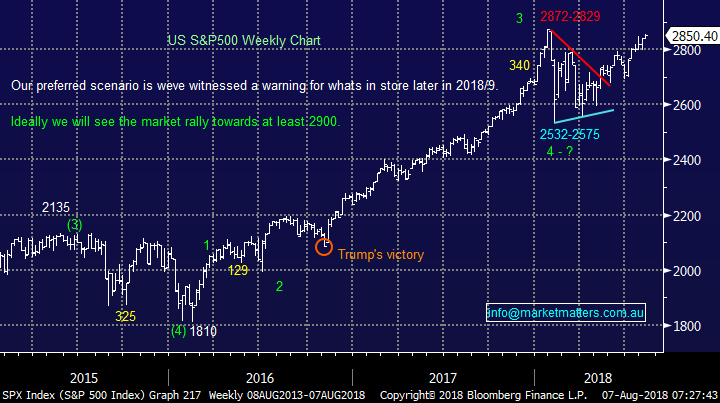
The US S&P500 is following our script and now looks destined to make fresh all-time highs in the coming weeks, ideally around 2900 (less than 2% higher) where we will look to increase our BBUS short ETF position.
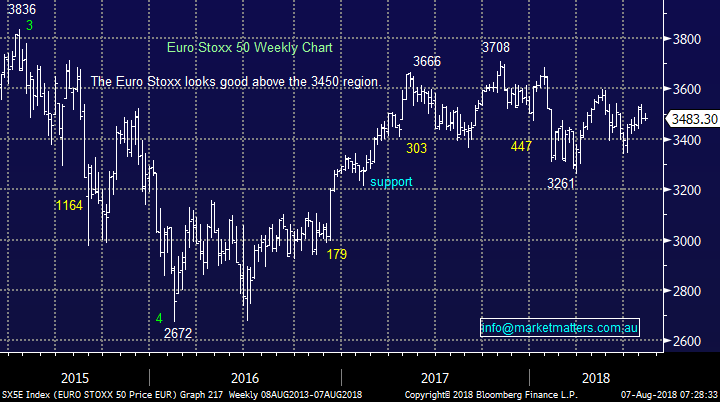
Conversely European stocks feel like they’re in hibernation.
US S&P500 Chart
Eurostoxx Chart
Overnight Market Matters Wrap
· The SPI is up 3 points as US markets all closed in the black. The DJIA closed 0.15% higher, the S&P 500 rose 0.35% and the NASDAQ was the best performer, +0.6%.
· US equities seemed to have ignored concerns around a US/China tariff war and tension with Iran over their nuclear program. Instead, markets are grinding higher, with the S&P 500 not too far away from an all-time high.
· Strong results from US companies continued overnight with Berkshire Hathaway rallying >3%. Facebook also rose more than 3% as they plan to offer new services to their users.
· Copper fell, while aluminium and nickel rose on the LME. Oil rose and iron ore rallied 2.5% to close around $US69/tonne.
Have a great day!
James & the Market Matters Team
Disclosure
Market Matters may hold stocks mentioned in this report. Subscribers can view a full list of holdings on the website by clicking here. Positions are updated each Friday, or after the session when positions are traded.
Disclaimer
All figures contained from sources believed to be accurate. Market Matters does not make any representation of warranty as to the accuracy of the figures and disclaims any liability resulting from any inaccuracy. Prices as at 07/08/2018
Reports and other documents published on this website and email (‘Reports’) are authored by Market Matters and the reports represent the views of Market Matters. The MarketMatters Report is based on technical analysis of companies, commodities and the market in general. Technical analysis focuses on interpreting charts and other data to determine what the market sentiment about a particular financial product is, or will be. Unlike fundamental analysis, it does not involve a detailed review of the company’s financial position.
The Reports contain general, as opposed to personal, advice. That means they are prepared for multiple distributions without consideration of your investment objectives, financial situation and needs (‘Personal Circumstances’). Accordingly, any advice given is not a recommendation that a particular course of action is suitable for you and the advice is therefore not to be acted on as investment advice. You must assess whether or not any advice is appropriate for your Personal Circumstances before making any investment decisions. You can either make this assessment yourself, or if you require a personal recommendation, you can seek the assistance of a financial advisor. Market Matters or its author(s) accepts no responsibility for any losses or damages resulting from decisions made from or because of information within this publication. Investing and trading in financial products are always risky, so you should do your own research before buying or selling a financial product.
The Reports are published by Market Matters in good faith based on the facts known to it at the time of their preparation and do not purport to contain all relevant information with respect to the financial products to which they relate. Although the Reports are based on information obtained from sources believed to be reliable, Market Matters does not make any representation or warranty that they are accurate, complete or up to date and Market Matters accepts no obligation to correct or update the information or opinions in the Reports. Market Matters may publish content sourced from external content providers.
If you rely on a Report, you do so at your own risk. Past performance is not an indication of future performance. Any projections are estimates only and may not be realised in the future. Except to the extent that liability under any law cannot be excluded, Market Matters disclaims liability for all loss or damage arising as a result of any opinion, advice, recommendation, representation or information expressly or impliedly published in or in relation to this report notwithstanding any error or omission including negligence.
To unsubscribe. Click Here