Has CBA set a positive tone for the Australian banks? (CBA, BOQ, ANZ, CYB, SUN)
Yesterday the ASX200 rallied 14-points which was a very lacklustre performance considering CBA contributed +11-points. We are now into the 5th week of treading water between 6200 and 6300 with many posing the question “what will change this newfound comfortable equilibrium”?
On a number of occasions over recent decades the ASX200 has actually led global indices and at MM our “gut feel” is the failure of local stocks to embrace the US markets strength adds weight to our view that the next 10% move at least, is down.
Investors often become very impatient expecting stocks / markets to deliver almost as fast as Domino’s but in reality, it’s very rarely the case, our analysis shows that market “tops” whether minor or major usually take ~2-months to evolve before finally correcting.
- We are neutral the ASX200 while the index holds above 6140 but we remain in “sell mode” albeit in a patient manner.
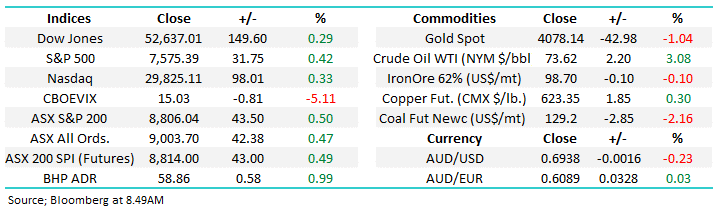
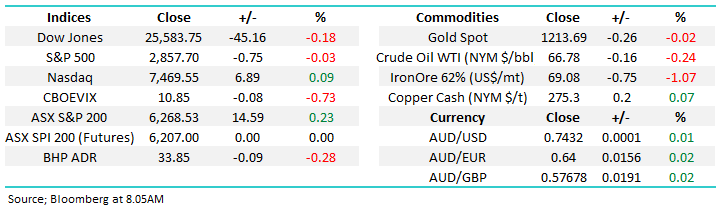
Overseas markets were quiet with a late sell-off erasing earlier small daily gains, the futures are pointing to an unchanged opening by the ASX200.
Today’s report is going to look at the widely held banking sector following CBA’s ‘better than feared’ result yesterday from yesterday.
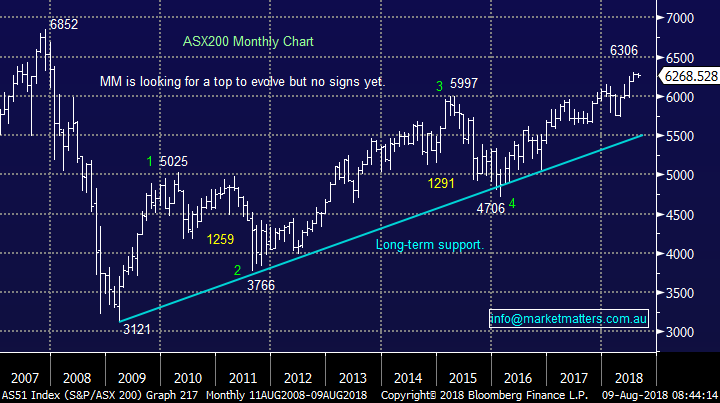
ASX200 Chart
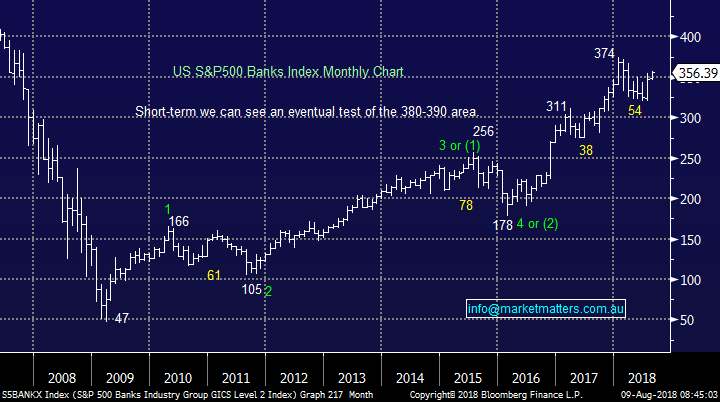
The US banking sector has revelled in Donald Trump’s combination of tax cuts and relaxed regulatory conditions with sector up 100% since the 2016 lows, whereas the Australian banking sector remains over 20% below its 2015 high.
However, with the costly Hayne Royal Commission slowly coming to its conclusion and housing prices already slipping we question where the fresh bad news will come from for the embattled sector..
S&P500 banking Sector Chart
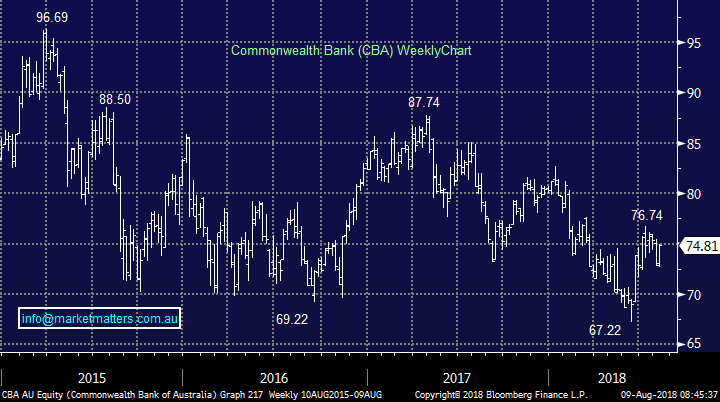
1 Commonwealth Bank (CBA) $74.81
Yesterday’s result was better than feared from CBA with the underlying trends in the business showing many positive trends - one aspect that caught my eye was around the underlying “Jaws” which was a positive 0.3%.
Jaws ratio = Income Growth Rate - Expense Growth Rate
The fact CBA grew underlying income at a greater rate than expenses through what can only be described as a horrific period for the bank is remarkable, and speaks to the underlying quality of the franchise. In our opinion the markets become way too bearish the banking sector, at least until we see any serious contributors on the disruption front. A number of prominent funds have enjoyed proclaiming their lack of / small exposure to Australian banks, it feels like the sellers / “shorters” are set so the downside feels limited to us.
CBA is currently trading on a conservative P/E for 2019 of 14.5x while yielding an attractive 5.75% fully franked.
· MM is bullish CBA while it can hold above the $72 area.
Commonwealth Bank (CBA) Chart
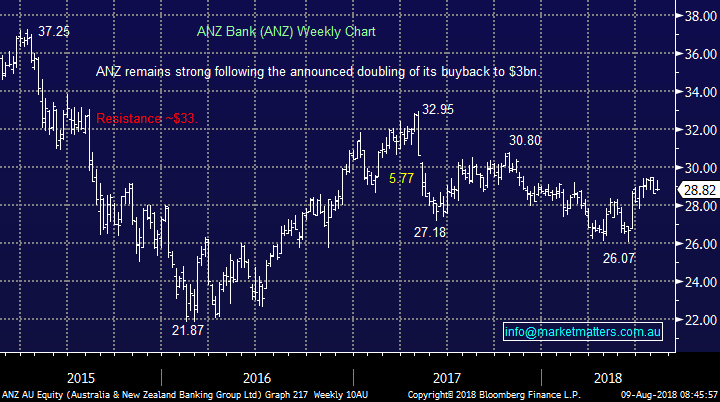
2 ANZ Bank (ANZ) $28.82
Over recent times ANZ has outperformed the other “big four banks” falling -3.6% over the last year. Their announced $3bn buyback is certainly supporting the stock and helping the overall perception towards the bank.
ANZ is currently trading on a conservative P/E for 2018 of 12.6x while yielding an attractive 5.55% fully franked.
· Technically we like ANZ with an ideal entry around $28.
ANZ Bank (ANZ) Chart
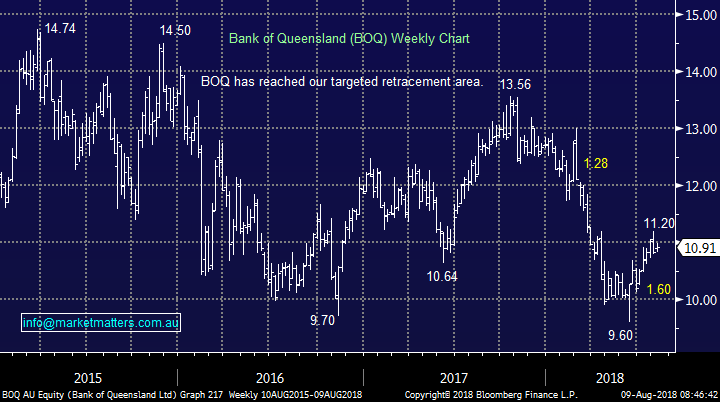
3 Bank of Queensland (BOQ) $10.91
Regional bank BOQ is the worst performing of the Australian banks falling -11.8% over the last year. Like other banks we believe too much bad news is built into BOQ but the risk / reward feels better at the larger end of town
BOQ is currently trading on a conservative P/E for 2018 of 11.9x while yielding an attractive 7.7% fully franked.
· MM prefers other banks in the sector, currently only liking BOQ back under $9.50.
Bank of Queensland (BOQ) Chart
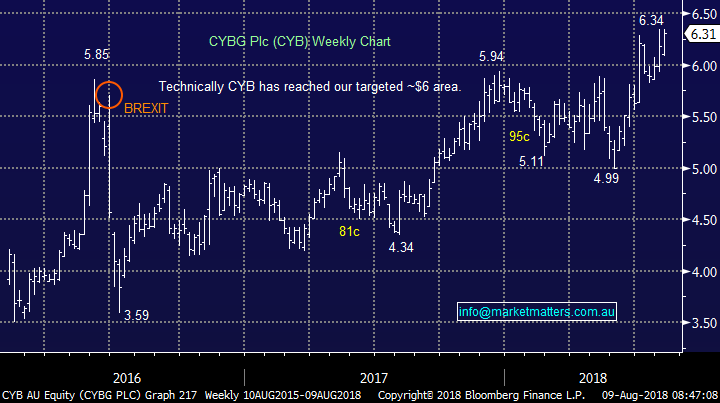
4 CYBG Ltd (CYB) $6.31
UK based CYB has been the standout bank on the ASX200 over the last year rallying +31.7% in an index that has fallen -0.9%. At MM we’ve enjoyed much of these gains but recently took profit as the stock hit our target trading above $6.
We acknowledge that we may be forced to rebuy CYB at a higher price in the future but from a risk / reward perspective MM likes being an observer for now.
CYB is currently trading on a higher P/E for 2018 of 15.8 while paying a tiny ‘token’ dividend.
· MM is currently neutral CYB.
CYBG Ltd (CYB) Chart
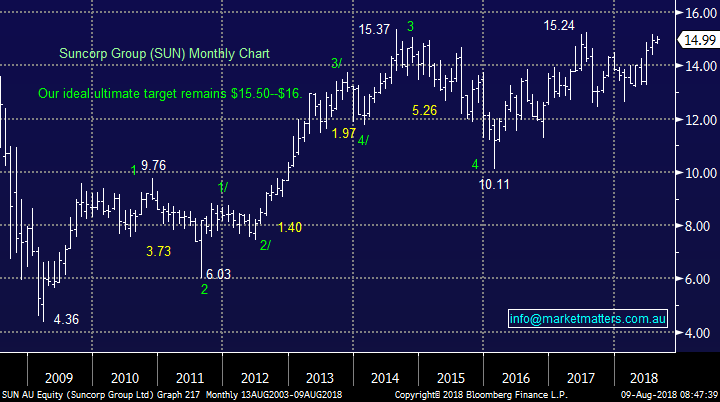
5 Suncorp Group (SUN) $14.99
Obviously, SUN is both a banking and insurance business but as it’s our largest holding and reported this morning it was an opportune to include it in today’s section.
RESULT; On first read through this looks like a great result with the company exceeding expectations across most metrics while we’ve also seen an 8cps special dividend. They announced the sale of their life insurance business and have guided to 10% ROE in 2019 which is good. They also intend to return ~$600m capital to shareholders, which is about 46cps from the sale. All in all, a great result and the stocks should trade higher this morning on the back of it
SUN is currently trading on a higher P/E for 2018 of 18.7x while yielding an attractive 4.9% fully franked.
· We continue to look to take profit on SUN between $15.20 and $16 – expect an alert this morning to trim 2% of our holding above $15.30
Suncorp (SUN) Chart
Conclusion (s)
We believe the Australian banks represent solid value at current levels and will enable the ASX200 to outperform its peers if/when we see a global correction in stocks.
Overseas Indices
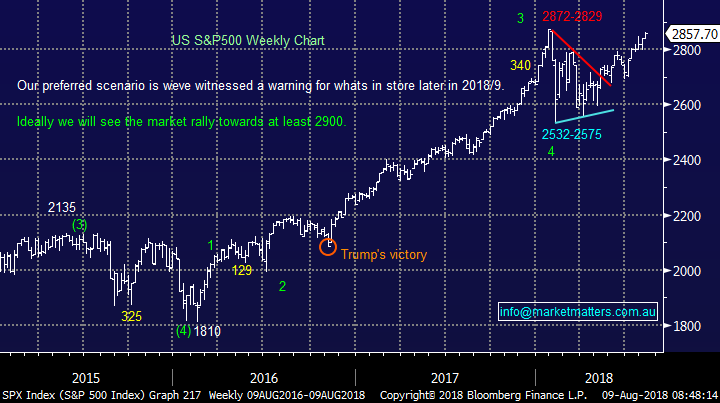
The S&P500 still looks destined to make fresh all-time highs in the next few weeks, this has been our preferred scenario for months with the big question “will it fail around 2900?”.
· MM intends to increase our BBUS short US ETF position into further strength.
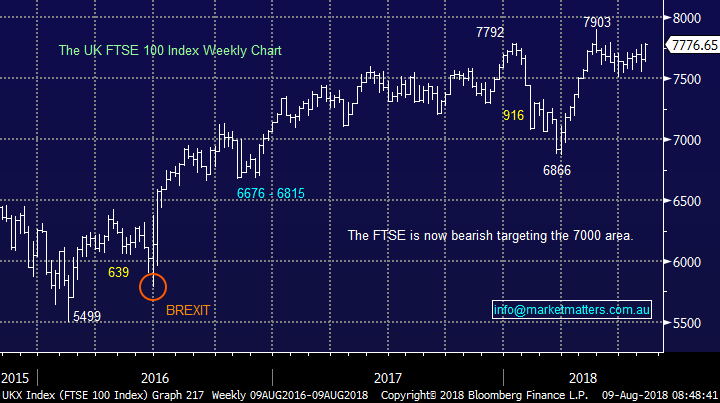
European indices continue to trade sideways in a relatively similar manner to the ASX200.
US S&P500 Chart
UK FTSE Chart
Overnight Market Matters Wrap
· The SPI is flat after a largely directionless night in US equities. The DJIA fell 0.2% and the S&P 500 closed just 0.03% in the red. The NASDAQ eked out a small gain, +0.06%.
· China announced a 25% tariff on an additional $US16B worth of US imports from August 23, in retaliation to US tariffs announced yesterday. US investors don’t seem too worried by these tit-for-tat tariffs as the S&P 500 sits just below its all-time high. Chinese markets have fared far worse. The Shanghai Composite for example has fallen ~17% since March.
· Aluminium and nickel were the standouts on the LME with good gains, iron ore was better, while oil fell more than 3% after a smaller than anticipated inventory draw.
Have a great day!
James & the Market Matters Team
Disclosure
Market Matters may hold stocks mentioned in this report. Subscribers can view a full list of holdings on the website by clicking here. Positions are updated each Friday, or after the session when positions are traded.
Disclaimer
All figures contained from sources believed to be accurate. Market Matters does not make any representation of warranty as to the accuracy of the figures and disclaims any liability resulting from any inaccuracy. Prices as at 09/08/2018
Reports and other documents published on this website and email (‘Reports’) are authored by Market Matters and the reports represent the views of Market Matters. The MarketMatters Report is based on technical analysis of companies, commodities and the market in general. Technical analysis focuses on interpreting charts and other data to determine what the market sentiment about a particular financial product is, or will be. Unlike fundamental analysis, it does not involve a detailed review of the company’s financial position.
The Reports contain general, as opposed to personal, advice. That means they are prepared for multiple distributions without consideration of your investment objectives, financial situation and needs (‘Personal Circumstances’). Accordingly, any advice given is not a recommendation that a particular course of action is suitable for you and the advice is therefore not to be acted on as investment advice. You must assess whether or not any advice is appropriate for your Personal Circumstances before making any investment decisions. You can either make this assessment yourself, or if you require a personal recommendation, you can seek the assistance of a financial advisor. Market Matters or its author(s) accepts no responsibility for any losses or damages resulting from decisions made from or because of information within this publication. Investing and trading in financial products are always risky, so you should do your own research before buying or selling a financial product.
The Reports are published by Market Matters in good faith based on the facts known to it at the time of their preparation and do not purport to contain all relevant information with respect to the financial products to which they relate. Although the Reports are based on information obtained from sources believed to be reliable, Market Matters does not make any representation or warranty that they are accurate, complete or up to date and Market Matters accepts no obligation to correct or update the information or opinions in the Reports. Market Matters may publish content sourced from external content providers.
If you rely on a Report, you do so at your own risk. Past performance is not an indication of future performance. Any projections are estimates only and may not be realised in the future. Except to the extent that liability under any law cannot be excluded, Market Matters disclaims liability for all loss or damage arising as a result of any opinion, advice, recommendation, representation or information expressly or impliedly published in or in relation to this report notwithstanding any error or omission including negligence.
To unsubscribe. Click Here