Should we give the Resources a Wide Berth? (BHP, RIO, OZL, WSA, AWC, FMG)
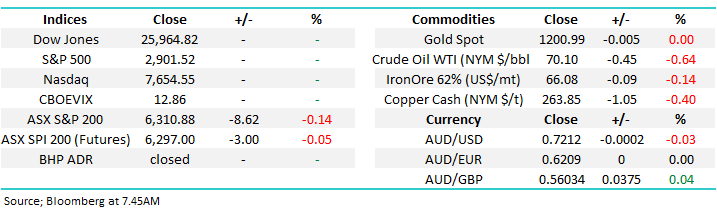
The ASX200 slipped -8.6 points yesterday, but the degree of the market frailty was exposed by the SPI futures which tumbled 50-points / 0.8% to reverse the early optimistic opening. The standout weakness was felt in the resources sector with BHP for example opening up +23c only to reverse and close down -20c, a disappointing 1.3% about turn for one of the strongest stocks on our bourse.
We saw some poor economic news yesterday with much weaker than expected local retail sales numbers, plus the lowest manufacturing growth from China in 14-months (Caixin PMI). This initially sent the $A to a fresh 20-months low under US71.70c, although it’s managed to bounce back above 72c primarily on some $US weakness. The shaky data appeared to be acknowledged very much on the sector level with our retailing sector slipping over -2.2% to rub shoulders with some of our miners in the “loser’s corner”.
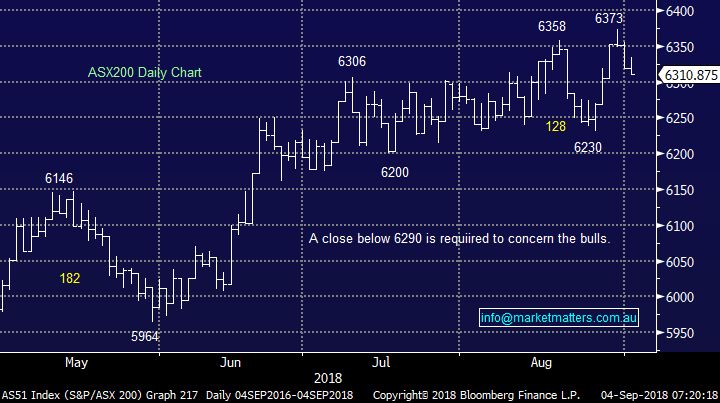
The ASX200 has been a “choppy mess” since late June and on balance, we again feel the local market is headed lower to retest the 6200-support area – the S&P500 has rallied over 3% from July but we’ve failed to make any positive headway, never a good sign.
· We remain neutral the ASX200 but still in very cautious “sell mode”.
Overnight stocks were quiet due to the US Labor Day long weekend with the only move of note being a very weak pound courtesy of BREXIT concerns, but this did help the UK’s FTSE bounce back +1% - equity markets often like a weak currency because it helps competitiveness.
The weakness from some of major resource stocks yesterday has forced has us to revisit the sector faster than we anticipated – sorry for the report repetition but if we are considering altering / tweaking our plans its important to keep subscribers informed.
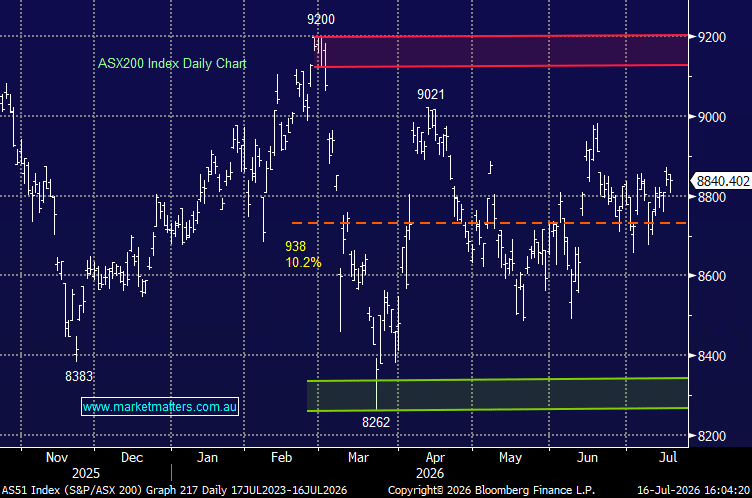
ASX200 Chart
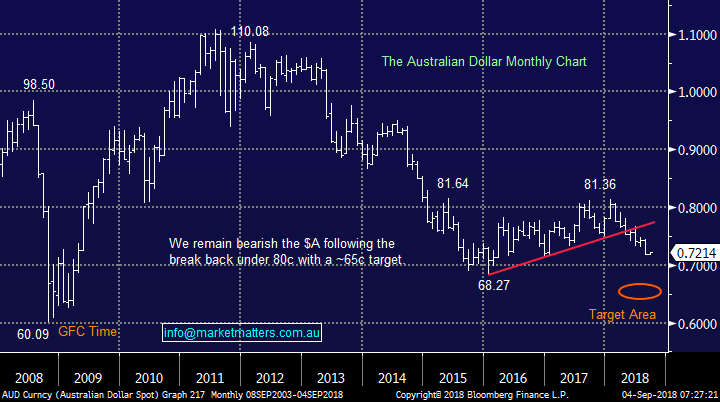
The Australian Dollar
The downtrend in the $A remains firmly intact but after a constant decline in 2018 a reasonable bounce would not surprise in the short-term.
· MM remains bearish and short the $A targeting ~the 65c area.
The Australian Dollar ($A)
The Australian Resources sector
The local resources sector has continued to come under pressure as US-China trade concerns escalate. Also, we did express apprehension earlier in the year that investors had become too complacently long the resources sector following its strong 2-year advance i.e. when everyone’s long markets have a tendency to fall = the path of most pain!
At MM we’ve been considering buying the current correction over recent weeks, but it’s simply “felt wrong” and we’ve so far benefited from our patience.
Over the weekend we had been leaning towards buying resources as opposed to the emerging markets ETF, we must also question if that slight change in fact is prudent.
Today I have looked at 6 stocks MM has been considering recently to see if we need to reassess our thinking.
NB We still regard the resources sector as a more short-term vehicle, simply because the stocks cannot influence the price of the underlying commodities and hence their year to year profitability.
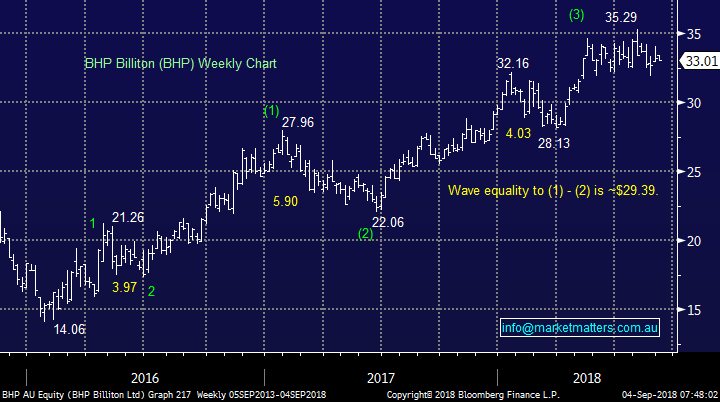
1 BHP Billiton (BHP) $33.01
BHP continues to defy gravity when compared to most of its peers, sitting only 3% below where we exited the stock in May.
Other iron ore, copper, coal and even oil stocks have corrected at times in 2018, but BHP has held firm. Overall BHP is trading very positively and tracking any optimistic theme at the time, although mainly its folowed the stronger energy sector - in 2017 only ~17% of its revenue came from oil.
· MM remains keen buyers of BHP, but at this stage only below $30, around 10% lower.
BHP Billiton (BHP) Chart
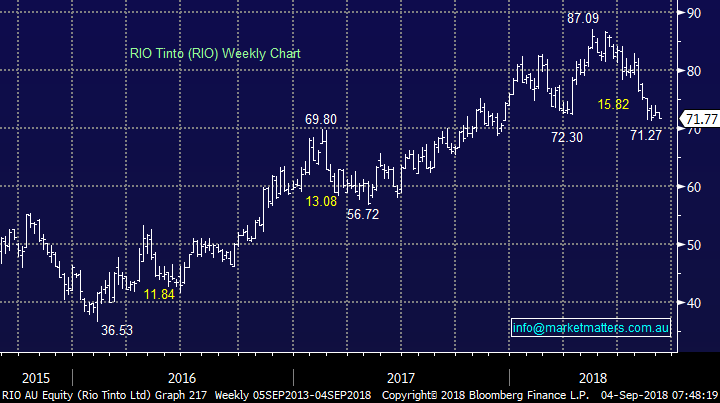
2 RIO Tinto (RIO) $71.77
RIO has corrected over 18% from its May high, about 3 times more than BHP. RIO certainly had a messier result of the 2 plus has a greater % of revenue from iron ore but it still feels to us like RIO has been relatively unduly treated.
MM bought RIO at the end of last month at $72.67 with the plan to average below $70 i.e. around 3% lower. We remain comfortable with this plan, but it may become a shorter term play than originally anticipated.
· MM is still considering averaging our RIO position below $70.
RIO Tinto (RIO) Chart
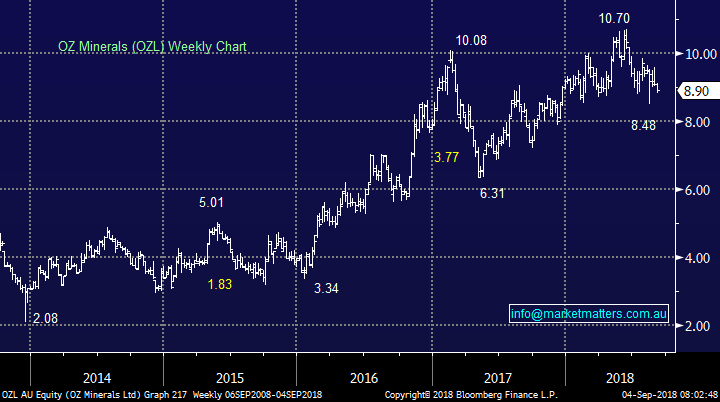
3 OZ Minerals (OZL) $8.90
OZL has corrected over 20% from its 2018 high and yesterday was knocking on the door of the $8.80 area where we had been considering buying the copper / gold producer.
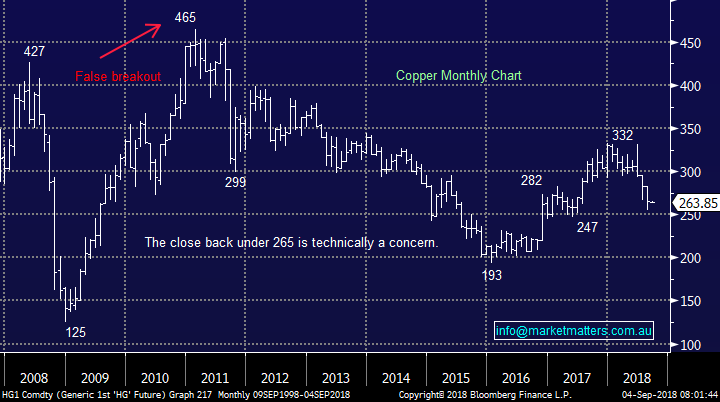
OZL has chosen the direction of becoming a global copper producer i.e. its basically put all eggs in one basket. This is illustrated by OZL having corrected almost exactly the same amount as copper which is now -20.4% below its 2018 top.
Technically OZL looks very capable of breaking under $7 and we have decided to now step aside, at least for a while.
· MM is now neutral OZL and do not currently plan to buy further weakness.
OZ Minerals (OZL) Chart
Copper Chart
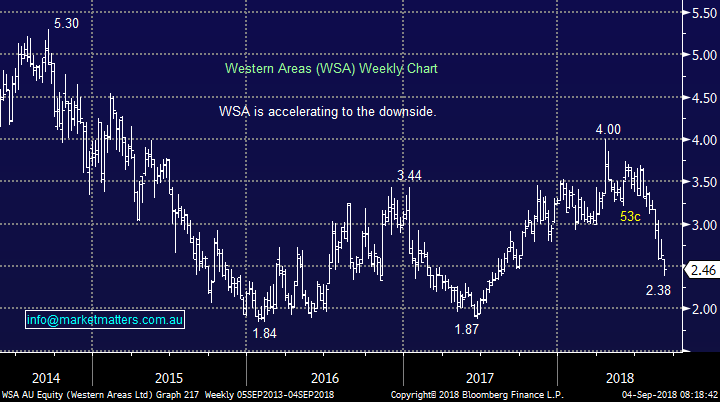
4 Western Areas (WSA) $2.46
Nickel producer, WSA was the weakest stock in the ASX200 yesterday falling -6.5% with fellow producer Independence Group (IGO) not far behind down -3.5%.
Technically WSA looks destined to test the $2 area, over 15% lower although a ~50c countertrend bounce is probably not too far away. Previously we were considering WSA below $3, but decided to pass because it felt wrong - a fortunate win for the “Gut Feel” with the stock almost 20% lower yesterday.
· MM may consider WSA into weakness as “trade”, but because of our medium-term outlook we will be very fussy on entry.
Western Areas (WSA) Chart
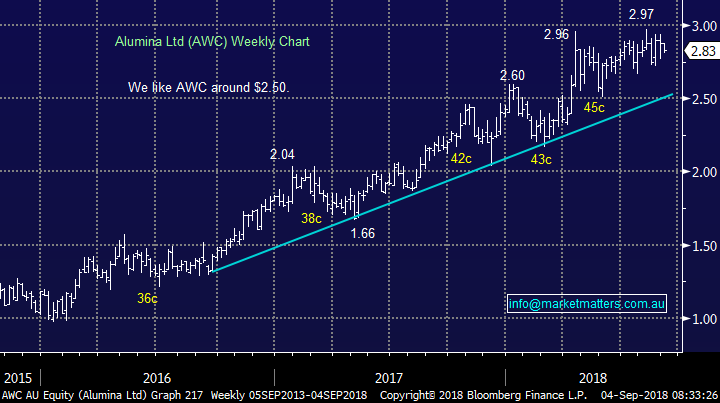
5 Alumina (AWC) $2.83
Alumina producer AWC remains firm less than 5% below its 2018 high, but the stocks relatively low valuation and yield of over 8% fully franked remains very supportive.
Technically it should not be overlooked that AWC is very capable of pullbacks having fallen 15% or more 5 times since mid-2016, certainly one for the patient.
· MM still likes AWC but around the $2.50 area.
Alumina (AWC) Chart
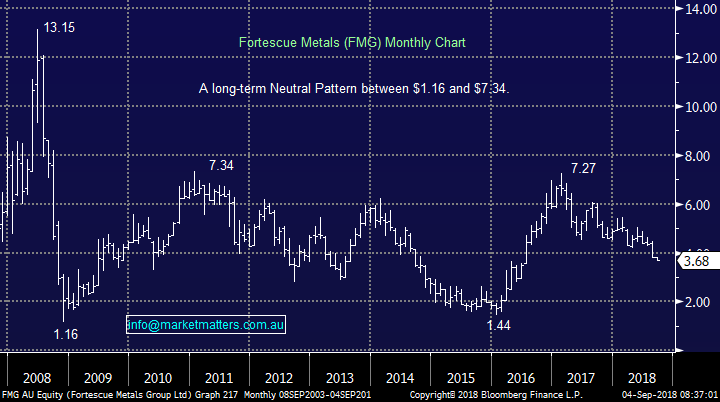
6 Fortescue Metals (FMG) $3.68
FMG continues to drift lower and is now almost 50% below its 2017 high. Investors are concerned with a number of areas including the underlying iron ore price and China’s move towards a cleaner environment, not good news for FMG’s lower grade ore.
For all its volatility, FMG has remained in the same range since the GFC and today we find ourselves just below the mid-point of the normal distribution for the mathematicians out there.
We hold FMG in our Income Portfolio for its 6.25% fully franked yield but have held back from averaging the relatively small position, as originally planned / discussed, because no positive catalyst has yet materialised.
· MM is neutral FMG a current levels.
Fortescue Metals (FMG) Chart
Conclusion
Today we have split this important section into 2 parts.
Firstly our refined macro thoughts:
- MM again prefers the emerging markets to our overall resources sector at present although both are a little scary.
- At this stage of the cycle, MM prefers the larger diversified miners e.g. BHP and RIO as opposed to the commodity specific companies like WSA with nickel. AWC is the exception here if we see a 10-15% correction.
Secondly our individual stocks thoughts:
- Bullish into weakness AWC, BHP & RIO.
- Neutral FMG and OZL.
- Bearish medium-term WSA.
NB We do see trading opportunities in the likes of WSA, but they will be active high risk.
Overseas Indices
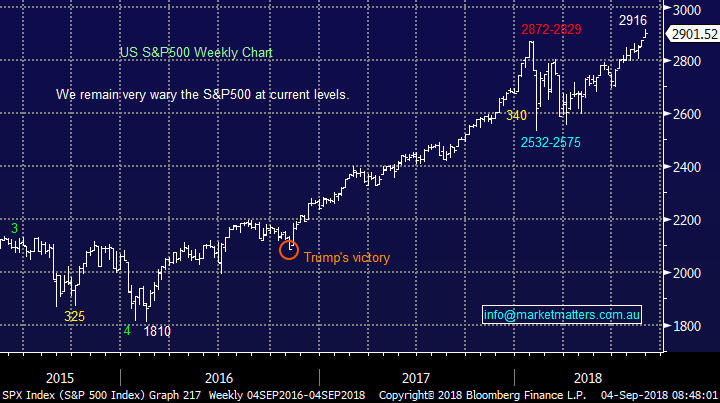
No change with US markets as it was closed overnight.
US S&P500 Chart
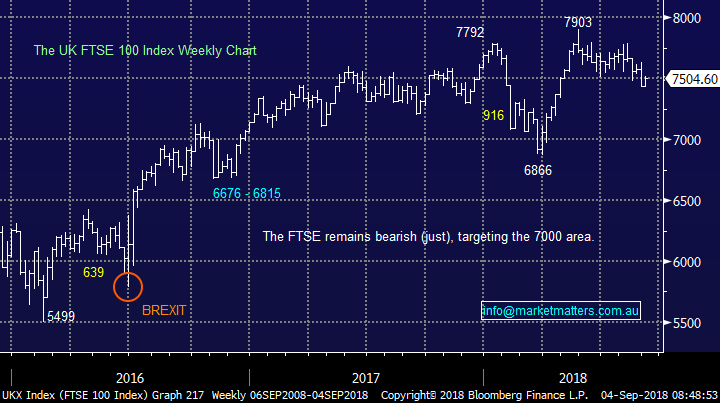
Last night strong rebound by the UK FTSE has not changed a bearish stance at this point in time.
UK FTSE Chart
Overnight Market Matters Wrap
· A quiet session across the globe overnight, with the US equity markets closed in observance of Labor Day.
· In the European region however, the UK FTSE outperformed the major European indices, ending its session up 0.97%, while Germany’s DAX closed 0.14% lower.
· The Aussie battler gained some of its lost faith from yesterday’s performance, up 0.6% to US72.12c from yesterday’s low of US71.69c.
· Today, the RBA meets for the September interest rate decision, with a Bloomberg consensus of a 99.6% chance of rates left unchanged for September.
· The September SPI Futures is indicating the ASX 200 to open 10 points higher towards the 6320 level this morning.
Have a great day!
James & the Market Matters Team
Disclosure
Market Matters may hold stocks mentioned in this report. Subscribers can view a full list of holdings on the website by clicking here. Positions are updated each Friday, or after the session when positions are traded.
Disclaimer
All figures contained from sources believed to be accurate. Market Matters does not make any representation of warranty as to the accuracy of the figures and disclaims any liability resulting from any inaccuracy. Prices as at 04/09/2018
Reports and other documents published on this website and email (‘Reports’) are authored by Market Matters and the reports represent the views of Market Matters. The MarketMatters Report is based on technical analysis of companies, commodities and the market in general. Technical analysis focuses on interpreting charts and other data to determine what the market sentiment about a particular financial product is, or will be. Unlike fundamental analysis, it does not involve a detailed review of the company’s financial position.
The Reports contain general, as opposed to personal, advice. That means they are prepared for multiple distributions without consideration of your investment objectives, financial situation and needs (‘Personal Circumstances’). Accordingly, any advice given is not a recommendation that a particular course of action is suitable for you and the advice is therefore not to be acted on as investment advice. You must assess whether or not any advice is appropriate for your Personal Circumstances before making any investment decisions. You can either make this assessment yourself, or if you require a personal recommendation, you can seek the assistance of a financial advisor. Market Matters or its author(s) accepts no responsibility for any losses or damages resulting from decisions made from or because of information within this publication. Investing and trading in financial products are always risky, so you should do your own research before buying or selling a financial product.
The Reports are published by Market Matters in good faith based on the facts known to it at the time of their preparation and do not purport to contain all relevant information with respect to the financial products to which they relate. Although the Reports are based on information obtained from sources believed to be reliable, Market Matters does not make any representation or warranty that they are accurate, complete or up to date and Market Matters accepts no obligation to correct or update the information or opinions in the Reports. Market Matters may publish content sourced from external content providers.
If you rely on a Report, you do so at your own risk. Past performance is not an indication of future performance. Any projections are estimates only and may not be realised in the future. Except to the extent that liability under any law cannot be excluded, Market Matters disclaims liability for all loss or damage arising as a result of any opinion, advice, recommendation, representation or information expressly or impliedly published in or in relation to this report notwithstanding any error or omission including negligence.