Are bargains slowly surfacing in the Diversified Financials Sector? (BHP, ALL, AMP, IFL, CGF, MFG)
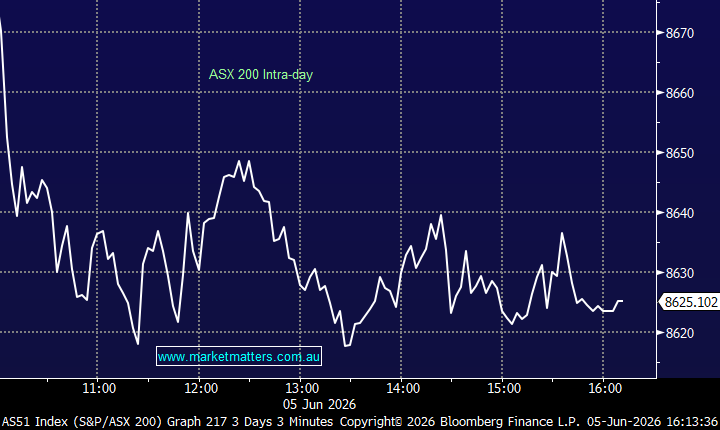
The ASX200 had a very quiet Monday to kick off the week, especially after the aggressive declines over the last 7 trading sessions. The market finally closed marginally lower with the standout support coming from the high valuation / growth stocks which have been smacked the hardest this month while resources continued to struggle.
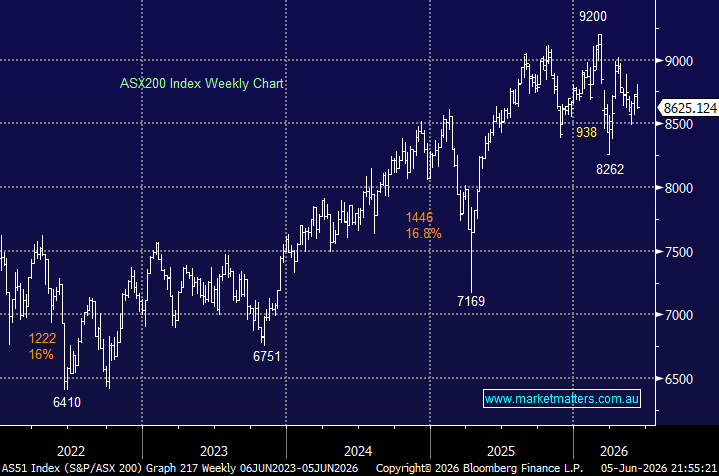
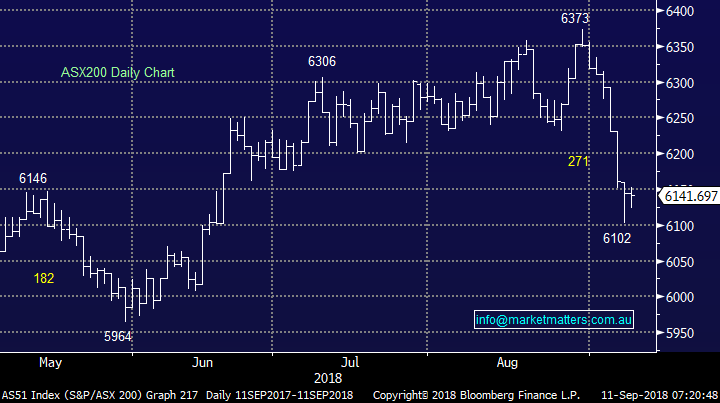
The ASX200 has fallen 271-points in an aggressive manor from its high on the 30th of August. From a technical perspective yesterday’s small bounce on low volume is synonymous with a market consolidating prior to further declines, time will obviously tell but in our opinion the more time spent below 6200 the greater the chance of another leg lower. For our downside target area to be achieved we are likely to need to see some weakness to finally materialise from US stocks but that’s certainly not unfolding at this stage.
· MM remains negative the ASX200 with an ideal target ~5800.
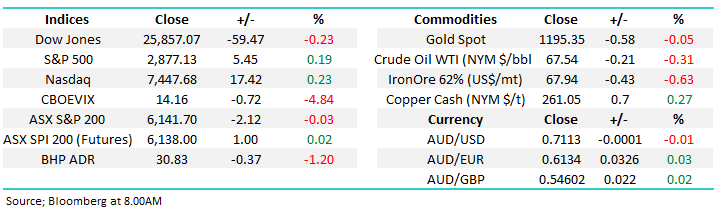
Overnight stocks were very quiet with the Dow Jones lower but the broader S&P500 and Europe closed higher. The SPI futures are calling the ASX200 to open flat although BHP was trading ~$30.80 on the US ADR market, down another 1.3% to its lowest level since April.
Today’s report is going to look at the battered Diversified Financials Sector which has endured an extremely tough year e.g. AMP Ltd (AMP) -33.3%, IOOF Holdings (IFL) -26% and Challenger Ltd (CGF) -15.3%. With the US – China trade war having a quiet 24 hours it’s an opportune time to look at a beaten up sector with an eye out for accumulation levels.
ASX200 Chart
“Fear of missing out” - FOMO
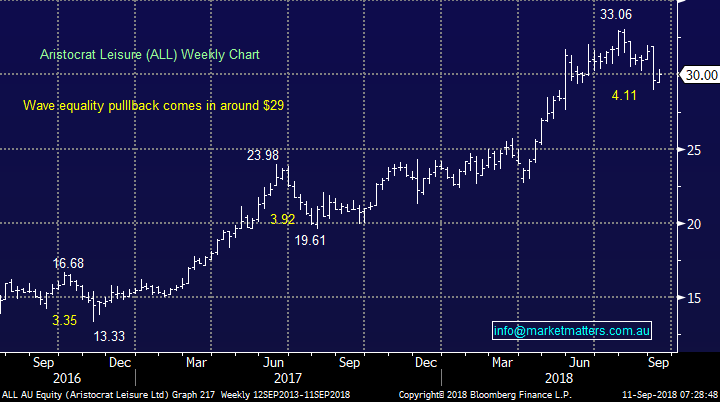
We have been discussing buying Aristocrat (ALL) around $29 for a few weeks and after its 15-minute spike down to $28.95 on Friday, the “tape” was clearly frustrating to a few of us at MM i.e. a strong 3.5% bounce.
However, due to our overall bearish view for the coming weeks we have restrained ourselves from chasing ALL higher into strength – fingers crossed!
· MM likes ALL into weakness with the $29 area our ideal buy zone.
NB When we say “tape” it’s with reference to the trades unfolding during any given day.
Aristocrat (ALL) Chart
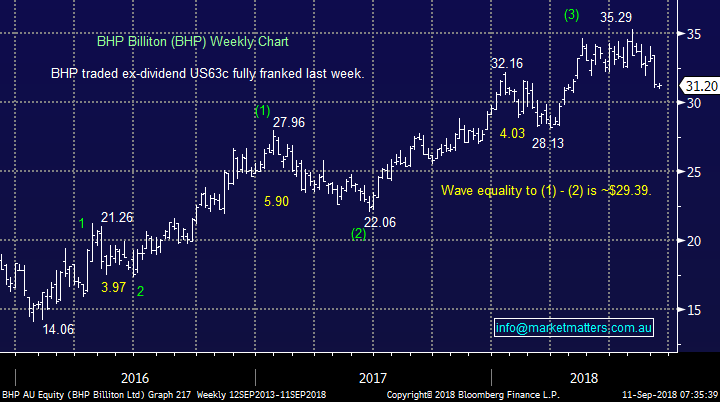
Conversely our patience with BHP is looking good so far. We exited the last of our BHP position at $34 back in May and the “big Australian” has basically traded sideways until breaking lower this month.
The China concerns appear to be weighing on BHP plus we suspect that many investors are complacently long the diversified miner and its only now that some doubt may entering their minds.
· MM remains keen buyers of BHP below $30.
BHP Billiton (BHP) Chart
Looking for value in the diversified financials
A number of the diversified financial stocks have experienced a tough year with the Hayne Royal Commission weighing on many in the sector e.g. AMP is down over 30% over the last year. Also, the bears are certainly echoing that a large pullback is ominously close at hand – we have been among them at times!
For this report the negative market sentiment looking forward may eventually become an opportunity because investors appear to be dodging the sector as fund managers usually struggle in bear markets. However their valuations are already fairly cheap and if we do see a sharp 5-6% correction from here then they will look compelling in a number of cases i.e. somebody still has to look after the growing pool of superannuation!
· MM often looks at unloved sectors because the elastic band virtually always becomes too stretched.
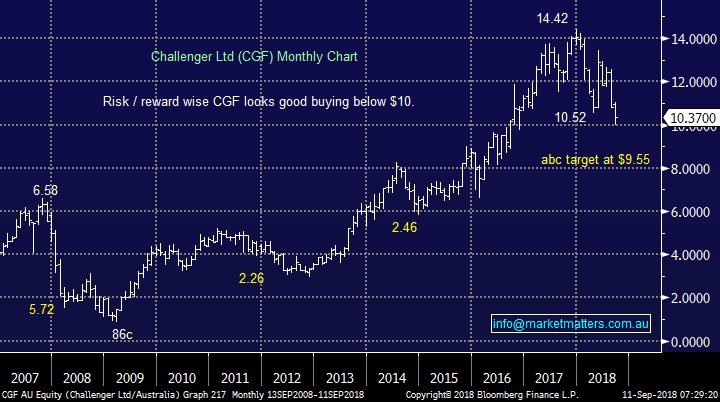
1 Challenger $10.37
CGF has been one of the most popular stocks on the ASX over recent years due to the success of its annuity products but the polish has clearly come off the stock since late 2017 illustrated by its 28% correction.
Rising bond yields are not great news for CGF while their decision to lower the risk profile of their asset pool (that underpins annuities) is also a negative for earnings. On the flipside, the company has a number of tailwinds including an ageing population and currently appearing to be on the correct side of the government, plus they have growth paths through Japan.
CGF is trading on a P/E of 15.7x Est 2019 earnings while yielding 3.4% fully franked.
We like CGF but like all stocks only at the correct price.
· MM are potential buyers of CGF under $9.75, another 6% lower.
Challenger Ltd (CGF) Chart
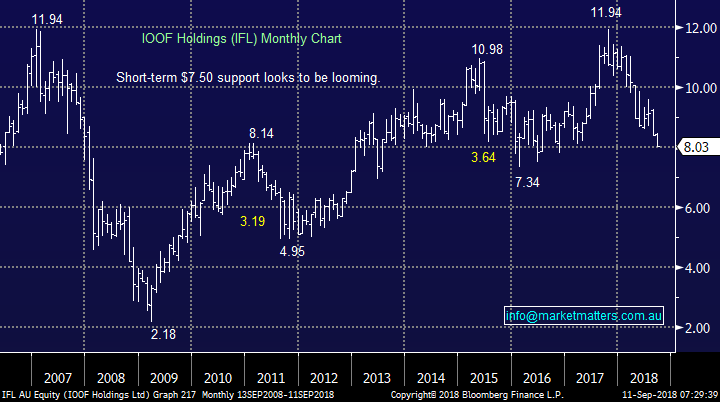
2 IOOF Holdings Ltd (IFL) $8.03
IFL’s profit release in August showed profits down well over 20% despite organic growth in the business but the big issue is they appear to have bought ANZ’s wealth division at the top of the market. The Royal Commission has shone the light on this sector (and rightly so) in a way that will lead to ongoing regulatory costs, with IOF’s patchwork of systems thanks to recent acquisitions making this a more complicated / costly process for them. That means ILF will find it difficult to achieve the full benefit of recent acquisitions and it seems clear that they’ll look back in time with a grimace in terms of what they paid to acquire scale.
IOF is trading on a P/E of 12.2x Est 2019 earnings while yielding 6.7% fully franked.
Value is definitely emerging in this out of favour stock however we’re unlikely to be buyers – simply too much complexity at the moment
· Technically, we are targeting $7.50, another 6-7% on the downside
IOOF Holdings Ltd (IFL) Chart
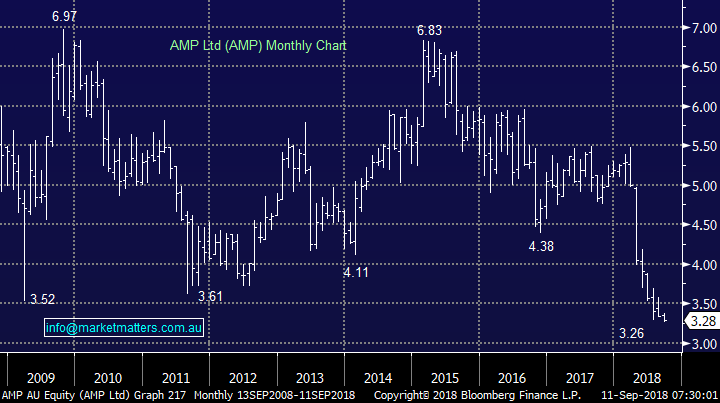
3 AMP Ltd (AMP) $3.28
AMP has been a basket case for years, often mentioned in the same breath as Telstra (TLS) which has suddenly rallied over 25% this financial year.
We reckon the company will need a few years to rebuild after its battering at the royal commission but its healthy dividend arguably makes it worth the wait if the stocks downside is now limited – David Murray (ex CBA) has described his new job as Chairman as the toughest in corporate Australia.
AMP is trading on a P/E of 10.6x Est 2018 earnings while yielding 7.5% fully franked.
We feel the downside momentum in AMP is reducing fast but the stock is unlikely to bounce hard for a while - we can see the stock oscillating between $3 and $3.50 moving forward
· MM likes AMP as medium-term aggressive buy ideally a little lower – perhaps also one for the Income Portfolio!
AMP Ltd (AMP) Chart
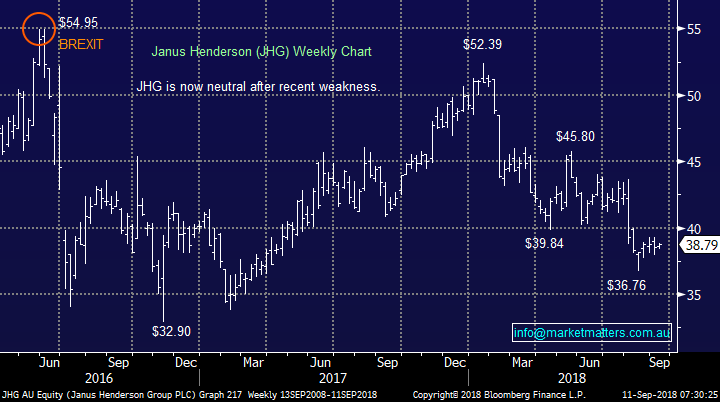
4 Janus Henderson (JHG) $38.79
JHG remains the standout stock in the sector from a value perspective although its recent result did disappoint the market. The dual listed company which operates out of the US and London specialises in both equities and bonds giving it a degree of potential insulation from an aggressive pullback in global stocks.
JHG is trading on a P/E of 9.6x Est 2018 earnings while yielding 4.6% unfranked.
· We continue to hold our position in JHG primarily from a pure valuation perspective.
Janus Henderson (JHG) Chart
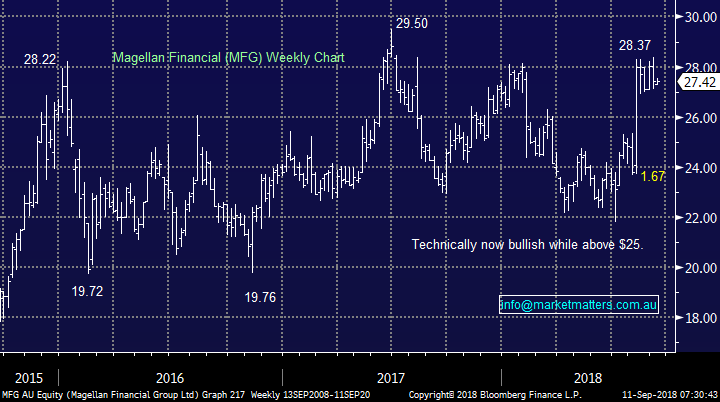
5 Magellan Financial Group (MFG) $27.42
MFG has been a strong performer within the sector especially following an excellent report and increased dividend in August. We do like the business however there is a saturation point in a business like this where their strategy simply cannot handle more $$.
MFG is trading on a P/E of 16.3x Est 2019 earnings while yielding 4.9% fully franked.
· MM is bullish MFG with an ideal entry ~$26.75, or only 2% lower, targeting $30.00
Magellan Financial Group (MFG) Chart
Conclusion
We can see MM buying into this battered sector into weakness with potential levels outlined below:
· CFG $9.75, AMP $3.10 and MFG $26.75 while we’ll look at IFL again if it trades down to ~$7.50
NB MFG is the quality end of the scale, while CGF, AMP & IFL would be on valuation grounds.
Overseas Indices
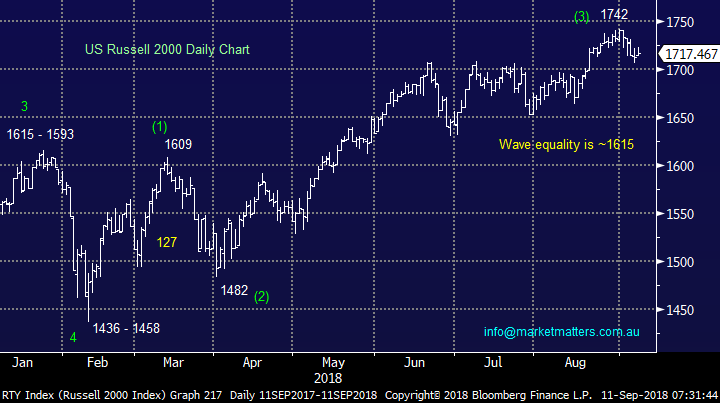
We continue to watch the strong performing US Russel 2000 Index closely, our ideal retracement area is ~6% lower.
US Russell 2000 Chart
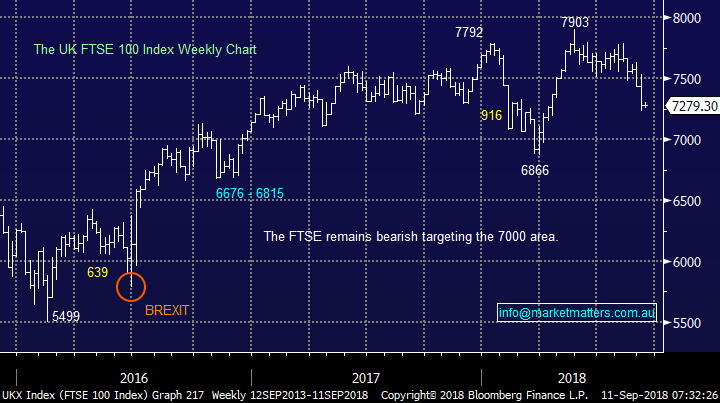
Europe continues to follow our anticipated path with the FTSE heading towards the 7000 region.
UK FTSE Chart
Overnight Market Matters Wrap
· A quiet start in the US overnight as investors remain on the sideline waiting for further details between the current US-China trade situation, with broader S&P 500 ending its day up slightly, while the Dow was marginally lower.
· This allowed a breathing space for commodities and the A$, which were generally a touch firmer after the recent rout. Aluminium jumped over 1%, Crude oil 0.31% lower to US$67.54/bbl, gold and copper flat, but iron ore lower.
· BHP is expected to continue its slide lower, after ending its US session down an equivalent of 1.20% from Australia’s previous close.
· The September SPI Futures is indicating the ASX 200 to open with little change, still testing the 6145 level this morning.
Have a great day!
James & the Market Matters Team
Disclosure
Market Matters may hold stocks mentioned in this report. Subscribers can view a full list of holdings on the website by clicking here. Positions are updated each Friday, or after the session when positions are traded.
Disclaimer
All figures contained from sources believed to be accurate. Market Matters does not make any representation of warranty as to the accuracy of the figures and disclaims any liability resulting from any inaccuracy. Prices as at 11/09/2018
Reports and other documents published on this website and email (‘Reports’) are authored by Market Matters and the reports represent the views of Market Matters. The MarketMatters Report is based on technical analysis of companies, commodities and the market in general. Technical analysis focuses on interpreting charts and other data to determine what the market sentiment about a particular financial product is, or will be. Unlike fundamental analysis, it does not involve a detailed review of the company’s financial position.
The Reports contain general, as opposed to personal, advice. That means they are prepared for multiple distributions without consideration of your investment objectives, financial situation and needs (‘Personal Circumstances’). Accordingly, any advice given is not a recommendation that a particular course of action is suitable for you and the advice is therefore not to be acted on as investment advice. You must assess whether or not any advice is appropriate for your Personal Circumstances before making any investment decisions. You can either make this assessment yourself, or if you require a personal recommendation, you can seek the assistance of a financial advisor. Market Matters or its author(s) accepts no responsibility for any losses or damages resulting from decisions made from or because of information within this publication. Investing and trading in financial products are always risky, so you should do your own research before buying or selling a financial product.
The Reports are published by Market Matters in good faith based on the facts known to it at the time of their preparation and do not purport to contain all relevant information with respect to the financial products to which they relate. Although the Reports are based on information obtained from sources believed to be reliable, Market Matters does not make any representation or warranty that they are accurate, complete or up to date and Market Matters accepts no obligation to correct or update the information or opinions in the Reports. Market Matters may publish content sourced from external content providers.
If you rely on a Report, you do so at your own risk. Past performance is not an indication of future performance. Any projections are estimates only and may not be realised in the future. Except to the extent that liability under any law cannot be excluded, Market Matters disclaims liability for all loss or damage arising as a result of any opinion, advice, recommendation, representation or information expressly or impliedly published in or in relation to this report notwithstanding any error or omission including negligence.