Subscriber’s Questions – (RIO, RBTZ, NTC, PDL, HSO)
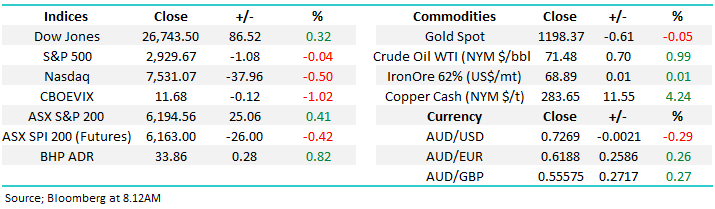
The SPI futures closed on Saturday morning pointing to an ASX200 opening down around 17-points today, on balance this felt a touch harsh to us considering the moves on global markets into the weekend. However the news out of China over the weekend may now see this as an optimistic start to the week.
We believe 3 facts should be considered by investors this week as potential influences on local stocks moving forward:
1. China cancelled trade talks with the US sending any short-term dispute resolution up in a puff of smoke – perhaps President Trump was too confident on this one.
2. The Australian real estate market had a better weekend on the auction front any glimmers of positive news for this vital part of the Australian economy is supportive for equities.
3. Around $13bn of dividends will land in investors pockets this week which is likely to provide some stock market support at some stage in the weeks / months ahead.
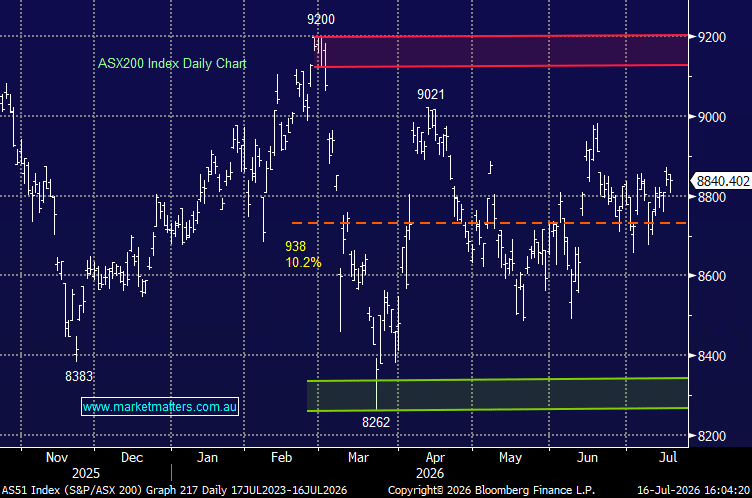
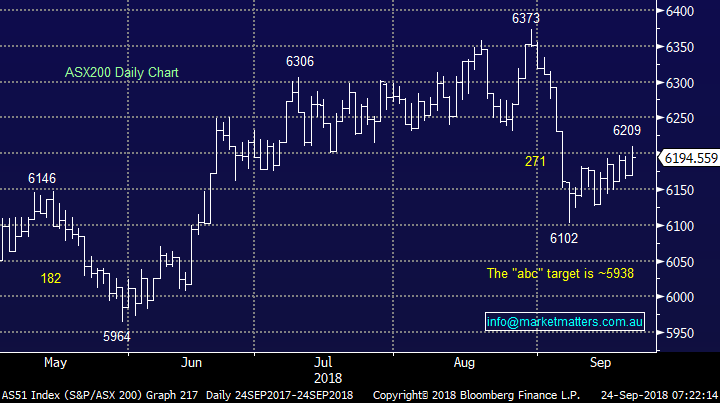
On balance the China news is likely to be more dominant but the positive local influences add confidence to our general plan to buy a spike under 6000 by the ASX200.
· We are negative the ASX200 initially looking for break below 6000.
Thanks again for some more great questions, we truly feel like our subscriber base is becoming increasingly more market savvy.
ASX200 Chart
Question 1
"Hi Guys, love your work. I’ve bought RIO based on your recommendation, could you please explain in detail how the Rio buyback will work, what our options are and what you believe the best course of action will be.” – Thanks & Regards, Neil P.
Hi Neil,
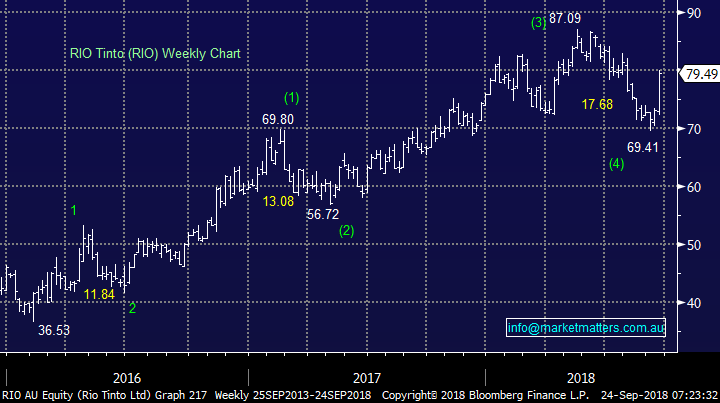
Firstly, lets clarify our view on RIO after last week’s impressive +8.7% post the buyback announcement – we are bullish RIO targeting the $90 area.
· Hence MM is considering increasing our RIO position around the $78 area – the China news may make this possible
Secondly, moving onto the buyback itself which is how RIO intends to return ~$3.2bn of post-tax coal disposal proceeds to its shareholders I.e. us!
“The proceeds will be returned through a $3.2 billion share buy-back programme, combining an off-market buy-back tender targeting up to 41.2 million Rio Tinto Limited shares and further on-market purchases of Rio Tinto plc shares. The Programme is subject to market conditions and compliance with all applicable laws and regulations.” – RIO.
NB this is in addition US1bn buyback announced on 1 August 2018, US$ 1 billion announced on 7 February 2018 and US$1.925 billion of the $2.5 billion share buy-back programme, returning the proceeds from the sale of Coal & Allied announced on 21 September 2017.
1. In the on market buyback the company will be buying back $700m worth of their stock in London. The shares in London trade at a discount to shares in Australia hence it makes sense for the company to buy them back there.
2. The off market is by tender process and is slightly more complex. Generally, those in a low or zero tax environment will benefit the most given the compositing of the buy back is a large fully franked dividend then a smaller capital return. Rather than rehash already well presented information NAB Trade have done a good explanation below. **Importantly, those who maybe short RIO options should look at the implications of being short a big fully franked dividend**
https://www.nabtrade.com.au/investor/insights/latest-news/news/2017/10/analysis_of_rio_tint
Lastly, Australian Investors who want to participate in the buyback can still buy stock today - the last day to be able to buy stock and offer into the off-market buyback.
In the Income Report this week we’ll include a model for the buy-back and some insight around when / if its beneficial for holders of stock to participate.
RIO Tinto (RIO) Chart
Question 2
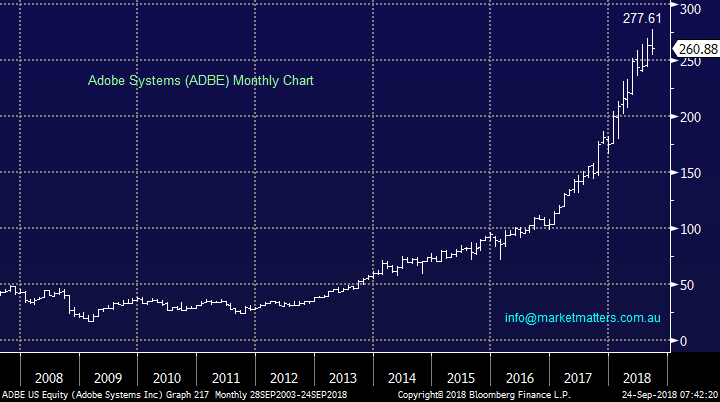
“Of the FANGS, only AMZN and NFLX show consistent growth. If you’re investing in the US market there are other companies that warrant investigation such as Adobe (ADBE) which is only outperformed by the aforementioned and in turn outperforms the others consistently over any time period. It’s also #30 on the IBD 50 which is probably a better place to look IMHO for growth opportunities. ADBE’s market cap is marginally smaller than NFLX so it’s not a small cap by any measure.” - David H.
Hi David,
Certainly agree with your view on Adobe - like many NASDAQ players its enjoyed a superb rally since the markets consolidation in 2015/6, roughly tripling in price. Unfortunately at times our market does have a dearth of such quality tech based companies which we believe actually leads to general significant overpricing of any such opportunities on the local market which unfortunately then creates poor risk / reward because obviously many will ultimately disappoint in the big picture.
Adobe (ADBE) Chart
Question 3
“Following on from your morning report, just wondering if Evans and Partners (EGD) would be an easy entry into the tech space?” – Bruno F.
Hi Bruno,
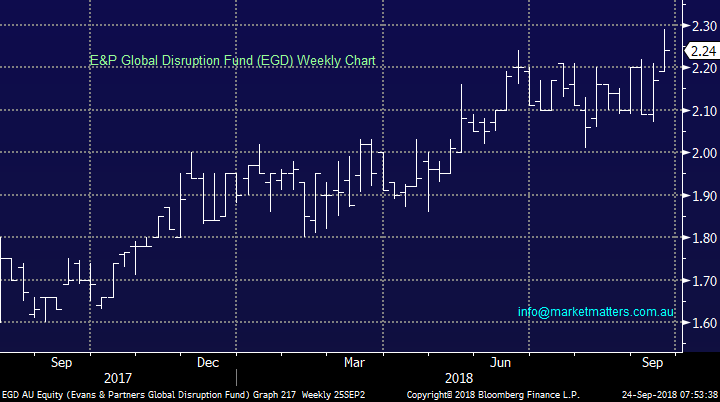
Evans and Partners (EDG) do have international funds that they manage and some of these have tech exposure however buying the stock EDG gives you exposure to more than just global tech. EDG came out of the merger between Evans and Partners and Dixon Advisory which then listed on the ASX last year. They do everything from wealth management, superannuation along with funds management. EDG is more a play on growing local superannuation than a proxy for international technology investment. There are ASX listed ETFs that give exposure to technology. The NDQ which tracks the Nasdaq is the probably the purest of these listed on the ASX. Alternatively, buying and holding direct shares overseas is now fairly simple.
E&P Global Disruption Fund (EGD) Chart
Question 4
“Hello, just wondering if you can do some research on the new ETF RBTZ, even though Beta are touting it strongly, I can’t help but agree with them, be interested in your take on it.” - regards Richard R.
Hi Richard,
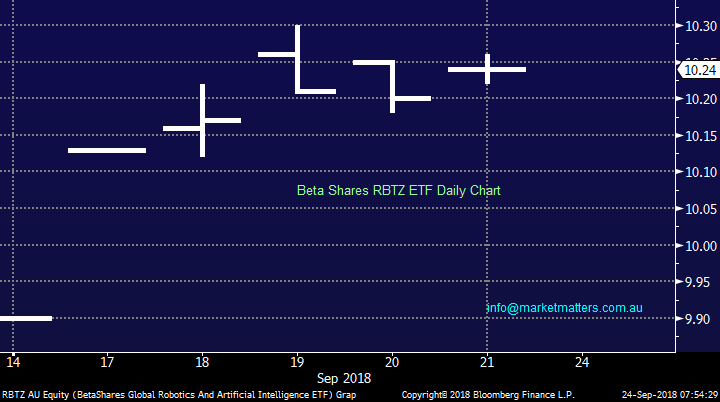
The RBTZ is a new exchange traded fund (ETF) from BetaShares that gives investors listed exposure to companies involved in robotics and artificial intelligence - areas that we read a lot about as the future for many diverse industries, including financial advice! Australia is behind the curve in this area so the ETF invests primarily in overseas markets with Japan and the US making up more than 70% of their geographic exposure. Returns have been strong for companies in this sector with the index that this ETF tracks up 24.56% over the past 12 months. Fees are reasonable at 0.57% pa however worth noting that this is a new product and at last look it had ~$5m invested in it. Given this is a new product, we always like to see some form of track record in terms of the fund delivering on what they aim to – in this case, tracking the index. Certainly an interesting fund but not one for us at this stage.
BetaShares Global Robotics & AI ETF Chart
Question 5
“Boys, how does the chart of NTC look? Being mentioned as a takeover target and is a global leader in Fixed Wireless and Fibre to The Curb technology. Mkt Cap $100m and has $27m in cash. Working on some big contracts at the moment. Could easily be taken over as management have over promised and under delivered so has plenty of disgruntled shareholders. A drop in the sand for a Large US company such as Cisco, AT and T, ADTRAN, Ericsson etc. especially considering the low AUD. Recently made $9m NPAT.” – Cheers Peter S.
Hi Peter,
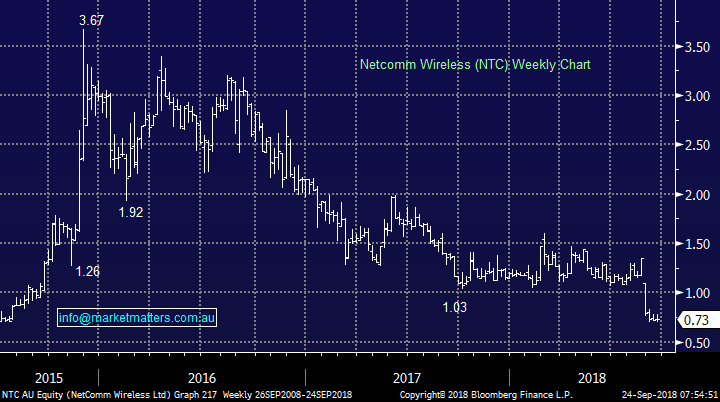
For subscribers new to the stock NetComm supplies fixed wireless equipment to the national broadband network (NBN), the company recently stunned investors with a very disappointing FY19 outlook - revenue growth has slowed to 15% to 20% (from 69% in FY18).
Everything initially read so well but the stock price looked horrible implying something was wrong “under the hood” – another thumbs up not to ignore charts. The companies Est P/E for 2019 is still 66x putting it firmly in the basket of a high valuation / growth stock – not where MM wants to be generally invested moving forward.
However I’m pleased to see directors buying shares in NTC after its latest plunge a few weeks ago. Also, growth is not limited to just sales around the NBN with offshore NetComm has signed a few contracts with North American Telcos, like AT&T, to supply wireless equipment for rural broadband and its 5G solution.
From a risk / reward basis I think NTC has a place in “the aggressive corner” of a portfolio with the insider buying tipping my thoughts but I stress its clearly an aggressive play.
NetComm Wireless (NTC) Chart
Question 6
“Hi MM team, I read your commentary daily, always interest and challenging. Q. Are we seeing a BLOW OFF TOP in USA equity markets ????” - Regards Steve K.
Hi Steve,
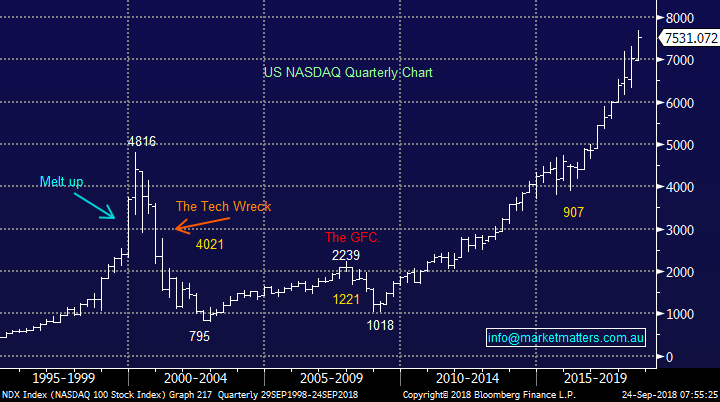
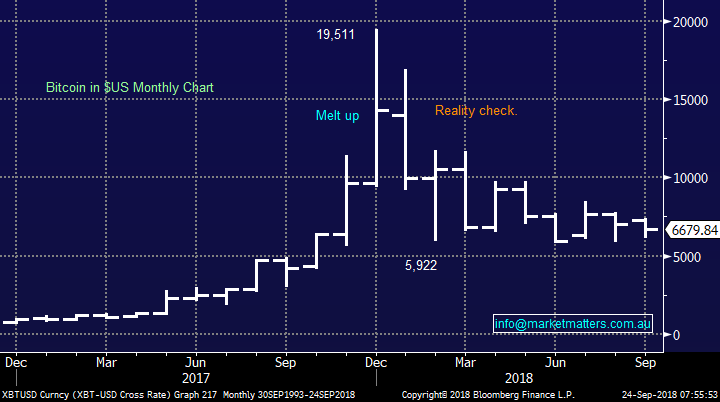
We touched on this in the Weekend Report, we do not think so but investors should never say never.
Below are 2 examples of “blow off tops” in recent years and both ended very badly as is usually the case.
At this stage the ascent by the US tech based NASDAQ is far more orderly than what we witnessed ~2000, in fact it’s been a steady impressive ascent since the GFC with only one noticeable “rest” along the way.
Our preference is another 2015/6 style pullback / consolidation is close at hand before the uptrend continues.
US NASDAQ Index Chart
Bitcoin in $US Chart
Question 7
“Hi James I am a new member and would appreciate your thoughts on Pendal Group (PDL). I notice as I speak they have crashed to a new 52 week low of $8.55. Is this a classic case of catching a falling knife or is there real value starting to emerge?” Cheers Paul T.
Hi Paul,
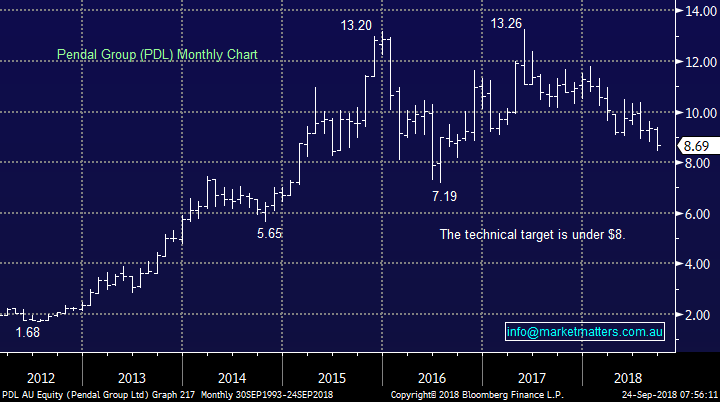
Pendal Group (PDL) is the rebranded BT Investment Management Group and like CYBG Plc and Janus Henderson (JHG) is likely to be hurt by the ongoing bad news around BREXIT negotiations, politicians again unsettling markets.
Value is slowly but surely emerging in the stock / sector but our opinion is the correction has further to run.
PDL currently trades on a Est. P/E for 2018 of 13.9x compared to Janus Henderson (JHG) 9.9x hence we prefer JHG at today’s prices.
At this stage we will only be considering accumulating PDL between $7.50 and $8.
Pendal Group (PDL) Chart
Question 8
“There appears to be large divergence on the USA stock market indexes especially the weekly charts RSI and MACD, could you comment please?” – Hedley M.
Hi Hedley,
I agree but US stocks remain very resilient to “bad news” usually the sign of a strong market.
Technically both the RSI and MACD are illustrating divergence but just like the Fear Index (VIX) they can stay at relatively extreme levels for much longer than many anticipate – this divergence is suggesting the markets a sell
In simple terms the upside momentum is diminishing and a pullback feels likely but our call is only ~5% at this stage, especially with fund managers cash levels very high although they are overweight US equities.
S&P500 Chart
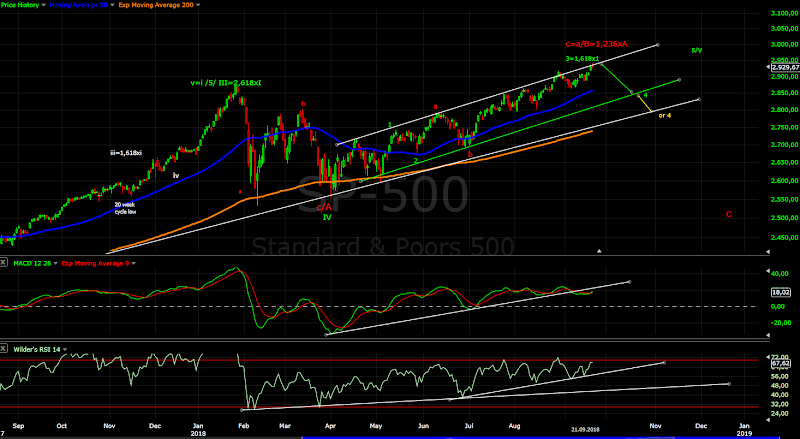
Source; Practical Technical Analysis
Question 9
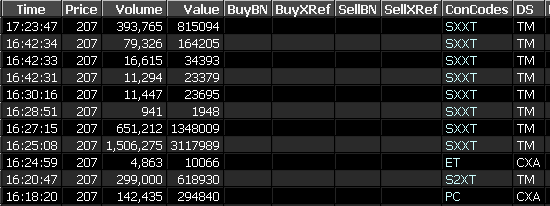
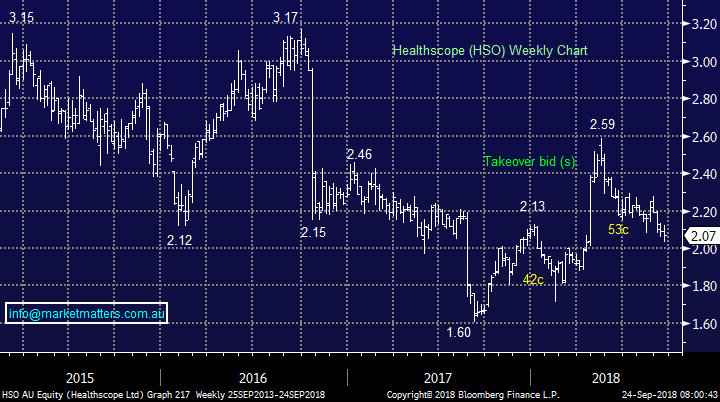
“Please advise me of the significance of the XT trades of HSO on Friday 21/09/2018 Is this a bearish indicator?” - Thank you, Sadhana P.
Hi Sadhana,
The crossing on Friday afternoon was not a significant line as shown below – and for every seller there is obviously a buyer on the other side.
We still believe the stocks reasonable at current levels just like the 2 suitors who were chasing the stock ~$2.50.
Market Trades on Friday
Healthscope (HSO) Chart
Overnight Market Matters Wrap
· A mixed session over the weekend in the US, with the Dow the only major ending its day in positive territory. However this morning, the S&P 500 futures opened further in the red, down 0.3% as I type.
· It was another solid night for the resource sector after hitting their lows earlier in the week. Commodities rebounded across the board as investors returned to the sector after the US tariffs on US$200bn announced on Tuesday were set at a less than expected level of 10%. Copper, a lead barometer for world growth, rallied around 4% to 2.86/lb on what appeared to be investor short covering - the metal was languishing at a recent low of around $$2.60/lb until earlier this week.
· The December SPI Futures is indicating the ASX 200 to open 17 points lower, towards the 6175 level this morning and would not be surprised if she closes weaker.
Have a great day!
James & the Market Matters Team
Disclosure
Market Matters may hold stocks mentioned in this report. Subscribers can view a full list of holdings on the website by clicking here. Positions are updated each Friday, or after the session when positions are traded.
Disclaimer
All figures contained from sources believed to be accurate. Market Matters does not make any representation of warranty as to the accuracy of the figures and disclaims any liability resulting from any inaccuracy. Prices as at 24/09/2018
Reports and other documents published on this website and email (‘Reports’) are authored by Market Matters and the reports represent the views of Market Matters. The MarketMatters Report is based on technical analysis of companies, commodities and the market in general. Technical analysis focuses on interpreting charts and other data to determine what the market sentiment about a particular financial product is, or will be. Unlike fundamental analysis, it does not involve a detailed review of the company’s financial position.
The Reports contain general, as opposed to personal, advice. That means they are prepared for multiple distributions without consideration of your investment objectives, financial situation and needs (‘Personal Circumstances’). Accordingly, any advice given is not a recommendation that a particular course of action is suitable for you and the advice is therefore not to be acted on as investment advice. You must assess whether or not any advice is appropriate for your Personal Circumstances before making any investment decisions. You can either make this assessment yourself, or if you require a personal recommendation, you can seek the assistance of a financial advisor. Market Matters or its author(s) accepts no responsibility for any losses or damages resulting from decisions made from or because of information within this publication. Investing and trading in financial products are always risky, so you should do your own research before buying or selling a financial product.
The Reports are published by Market Matters in good faith based on the facts known to it at the time of their preparation and do not purport to contain all relevant information with respect to the financial products to which they relate. Although the Reports are based on information obtained from sources believed to be reliable, Market Matters does not make any representation or warranty that they are accurate, complete or up to date and Market Matters accepts no obligation to correct or update the information or opinions in the Reports. Market Matters may publish content sourced from external content providers.
If you rely on a Report, you do so at your own risk. Past performance is not an indication of future performance. Any projections are estimates only and may not be realised in the future. Except to the extent that liability under any law cannot be excluded, Market Matters disclaims liability for all loss or damage arising as a result of any opinion, advice, recommendation, representation or information expressly or impliedly published in or in relation to this report notwithstanding any error or omission including negligence.