Market Matters Weekend / Morning Report Tuesday 2nd October 2018

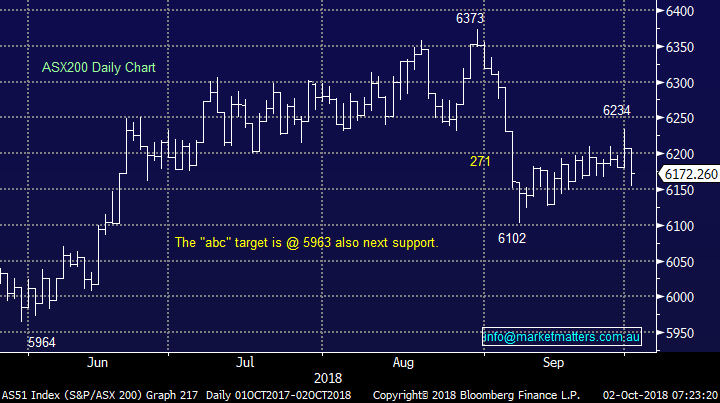
Yesterday the ASX200 was under pressure all day and although it managed to bounce +0.3% from its lunchtime low the index still closed over -0.5% lower - weakness was focused in the banking sector which fell by -1.45%. However it wasn’t just the banks dragging on the index as only the Food & Beverage and Media & Entertainment sectors actually closed in the black, the futures selling was noticeably aggressive considering it was a public holiday in NSW and this was likely attributable to the fragile feel across the broad market.
Two things crossed our mind as the US S&P500 futures roared ahead on the news that Trump had secured a deal with both Canada and Mexico, a new NAFTA agreement and a of vote of confidence for Trumps “art of the deal”!
- China’s market is closed all week for the National Golden Week holiday leading to Asian indices being relatively quiet hence any regional selling would be magnified on our open but relatively illiquid Australian market.
- It felt like traders are still buying US futures and selling the rest of the world e.g. at 5pm AEST the SPI futures were down almost -0.6%, the FTSE -0.6% but the S&P500 futures are up +0.5%.
In a relatively quiet Asian time zone this type of spread trading would often lead to the relatively hard fall we saw to kick off October, plus of course investors reassessment of the interim banking report didn’t help.
- At MM we remain short-term bearish targeting a break below the psychological 6000 area.
The main game in town still remains sector rotation as investors appear to chop and change their minds on the best place to park funds almost daily e.g. On Friday the banks bounced strongly with CBA rallying $1.33 as the interpretation of the banking royal commission interim report was clearly “not too bad / could have been much worse” but yesterday Australia’s largest company gave back over 70% of those gains.
At MM we remain focused on where to deploy our funds if the ASX200 dips under 6000, only around 3% lower. Special consideration is required because we believe this bull market is very late cycle hence investments will be made thinking weeks / months and not years.
ASX200 Index Chart
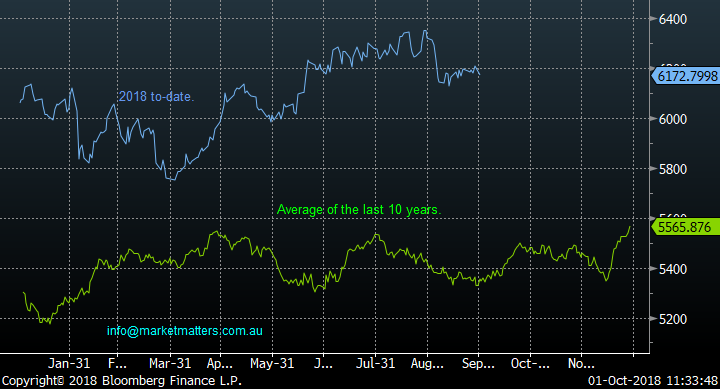
The ASX200 has theoretically left behind one of the weakest periods of the calendar and entered a far more upbeat time of the year. Many more seasoned investors can be forgiven for becoming nervous on the mention of October having witnessed the 20% plunge in 1987 but the statistics tell an overall different tale, whether we go back 10 or 50-years. Over the last 10-years, basically since the GFC:
· In August & September the combined average loss for the ASX is over -2%, in 2018 we saw a decline of -1.58% i.e. not a dramatic variation.
· Conversely October is usually strong rallying on average just under 1%, assisted by investors ploughing some of their dividends back into the market – this year almost $19bn is being paid out to loyal investors.
· Moving forward November is usually a poor month falling -1.83% while December usually rallies nicely into Christmas up +1.56%.
If we do see a selloff in local stocks early in October the seasonality is one of the reasons MM is likely to increase its net market exposure.
ASX200 Index Seasonality Chart
Over the years subscribers have asked why we watch the Bank of America Fund Managers Survey so closely, it’s easy to be flippant and say we want to know what everyone’s thinking and how their invested on a sector / global basis but at MM the real purpose is to look for situations when the powerful human emotions of “Fear & Greed” have simply gone too far.
Some recent examples that the crowd can often be wrong when optimism / pessimism is pushed too far:
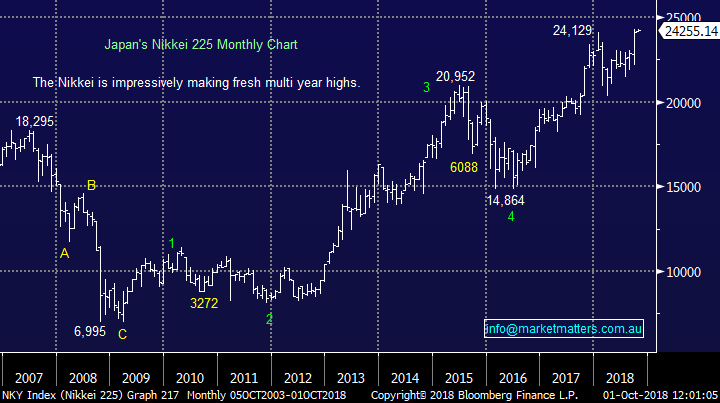
- Reuters reported that Japanese fund managers reduced their exposure to Japanese stocks from 63.1% to 48.8% in August and then in September “pop” we see the Japanese Nikkei rally +5.5% to make fresh 27-year highs.
- The majority simply hated Telstra (TLS) in 2018 but after falling into a June low it has rallied over 20% plus its paid an 11c fully franked dividend. I recall writing a more positive piece on TLS for Livewire and the comments received could be collectively described as ‘you’re mad’ – although I did pick up a pineapple in the process – Tks Jarrod!
- At the start of 2018 one of the most crowded views in many fund manager / hedge fund surveys was the $US would continue to weaken but after finding a low in February it’s rallied ~10%.
- Back in 2015 investors thought that buying banks “was as safe as houses” a phrase that today is looking questionable on both levels. The banks have since been smacked with CBA for example correcting over 30%.
Obviously by definition it’s a zero sum game i.e. for every buyer there’s a seller but we are looking for periods of herd like buying / selling which can lead to sharp moves as we saw with the Nikkei last month.
Japanese Nikkei Index Chart
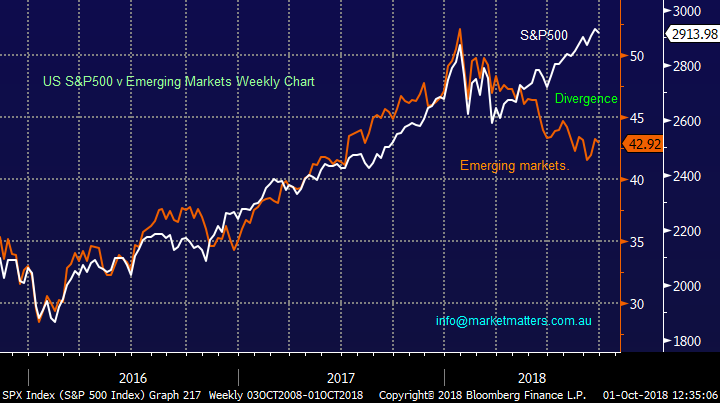
We are currently watching closely the recent significant divergence unfold between US stocks and those of the emerging markets – since April the US S&P500 is up 10% while the emerging markets are down close to 10%. Fund managers are 21% overweight US stocks, the highest level since January 2015, interestingly from where the S&P500 did manage to grind marginally higher before tumbling 15%. On the other side of the equation one of the 2 most crowded trades in the market at present is short emerging markets, a potentially powerful combination.
Note at MM we have exposure to the other most crowded trade – long $US which we discuss later in conjunction with interest rates.
- We have exposure to a narrowing of the divergence between US stocks and emerging markets in the Growth Portfolio via the BBUS and IEM ETF’s but we need some weakness in US stocks before the call feels “on the money”.
US S&P500 v Emerging Markets Chart
1 Should we ditch the banks?
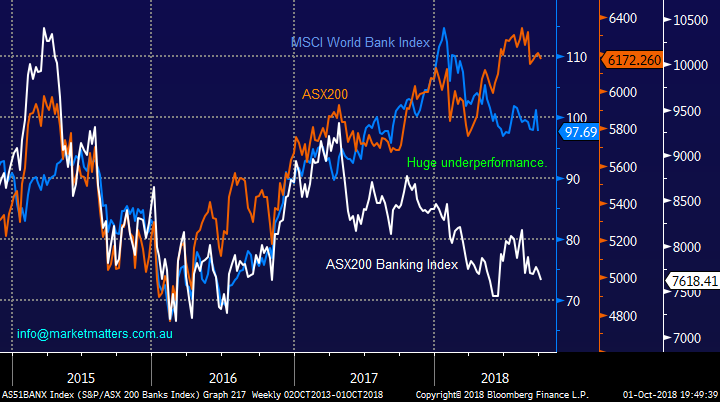
The Australian banking sector has endured an awful time since 2015, the peak of the chase for yield when many investors felt the only way to invest was “buy the banks” – a great example of the optimism / elastic band stretching too far. Since Q1 2015 the Australian banking sector now sits down over -25% while the ASX200 has rallied +3% and the MSCI world banking index is up almost +10% NB this doesn’t take into account dividends which does make our higher yielding banks look slightly better.
We simply believe on a relative performance front we have essentially travelled full circle as the Hayne Royal Banking Commission has tossed the Australian banks well and truly into the naughty corner. Everything is looking bleak for the sector which has pricked up our ears.
MM’s view has taken a 180 degree turn from when we sold our banks back in 2015, today we are sitting overweight the sector in our Growth Portfolio. While our view is the banks have very limited growth over the next few years their attractive yields should be largely sustainable e.g. CBA is paying 6.12% which is fully franked for now at least. Hence they are a buy into weakness but a lighten into strength, or for the sophisticated investor consider selling puts to buy weakness and calls when they rally hard – a strategy we believe will work extremely well.(For those interested in this strategy please email me at Shaw and partners - [email protected])
- MM now believes the Australian banking sector will outperform the ASX200, especially when global equities do experience a decent correction.
ASX200 banking sector v ASX200 Index v MSCI World Banking Index Chart
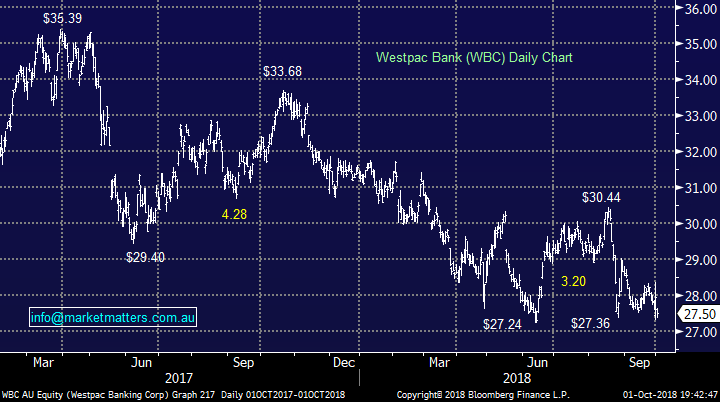
Now moving onto 2 Australian banking stocks to illustrate our current thinking. Westpac (WBC) is the worst performing of the “big 4” banks having fallen -14% over the last year compared to say CBA which is ‘only’ down -6.6%.
Technically we can see WBC correcting to ~$26.50, a new multi-year low but less than 4% below yesterdays close – at this level WBC will be yielding over 7% before we even discuss the future of franking credits.
- MM is likely to increase our WBC position ~$26.50.
Westpac (WBC) Chart
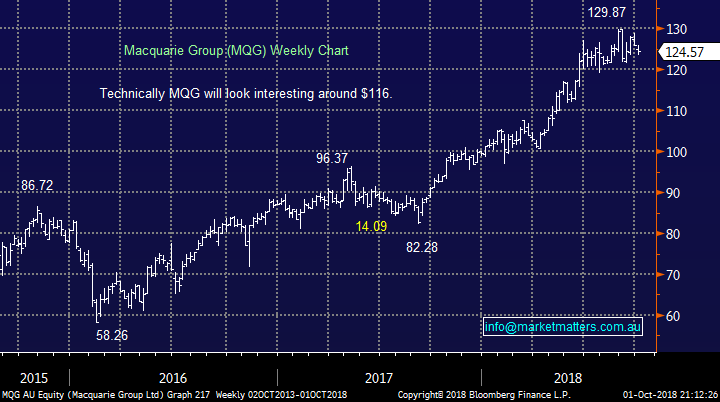
Macquarie Bank (MQG) has a foot in two camps i.e. a bank and diversified financial. However, the “Silver Doughnut” has been a stellar performer on virtually all matrices rallying over 30% over the last 12-months, while we took our profits too early on this one it doesn’t mean we aren’t prepared to buy back in at a higher level – investing is about making $$ / adding value and not ego!
- We would need to see further weakness in MQG, below $116, over 5% lower before we would have interest – and importantly, it would be a shorter term play.
Macquarie Bank (MQG) Chart
2 Keeping our finger on the pulse of interest rates & the Aussie Dollar.
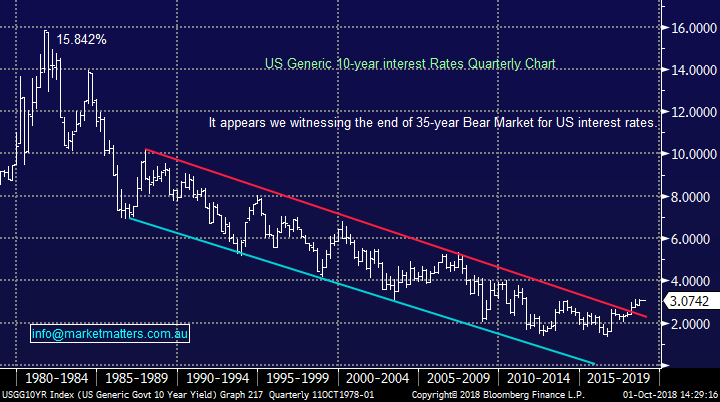
While we do tend to watch markets on a weekly / monthly basis it’s also important to maintain a handle on the bigger picture and this is especially true today when we look at US 10-year bond yields i.e. interest rates. It’s these rising US bond yields that have led to Australian home loan interest rates creeping higher as our local banks borrow ~30% of their funds from offshore hence putting pressure on mortgage rates even when the RBA leaves local interest rates unchanged.
At MM we continue to believe that the 35-year bear market in global bond yields is well and truly over – we witnessed the unprecedented and perfect extreme in emotions following the GFC when bond yields turned negative in some parts of the world i.e. you lend someone $100k and they commit to pay you back $99,500 in 10-years’ time, not an exciting investment to me!
At this stage our initial long term target for 10-year bond yields is close to 6%, double todays level. Hence we have no interest in stocks that are negatively impacted by rising interest rates.
US 10-year bond yields Chart
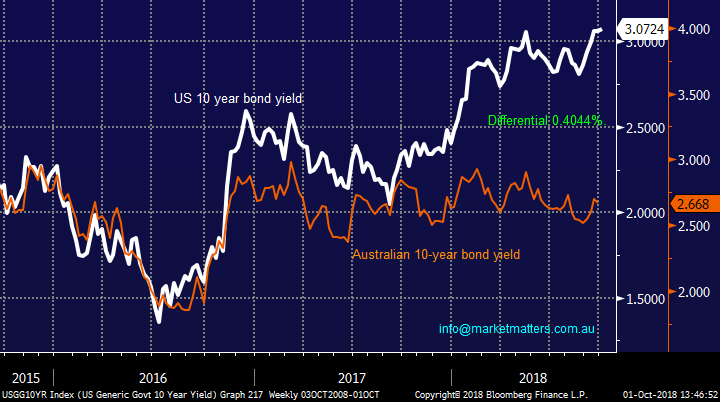
While US bond yields continue to push higher our own are basically going nowhere As the RBA remains concerned around falling housing prices and extremely large household debt levels.
US & Australian 10-year bond yields Chart
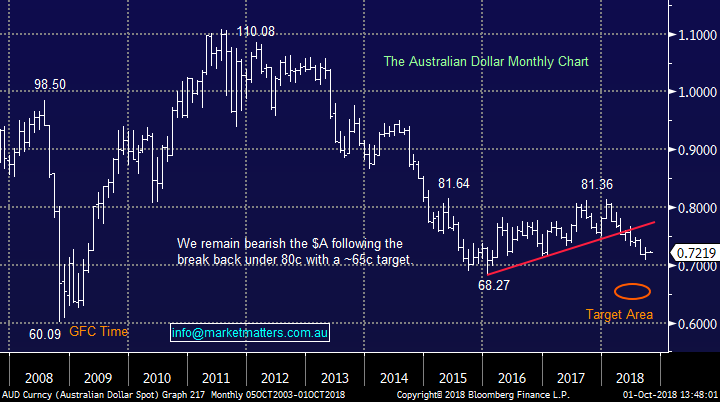
While we remain conscious of the crowd being long $US, we are comfortable with our relatively small 3% $US exposure in the Growth Portfolio, via the Beta Shares $US ETF. It should be noted we believe the $A depreciation is a relatively mature move having already satisfied over 80% of our long-term target – for that reason, investors should be aware that countertrend bounces are likely to become more prevalent.
- Fundamentally we believe the increasing interest rate differential between the US and Australia will maintain the pressure on the $A.
- Technically we remain bearish the $A targeting the 65c area against the $US.
Australian Dollar $A Chart
3 Are CSL & Cochlear the new “ugly sisters” of the ASX200?
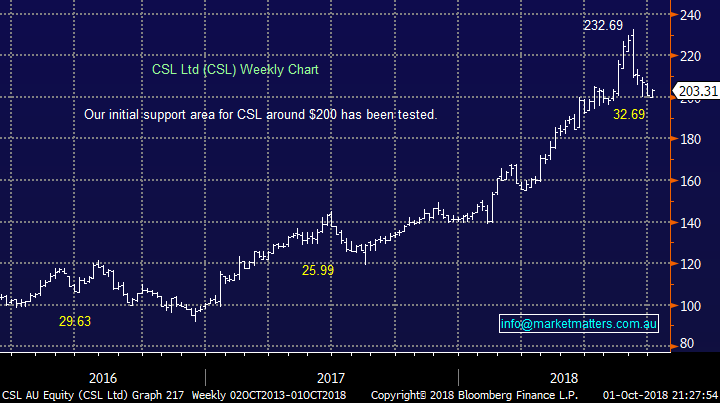
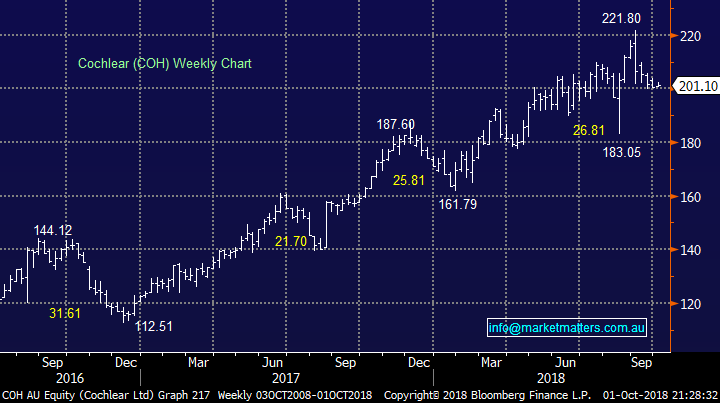
We believe that both CSL and COH are great companies that simply became too expensive as investors chased “growth at any price” (GAAP) as opposed to “growth at a reasonable price” (GARP). Chasing momentum can be dangerous as both CSL and COH have recently experienced decent corrections of -14% and -10% respectively.
MM will consider both stocks into further weakness of ~5% but our “Gut feel’ is they both need a rest on the downside after the last few weeks.
- Currently we like both CSL and COH under $190.
CSL Ltd (CSL) Chart
Cochlear (COH) Chart
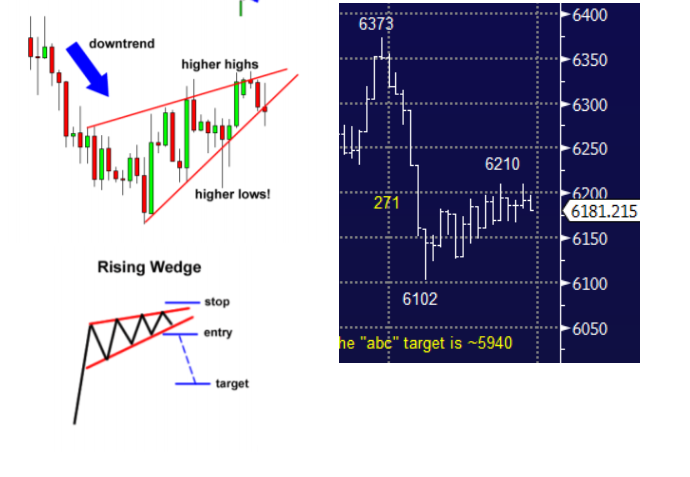
4 Chart Patterns should not be ignored
On Friday morning Denis, MM’s IT / maths guru sent through the below email to one of the team – and I thought it was worth sharing.
“Also, noticed the ASX chart in the morning report. Is it somewhat this pattern???” – Denis Pipic. Considering our short-term view at MM that the ASX200 was headed below 6000 his email didn’t receive a negative response. Chart Patterns are not like reading tea leaves - we believe they are a very valuable tool to evaluate / identify good risk-reward opportunities which coincide with our fundamental opinion.
Rising Wedge Formation
5 International equities
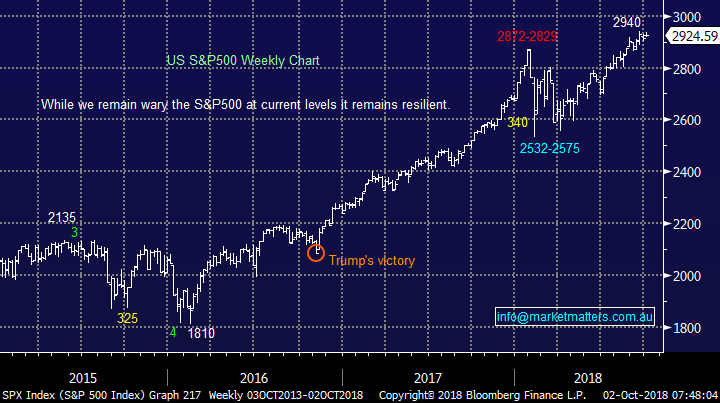
When you look into the details of the new US-Canada-Mexico trade agreement it’s a glorified rebranding of NAFTA but President Trump certainly believes he’s pulled off a coup, now for China but as we’ve been saying for weeks they’re a much bigger fish with a very long time horizon.
Whatever your political leanings it’s impossible not to acknowledge the performance of US stocks since the last US election with the S&P500 up around +40%. The Republican government certainly has been extremely market friendly, just consider the below 2 huge points:
1 Company tax in the US has been cut from 35% to 21% this year while they reduced the personal tax rate more conservatively e.g. the top tax rate fell from 39.6% to 37%.
2 President Trump has aggressively deregulated American business following on from the scaling back of the Dodd-Frank Act i.e. banking, the comprehensive regulatory reductions has been embraced by small to large businesses alike – Australia is receiving the opposite at present with the Hayne Royal Commission likely to cost many businesses millions of dollars.
Obviously there has been other landmark occurrences like North Korea and NAFTA but once China is resolved the question becomes where’s the next sugar hit for equities coming from as markets battle against rising interest rates.
The S&P500 remains within striking distance of its all-time high hence no sell signals are emerging but we are cautious at current levels – long the US market is a crowded trade.
US S&P500 Chart
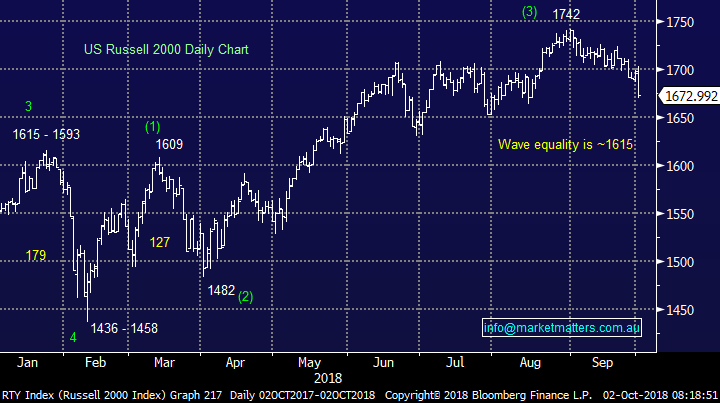
When we look a touch closer at US stocks the picture is not as rosy with the Russell 2000 small cap index, which led the charge higher this year, breaking down – it fell -1.4% last night while the S&P500 rallied +0.36%.
Also, the Russell 3000 only managed to gain +0.15% overnight showing that the broad market is struggling as just a few large stocks do the heavy lifting – historically a bad sign as to a markets internal health.
- MM is initially targeting another 3-4% downside for the Russell 2000 but as we saw last night this may have no impact on the more closely followed indices.
Caution is warranted but it’s not yet time to abandon ship.
US Russell 2000 Chart
Conclusion
- Remain patient and look to accumulate stocks into weakness ideally below 6000
- Cash and caution remain high towards Australian equities, hence the next dip still remains one to buy
Standout technical chart (s) of the week
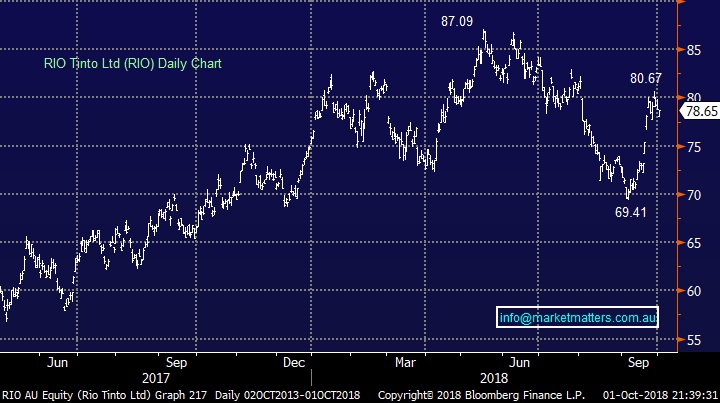
An interesting one for the more active investor / trader that we hold in the MM Growth Portfolio. We have 2 slightly differing views depending on what timeframe is being assessed.
Rio Tinto (RIO)
- Short-term we are buyers under $78 targeting fresh recent highs ~$81, or around 3% higher.
- Medium-term, we are bullish targeting $90 but a second correction from ~$81 back under $78 still looks likely i.e. the stock needs time to chop around to consolidate the recent rally.
RIO Tinto (RIO) Chart
Trading Opportunities on our radar
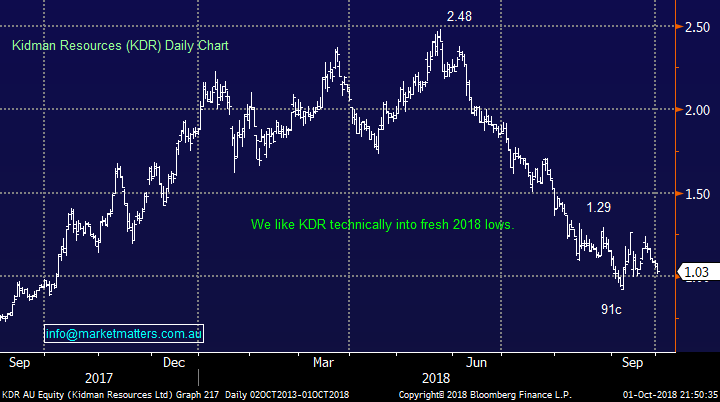
A simple update on last week’s piece following a week’s consolidation by Kidman Resources (KDR). After having dinner with some MM subs last night, this one will be a controversial call – sorry guys!
- Buy KDR into new lows below 90c targeting above $1.20 - excellent risk / reward.
Kidman Resources (KDR) Chart
Investing on our radar
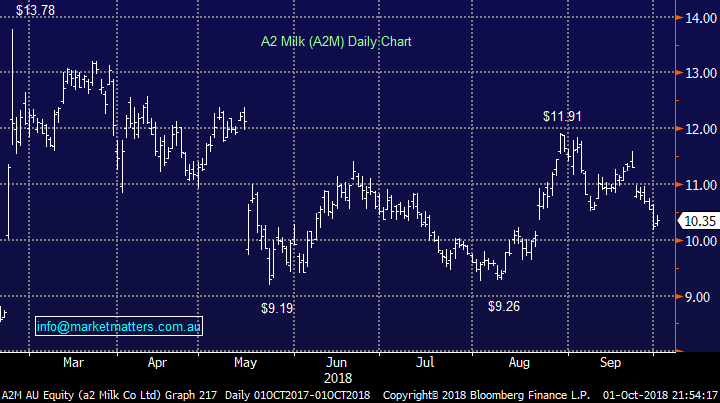
There’s nothing like insider / director selling to take the gloss off a stock. A2 Milk (A2M) has suffered such a fate falling over -8% since the news of CEO Jayne Hrdicka had been a major seller. Combined with A2M being a high valuation / growth stock, an area we are not keen on moving into 2019, expect MM to exit our position in the near future – fighting director selling is a dangerous game.
- MM is looking to exit the second half of our A2M position.
NB This has shown the benefits of scaling in and out of positions i.e. as we sold half our position at $11.40 cutting the balance around here feels ok.
A2 Milk (A2M) Chart
Weekend Chart Pack
The weekend report includes a vast number of charts covering both domestic and international markets, including stock, indices, interest rates, currencies, sectors and more. This is the engine room of our weekend analysis. We encourage subscribers to utilise this resource which is available by clicking below.
Our Holdings
Our positions as of Friday. All past activity can also be viewed on the website through this link
Overnight Market Matters Wrap
· The US equity markets rallied overnight, quite the opposite from Australia’s session yesterday as the late mail NAFTA 2.0, now known as USMCA (United States – Mexico – Canada) was formed.
· Commodities were mixed despite the positive trade read thru from NAFTA 2.0, with base metals and gold slightly mixed, while copper and gold settled lower and zinc and aluminium slightly firmer.
· With Crude Oil rallying overnight, BHP is set to outperform the broader market, up an equivalent of 0.87% in the US from Australia’s previous close
· The December SPI Futures is indicating the ASX 200 to open 6 points higher testing the 6175 level this morning.
· The RBA meets this afternoon at 2.30PM where it is expected no rate change to be announced, currently at 1.50%.
Have a great day!
James & the Market Matters Team
Disclosure
Market Matters may hold stocks mentioned in this report. Subscribers can view a full list of holdings on the website by clicking here. Positions are updated each Friday, or after the session when positions are traded.
Disclaimer
All figures contained from sources believed to be accurate. Market Matters does not make any representation of warranty as to the accuracy of the figures and disclaims any liability resulting from any inaccuracy. Prices as at 02/10/2018
Reports and other documents published on this website and email (‘Reports’) are authored by Market Matters and the reports represent the views of Market Matters. The MarketMatters Report is based on technical analysis of companies, commodities and the market in general. Technical analysis focuses on interpreting charts and other data to determine what the market sentiment about a particular financial product is, or will be. Unlike fundamental analysis, it does not involve a detailed review of the company’s financial position.
The Reports contain general, as opposed to personal, advice. That means they are prepared for multiple distributions without consideration of your investment objectives, financial situation and needs (‘Personal Circumstances’). Accordingly, any advice given is not a recommendation that a particular course of action is suitable for you and the advice is therefore not to be acted on as investment advice. You must assess whether or not any advice is appropriate for your Personal Circumstances before making any investment decisions. You can either make this assessment yourself, or if you require a personal recommendation, you can seek the assistance of a financial advisor. Market Matters or its author(s) accepts no responsibility for any losses or damages resulting from decisions made from or because of information within this publication. Investing and trading in financial products are always risky, so you should do your own research before buying or selling a financial product.
The Reports are published by Market Matters in good faith based on the facts known to it at the time of their preparation and do not purport to contain all relevant information with respect to the financial products to which they relate. Although the Reports are based on information obtained from sources believed to be reliable, Market Matters does not make any representation or warranty that they are accurate, complete or up to date and Market Matters accepts no obligation to correct or update the information or opinions in the Reports. Market Matters may publish content sourced from external content providers.
If you rely on a Report, you do so at your own risk. Past performance is not an indication of future performance. Any projections are estimates only and may not be realised in the future. Except to the extent that liability under any law cannot be excluded, Market Matters disclaims liability for all loss or damage arising as a result of any opinion, advice, recommendation, representation or information expressly or impliedly published in or in relation to this report notwithstanding any error or omission including negligence.


