A decent inflection point is looming for global markets
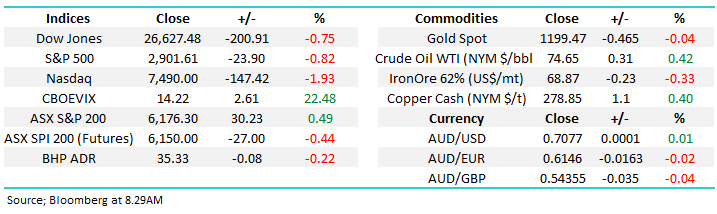
The ASX200 was strong yesterday rallying +0.5% ignoring Hong Kong which tumbled -1.74%, while US & European futures were down around -0.5% - even the Kiwis had a tough day slipping -0.4%. We have a couple of thoughts on why we outperformed yesterday, no great rocket science:
1. The strong rally in global bond yields and US financial stocks gave a strong positive lead to our largest and most influential market sector i.e. financials.
2. Also the heavyweight miners / energy stocks remained strong as the belief in a rampant US economy gathers momentum. Energy / commodities do pretty well in an inflationary environment which is clearly being implied by rising US interest rates
3. The $A tumbling to its lowest level since February 2016 appeared to garner the attention of traders / hedge funds and it smelt to us like people were buying Australian SPI futures and selling the S&P futures, another very stretched elastic band – see second chart today.
The above outperformance could easily last for weeks but if ongoing strong negative influences do continue from overseas markets the ASX200 is unlikely to remain immune forever.
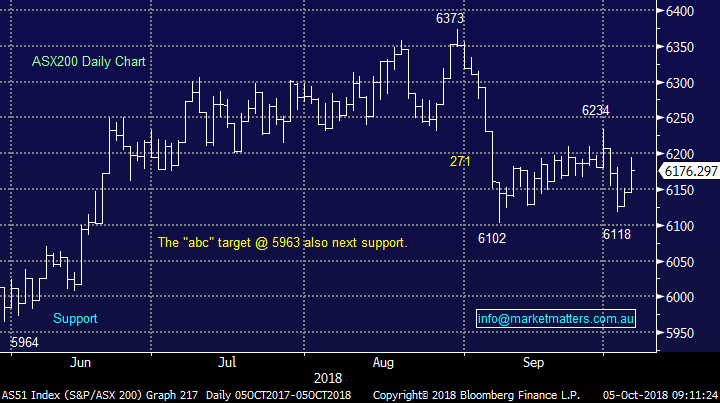
· We remain mildly negative the ASX200 targeting sub 6000, around 3% lower.
Overseas stocks were hit pretty hard overnight with markets repricing risk as bond yields rose to multi-year highs. The biggest casualties were on the tech-based NASDAQ index which fell almost 2% following reports that China infiltrated US companies with hardware hacks. Donald Trump’s tweets today have so far centred on US politics + there was a good one on how well the US stock market has performed v others – nothing on China (yet)!
The SPI futures are pointing to the local market giving back yesterday’s gains – down around ~30pts.
Today’s report is going to look at the inflection point (s) we believe are looming for a number of markets and most importantly how we plan to play it.
When markets are moving towards critical areas we think it’s imperative that MM keeps our subscribers “finger on the pulse” – there’s always twists along the way!
ASX200 Chart
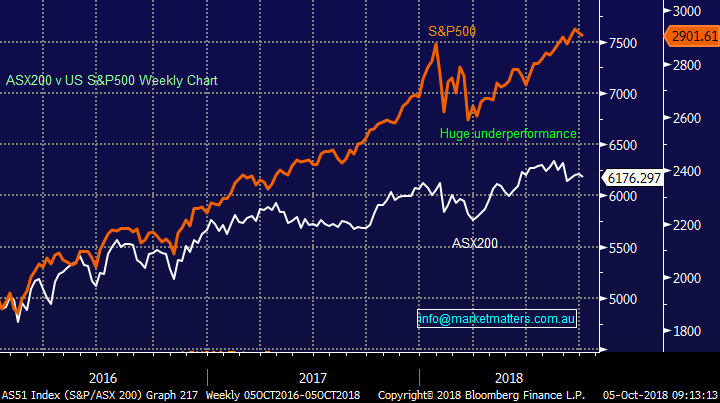
Since the major market swing lows in 2015/6 the respective performance between our index and the US has been very disappointing – again!
The ASX200 has rallied +31.2% while the US S&P500 has soared well over 60% - both before dividends.
Hence it’s easy to comprehend why some traders who have been correctly positioned for such relative performance decided it was time to take some $$ from the table – perhaps they also believe an inflection point is looming.
ASX200 v S&P500 Chart
1 Currencies
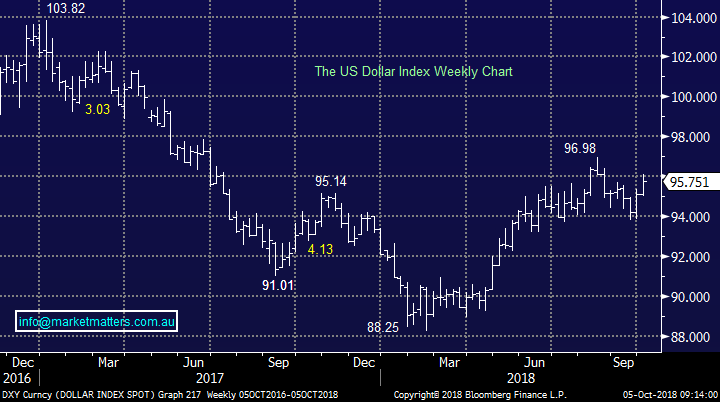
The FX markets are often called the most intelligent of all although we believe they are definitely rivalled by the bond market i.e. interest rates. The accolade to both markets is arguably warranted due to the sheer volume of money that trades between both. Without blowing our trumpet too much, we’ve called the $US very well in 2018 so until further notice we will be using this major market influence as a large part of our macro analysis moving forward, remember back in January within our outlook piece we disagreed with the crowd who were bearish the $US:
“The market has now become bearish the $US – we think that call will prove correct early in 2018 with the US dollar index making fresh 3-year lows but by year end, the dollar index will actually close up for the year.” – MM.
Ideally, we are now looking for a last spike higher in the $US which should create a crescendo of selling in the emerging markets leading to a “ripple effect” around global markets – a view we’ve touched on over recent weeks. Following this rally in the $US our preferred scenario is we see a fairly long period of consolidation which will probably see a correction of ~5% in the $US.
The $A is trading around 70.75 as I type and obviously if / when we get this spike higher in the $US MM will look to take profit on its $US BetaShares ETF position.
Apart from the ETF we are unlikely to invest around the currencies specifically but we will use them as a guide to the direction of markets.
$US Index Chart
2 Bond yields
Suddenly the crowd has jumped on the bond yields are going up view, just read the press over the last 24-hours. When markets get this much consensus coverage its often close to the end of the move.
Another major point from our January outlook piece comes to mind:
“Interest rates have bottomed; the question is how fast do they rise?” – MM.
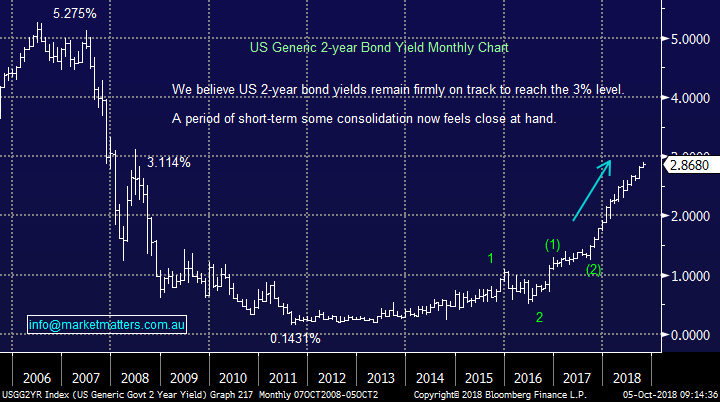
We have been targeting ~3% for the US 2-year bond yield for over 6-months so its important not to get blinded by the press when the milestone is finally approaching fast.
While we continue to believe bond, yields have further to rally we can easily see 6-months choppy price action around this 3% area after the aggressive re-alignment by the market that we’ve received experienced.
No great investing themes here although if I had been “short” interest rate sensitive stocks I would be taking some $$ off the table – potentially an opportunity for some tweaking in our Income Report.
US 2-year bond yields Chart
3 Emerging markets (EEM)
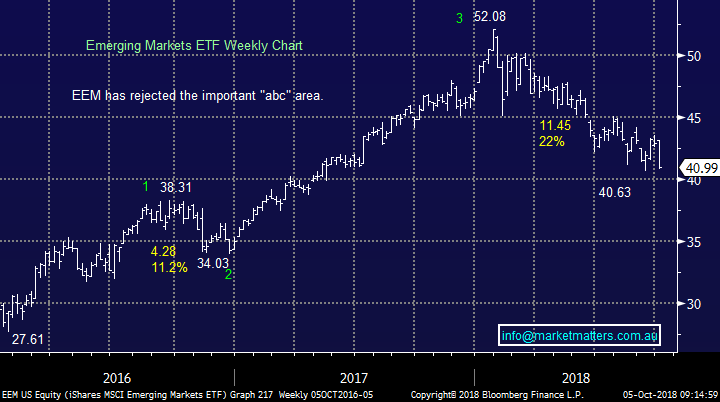
EEM are moving in the opposite direction to the $US primarily because the countries in the developing nations have large debt burdens in US dollars which are become rapidly more painful to service / repay as the greenback rallies. We intend to increase our EEM exposure via the local BetaShares ETF (IEM) into fresh 2018 lows but it’s important to acknowledge we are only looking for a bounce of ~10-15% before we are likely to exit – i.e. this is likely to be a short term position
With China closed this week for Golden Week volumes in the region are lower leading to magnified movements in many indices – this makes it a classic time for market swing highs / lows to be made.
iShares MSCI Emerging markets ETF (EEM) Chart
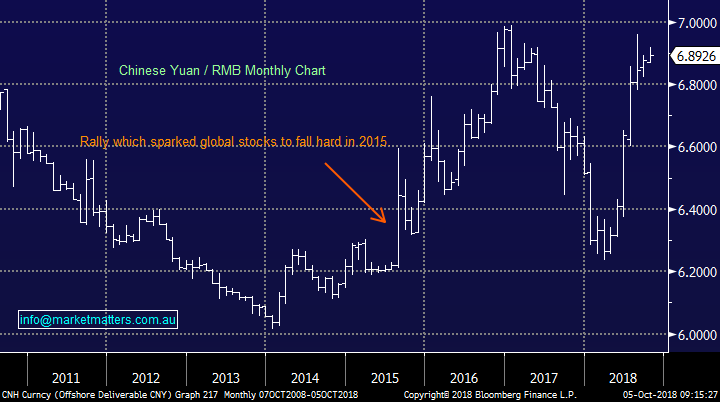
Weakness in the Chinese Yuan has been the undoing of equity markets in the past hence the last few months surge in the $S against the Yuan has concerned many.
A panic spike towards 7 today, or early next week would provide an excellent catalyst for the move we are looking for in many financial markets.
Chinese Yuan Chart
4 Global equities
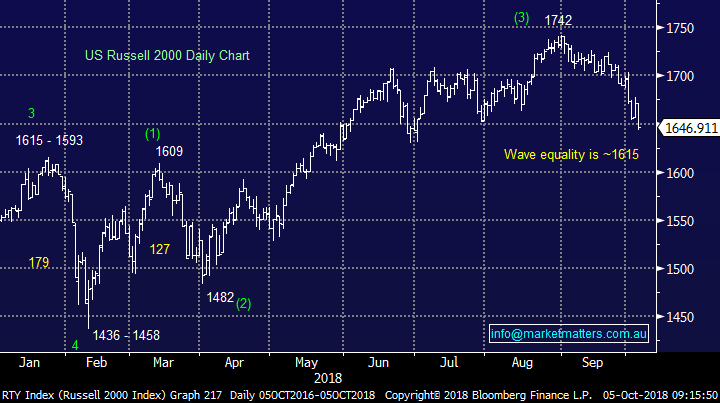
US stocks are slowly but surely following the path we have been expecting although the periods of relative strength between the different US indices has been surprising at times. The Russell 2000 has now corrected -5.7% from its August high with our ~1615 target now only around 2% lower – another potential inflection point.
NB if we see more weakness than expected a close below 1590 will trigger a technical sell signal targeting a 10% drop.
Russell 2000 Chart
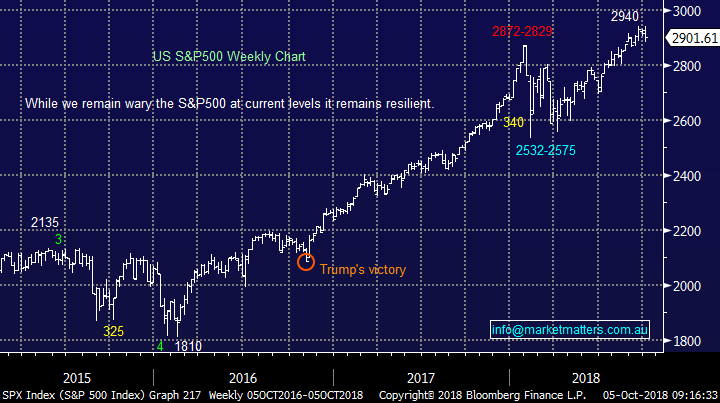
The S&P500 remains extremely resilient to global jitters and we believe it’s become a “safety haven” for many investors, easy to comprehend as money comes out of US bonds pushing interest rates higher. We are currently holding a bearish facing US ETF (BBUS) somewhat frustrating given its been the Russell 2000 in the US that has seen most weakness.
Moving forward we have to decide if we take a loss on this ETF when / if the Russell 2000 hits our target area or we spread off against indices which we believe will outperform into Christmas i.e. if we are correct and the S&P500 has received a “safety bid” then it will probably underperform during any relief rally in risk assets.
US S&P500 Chart
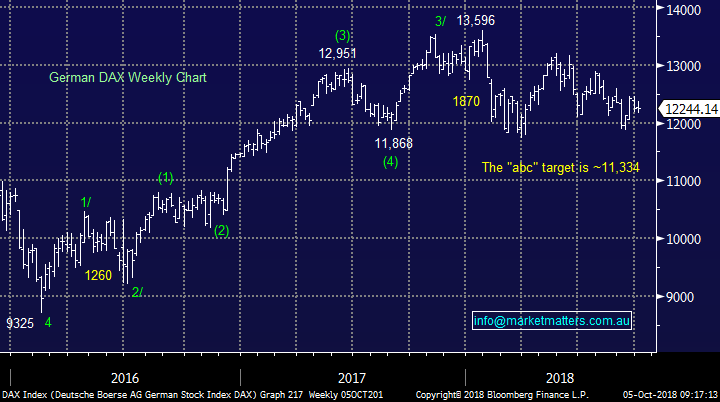
Over recent years the ASX has followed the European indices more closely than the US although they have some internal issues that may challenge this correlation into 2019.
Our ideal target for the German Dax for example is still ~7% lower. This is another index that has significantly underperformed its American peers.
German DAX Chart
5 Local stocks / positions
To consider the stocks / positions its best to simply refer back to our morning report from Wednesday:
Our conclusion on Wednesday was:
- Take profit on our ETF position if we see a sharp 2-3% appreciation in the $US.
- Look to take profit on our BEAR ETF basis the ASX200 around 5960 and increase out long exposure to stocks
- Close the BBUS ETF basis the S&P500 5% lower and / or hold against an increased position in the emerging markets on a spread basis.
- Add to our IEM ETF around the 56 area.
- Add to Westpac around $26.50.
- Add to JHG below $35 and buy CYB below $5.25.
- Buy Macquarie below $116.
- Buy the ASX around $60.
- Buy Oil Search around $8.90 as a short-term trade.
- Buy Cochlear / CSL around $185.
- Add to our RIO below $77.
Conclusion
· We are looking for a decent inflection point probably in the next week:
· A top in the $US, US bond yields, a bottom in emerging markets and many equity markets. Remember, there is significant cash currently sitting on the sidelines.
· NB We do not believe these will be tops / bottoms that will last for years only probably 3-6 months.
Overnight Market Matters Wrap
· The US followed on from Asia’s lead yesterday, with all major indices ending their session in negative territory, with the Nasdaq 100 hit the most, down close to 2%.
· US 10 year bonds are currently yielding 3.20% with Fed Chairman Powell saying rates have a long way to go to get to neutral.
· The US September jobs report will be closely watched tonight. A strong result will likely see yields move higher and could potentially see this sell-off continue.
· Locally, stocks to watch are Wesfarmers (WES) currently in trading halt as they look to disclose the Coles demerger to investors.
· The December SPI Futures is indicating the ASX 200 to open 14 points lower this morning, towards the 6160 level, currently down 0.5% for the week!
Have a great day!
James & the Market Matters Team
Disclosure
Market Matters may hold stocks mentioned in this report. Subscribers can view a full list of holdings on the website by clicking here. Positions are updated each Friday, or after the session when positions are traded.
Disclaimer
All figures contained from sources believed to be accurate. Market Matters does not make any representation of warranty as to the accuracy of the figures and disclaims any liability resulting from any inaccuracy. Prices as at 05/10/2018
Reports and other documents published on this website and email (‘Reports’) are authored by Market Matters and the reports represent the views of Market Matters. The MarketMatters Report is based on technical analysis of companies, commodities and the market in general. Technical analysis focuses on interpreting charts and other data to determine what the market sentiment about a particular financial product is, or will be. Unlike fundamental analysis, it does not involve a detailed review of the company’s financial position.
The Reports contain general, as opposed to personal, advice. That means they are prepared for multiple distributions without consideration of your investment objectives, financial situation and needs (‘Personal Circumstances’). Accordingly, any advice given is not a recommendation that a particular course of action is suitable for you and the advice is therefore not to be acted on as investment advice. You must assess whether or not any advice is appropriate for your Personal Circumstances before making any investment decisions. You can either make this assessment yourself, or if you require a personal recommendation, you can seek the assistance of a financial advisor. Market Matters or its author(s) accepts no responsibility for any losses or damages resulting from decisions made from or because of information within this publication. Investing and trading in financial products are always risky, so you should do your own research before buying or selling a financial product.
The Reports are published by Market Matters in good faith based on the facts known to it at the time of their preparation and do not purport to contain all relevant information with respect to the financial products to which they relate. Although the Reports are based on information obtained from sources believed to be reliable, Market Matters does not make any representation or warranty that they are accurate, complete or up to date and Market Matters accepts no obligation to correct or update the information or opinions in the Reports. Market Matters may publish content sourced from external content providers.
If you rely on a Report, you do so at your own risk. Past performance is not an indication of future performance. Any projections are estimates only and may not be realised in the future. Except to the extent that liability under any law cannot be excluded, Market Matters disclaims liability for all loss or damage arising as a result of any opinion, advice, recommendation, representation or information expressly or impliedly published in or in relation to this report notwithstanding any error or omission including negligence.


