Subscribers questions (PPT, KDR, NAB, URW, FXJ, APT)
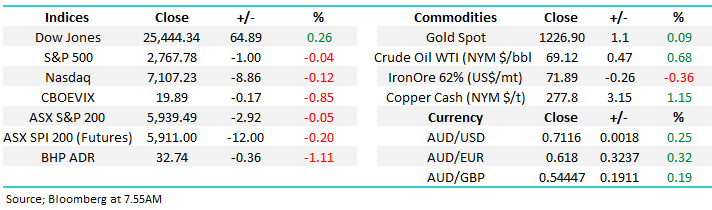
This morning feels likely to be a very real test of the ASX200’s resilience to ongoing negative influences with a number of contributors likely weigh on the local index when the week kicks off:
1 – Courtesy of Wentworth the Liberals have lost their majority reminding market players of the highly likely possibility that Labor will form a new government by next May.
2 – Sydney’s housing auction clearance rates continue to struggle over the weekend with clearance rates sitting around 50%
3 – The US S&P500 index closed around 0.5% lower than when our market players went home on Friday afternoon.
4 – Heavyweight BHP looks set to open over 1% lower following its close on the US ADR market.
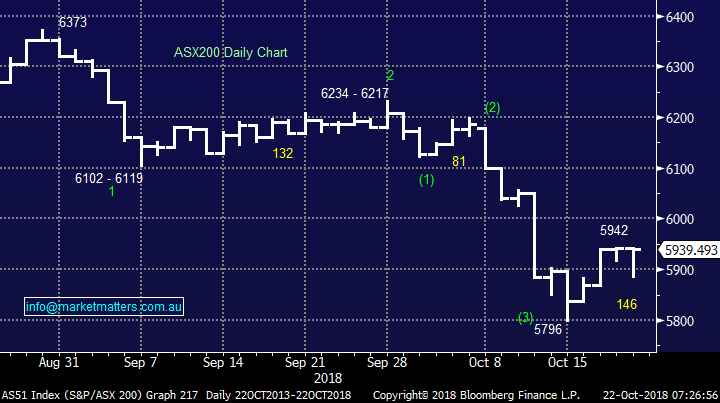
As we said in the Weekend Report the ASX200 has basically come back to fair value but considering the abundance of poor domestic and global economic news, both today and on the horizon, a period of “cheap” valuation feels a strong possibility although we should not get too “greedy” given fund managers have large cash reserves which we think will be deployed into weakness.
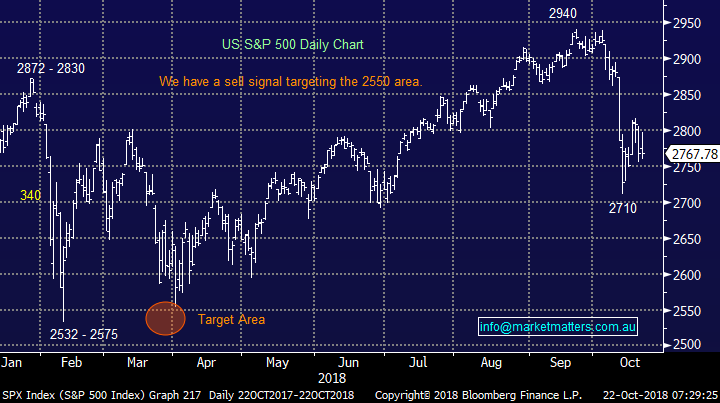
Short-term we are bearish global equities with the US targeting a further 5-7% drop – we continue to believe the ASX200 is close to a period of outperformance.
Thanks again for some more excellent questions which today cover an interesting array of topics.
ASX200 Chart
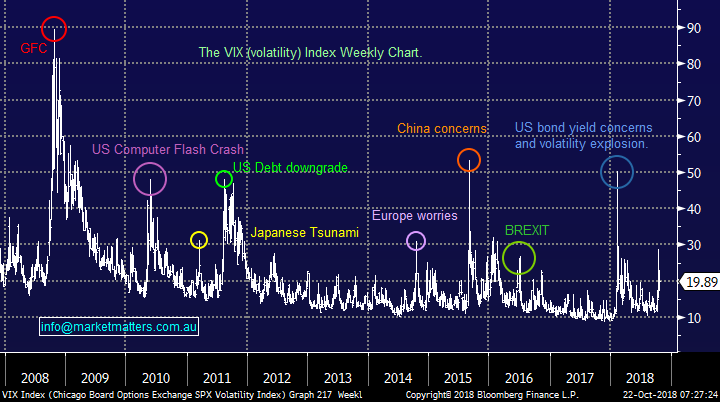
Last week’s consolidation for equity markets didn’t particularly alleviate investors’ fears moving forward - the “Fear Index” may have retreated slightly but there’s certainly remains a strong undertone of concern with the VIX hovering around 20%, well above the average of the last 7-years.
The US Volatility (VIX) / Fear Index Chart
Question 1
“Hi MM, where can l learn more about stops and leverage?” - Many thanks Frank W.
Hi Frank, I will break your question into 2 halves but attack it back to front to how you’ve asked it.
1 Leverage
Leverage can be both an investors best and worst friend, most people engage in leverage on a significant scale on a daily basis through their mortgage.
1 - You buy your house for $1m and put down a 20% deposit. Simply if the prices rallies 10% you are ahead 50% on your initial investment but likewise if it falls 10% your down 50% - ignoring costs obviously.
2 - This is a very topical example of leverage with many Australian property speculators enduring a tough 12-months as they are reminded that property like any other market can fall, as well as rise.
Now when we turn our attention to the stock market there are a number of different forms of leverage including margin lending, CFD’s, some ETF’s, options and futures.
They all work on a similar principle to the above example but with their own characteristics and degrees of actual leverage - we believe they have their place for the sophisticated investor at the correct stages of the economic / stock market cycles but not in today’s market for MM as most of you know.
Interestingly margin loans peaked in Australia just before the GFC at around 250,000 accounts, illustrating perfectly how people get too euphoric at market tops. We noted at the start of the year that margin debt in the US surged by almost $23bn, to a record of just under $666bn – not much fear here and just before US stocks had a swift / dramatic 11.8% correction.
2 Stops
These are a particularly vital part of the traders discipline, especially if leverage is involved.
Simply if you buy CBA today around $68 believing its good value (as we do) but if it falls below say $65 you feel the view is wrong, hence you place a stop at $65 and your broker will automatically sell your CBA position at the best levels once CBA breaks under $65 i.e. a stop in this case for a loss. Alternatively, assuming CBA rallies we can follow the position up with a trailing stop loss. The level of this can be the sticking point. I’ve run strategies with a 10% trailing stop, 2x or 3x the average true range (ATR) of a stock over the last month and many other variables. Stops are important if running a mechanical trading system – we run a discretionary system and only apply stops on short term positions.
Thinking more about the realty of stops and going back to the mortgage example earlier, if the house falls by over 20% then the owner is actually negative on a marked to market basis. With property if you keep paying your mortgage the banks are likely to leave you alone but not so with stock market leverage. With stocks, as the market moves against a leveraged position in most cases investors will need to make up “their buffer” to protect the lender hence if the move accelerates we get forced selling when people run out of cash as was rumoured in China last week. Panic forced selling often creates opportunity, when the bloods flowing on the streets, just like earlier this year.
US S&P500 Chart
Question 2
“Hi James, can you squeeze this one for Monday? PPT looked to be a safe investment when I bought them but have gone pear shape during the last month or so. Do they have a future or should one bight the bullet and jettison them?” Nick A.
Hi Nick,
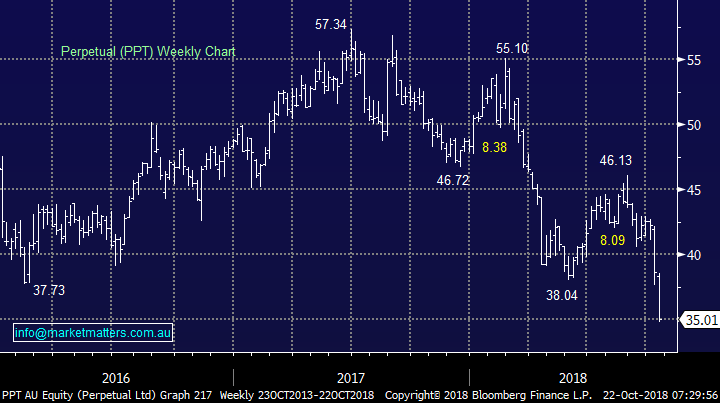
PPT is a very tricky one, we also currently hold the stock in our MM Income Portfolio – while the stocks not expensive trading on an estimated P/E for 2019 of 12x while yielding close to 8% fully franked it’s certainly unpopular. The problem is all about FUM (funds under management) with PPT having 6 consecutive quarters of net outflows – the last quarter showed FUM at $30.2bn, down almost 2%. Clearly the share price needs these outflows to stop before it can regain ground.
UBS have been one of the most bearish brokers on the stock and their valuation is now sitting at $41.50, 20% above Fridays close. At this stage the downside momentum is poor and we envisage the stock will rotate around $33 and $36 until the next FUM update.
Perpetual Ltd (PPT) Chart
Question 3
“Hi James and team, as an 'investor' I try to make sense of macro and other events in order to make informed choices and guide me on where best to invest. Compliments to you and the team, you unscramble a lot of the economic noise and offer actionable advice through the MM alerts and reports. Perhaps you can offer some thoughts or clarity on why inflation in the US is not really escalating at a much faster pace? Since the GFC, unemployment in the US has gone 10% to 3.7%. Since Trump, US unemployment has gone from 4.8% to 3.7% .... one would think that with 1% more people employed, lower taxes, fiscal stimulus, etc, their inflation would be pumping?? This is probably not a Monday question however I'd be keen to hear your thoughts. Have a great weekend.” - Regards, Jan
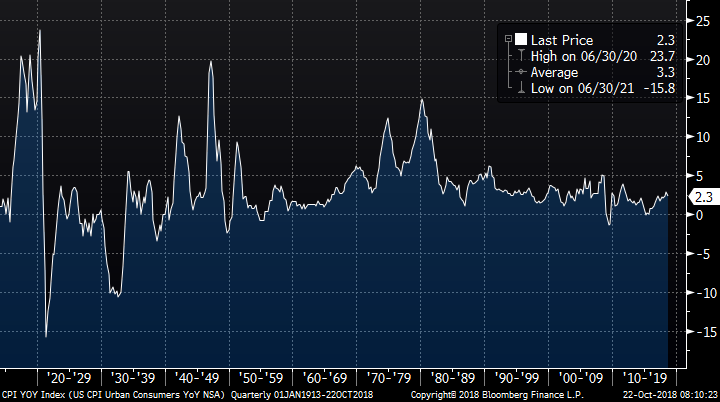
Hi Jan – this is an incredibly important topic and one worth covering on a Monday, although it is a large / influential subject. You’re absolutely correct in your questioning of why inflation has not ticked up sooner / faster, the majority of ingredients are there for it, and ultimately it could be something that re-rails the markets in a big way moving forward. Strong employment, lower taxes and bigger profits are all inflationary as is de-globalisation i.e. trade wars, tariffs, make America great again etc.
US Inflation – Year on Year Growth running at 2.3% versus 3.3% long term average
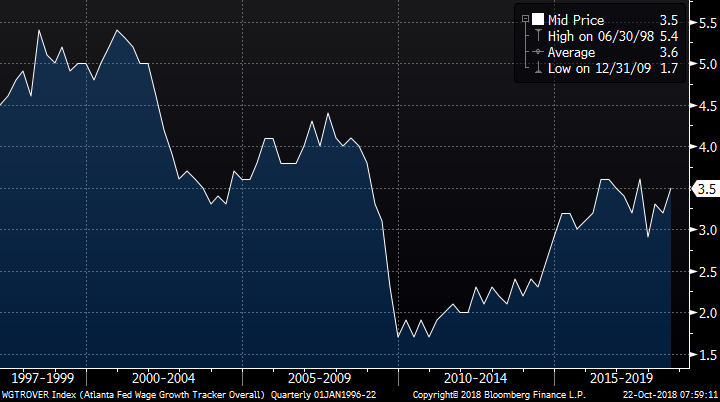
The first place to start is wage growth; unemployment is important however the main driver for inflation is wage growth which has risen, but not by a significant amount. Average wage growth in the US sits at 3.6% over time and the current print is 3.5% so pretty much in line with the average.
US Wage Growth – sitting at 3.5% versus long term average of 3.6%
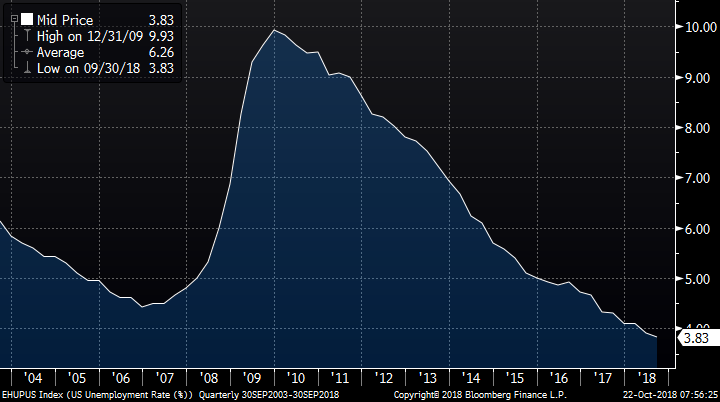
Given the huge amount of jobs growth in the US which has brought the unemployment rate down to 3.83% versus the average of 6.26%, you’d think that wage growth should be running above average, but it’s not. To me, wage growth is the real indicator of how well an employment market / economy is doing. If it’s as tight as the employment numbers suggest then employers will need to pay employees more to attract and retain them. That’s only just started to happen with the latest large scale example coming from Amazon, which increased the minimum wage for 250,000 of its employees + 100,000 of its seasonal workers to $15. The rate previously depended on location however ranged from around $10 an hour up to about $13.50 with the median Amazon employee earning just under $28,500 pa. There’s other examples from other big employers in America so ultimately I think wage growth will tick higher and that will be inflationary.
US Unemployment Rate 3.83% versus long term average of 6.26%
Trump’s America First policies should also be inflationary. If we look at the globalisation of the world in orange (thanks to a chart from Martin Crabb), and inflation in black over a long period of time, the conclusion is that globalisation is deflationary, which makes sense. If it’s cheaper to produce stuff in another country and trade policies support it, then that’s what happens and ultimately the consumer benefits with lower prices.
A measure of world Globalisation (orange) and inflation Black
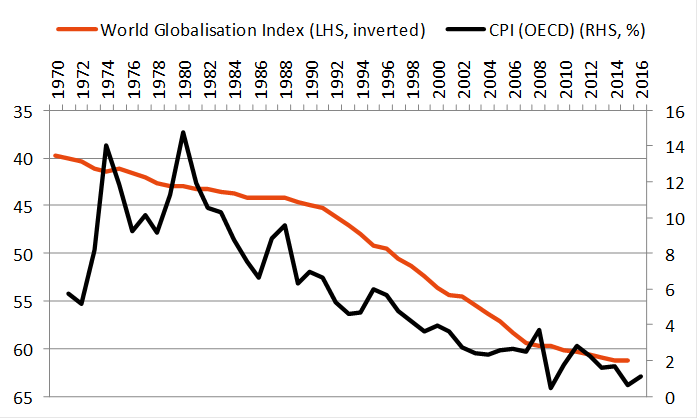
Source; Shaw and Partners
However, tariffs, protectionism and the like means that it will cost more to produce stuff and prices will go up. If globalisation is deflationary, it should be the case that de-globalisation is inflationary. Ultimately, inflation will tick higher and that will lead to higher global interest rates, however wage growth is the pre-cursor to it all. Signs that wages are growing above average will be the key to it all. In an inflationary environment, commodities tend to do well while interest rate sensitive stocks like infrastructure don’t.
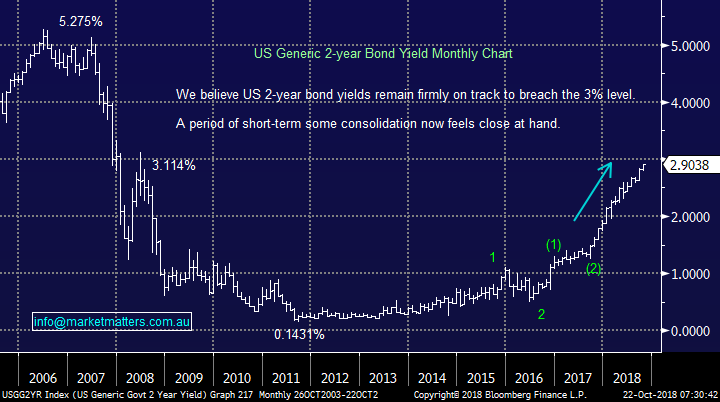
The US 2 year bond yield is a leading indicator of inflation expectations, and its going up.
US 2-year Bond Rate Chart
Question 4
“Hi James, would you be able to explain and illustrate your view that KDR looks to be a good technical buy? I can’t see the technical rationale about this, so hoping you can explain.” - With thanks, Paul H.
Hi Paul,
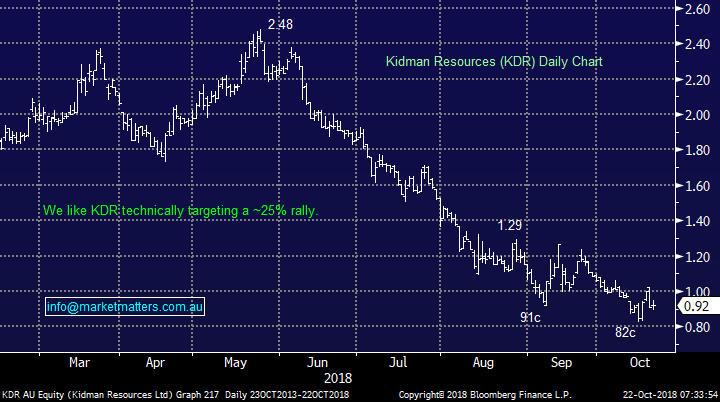
So far so good, we thought the market would bounce the first time it dipped under $1, albeit an extremely brief 30% rally to test the previous $1.30 resistance area.
We now see a Neutral Pattern between 91c and $1.29 (normal distribution of trading activity), the drop below 91c and close back above 96c triggers a technical buy signal using Steidlmayer Distribution / Market Profile.
MM is bullish technically targeting another ~30% rally into Christmas.
Kidman Resources (KDR) Chart
Question 5
“Hi Guys. I understand the banks are going through hell with the royal commission however I have held NAB for some time and MM is still holding a fair number of banks in the portfolio. NAB however seems to be going nowhere. Can you give me some insight on this stock please?” Wayne S.
Hi Wayne,
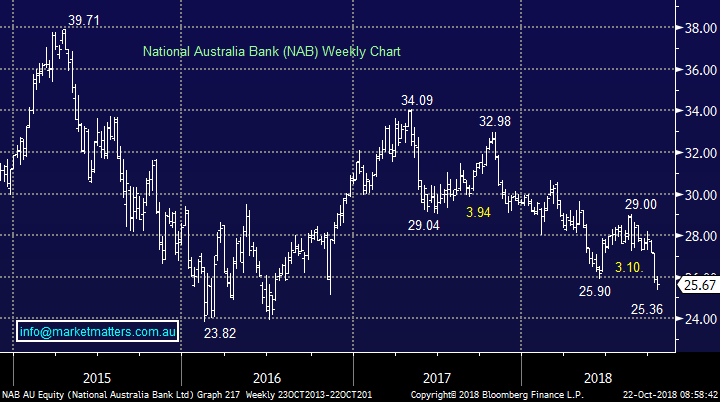
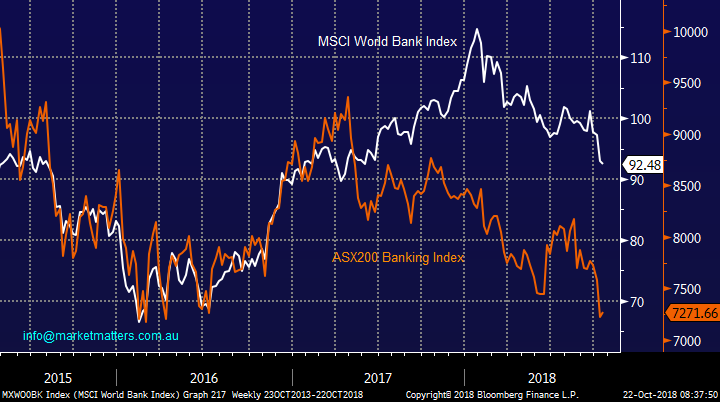
NAB is in the same “naughty corner” as the whole banking sector due to a combination of the Banking Royal Commission and the rising concerns around Australian housing prices. The Australian banks have massively underperformed their global peers due to the above 2 major concerns but we believe the elastic band is being stretched too far i.e. the correction is the banks is much closer to its end than the beginning.
NAB is now trading on an Est. valuation P/E of 12.2x for 2018 while yielding 7.7% fully franked, with its next dividend due in a few weeks. We feel that holding the banks over the next few years and reinvesting the dividends into the currently depressed prices will look ok down the track but if / when NAB again rallies over $3-4 we are likely to lighten our position.
National Australia Bank (NAB) Chart
MSCI World Banking v Australian Banking index Chart
Question 6
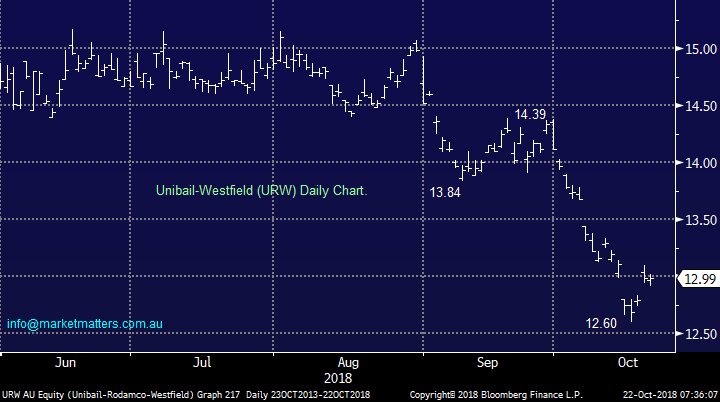
“Hi Team, Any thoughts on Unibail-Rodamco-Westfield (URW). It has been hit pretty hard and was wondering if the stock is on your radar? One of your competition has it as a Buy under $15, another has its fair value at $14.30.” - Regards Errol K.
Hi Errol,
In an rising interest rate / inflation environment we are not keen on the real estate sector in general, especially for the Growth Portfolio. Here’s a look at current broker calls on the stock.
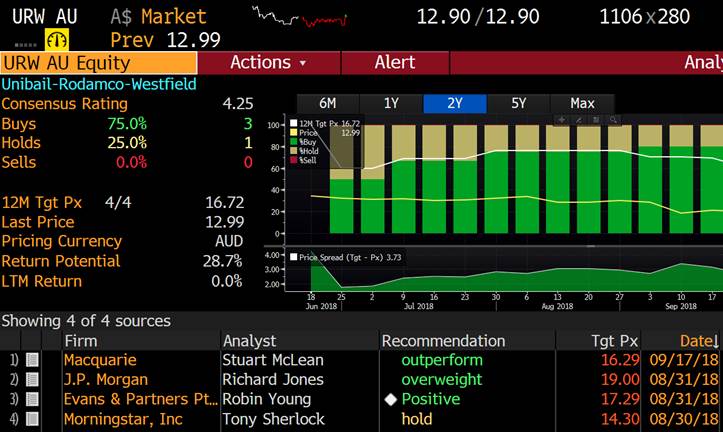
At this stage we would be observers of URW.
Unibail-Rodamco-Westfield (URW) Chart
Question 7
“Do you have any view or comment on IPO: Hearts & Minds” - Thanks Wally L.
Hi Wally,
We had Chris Cuffe, Matthew Grounds, Guy Fowler & Rory Lucas in last week running through the concept. Essentially, the listed investment company will take the best ideas from the Hearts and Minds conference and invest in them while donating the management fees to a range of charities. The concept of some of the top local stock pickers of the last decade running a fund for charity plus of course many rich listers feels good. The new $500 million listed investment company lists on the stock exchange on November 21. From what I hear, demand has been strong for it.
Question 8
“Good morning James + team, would like to ask a question around Fairfax Limited, given the sell-off between Domain, Nine and Fairfax due to last Friday’s trading update. What’s your view in general with the merger process about to begin but from a technical picture, would you hold onto the shares post the merger been completed or cut loss and move onto other opportunities.” Thanks & regards, Tianlei.
Hi Tianlei,
The decline started with Domain as it fell as much as 16% to its lowest on record after saying revenue in the first 15 weeks of FY19 was down 1%. Fairfax then fell -12% and Nine -17%. Fairfax owns ~45% of Domain and earlier this year agreed to a merger with Nine Entertainment – clearly, the fate of these companies are now heavily linked.
The technical picture is very average, our target for FXJ is 10-15% lower.
Fairfax (FXJ) Chart
Question 9
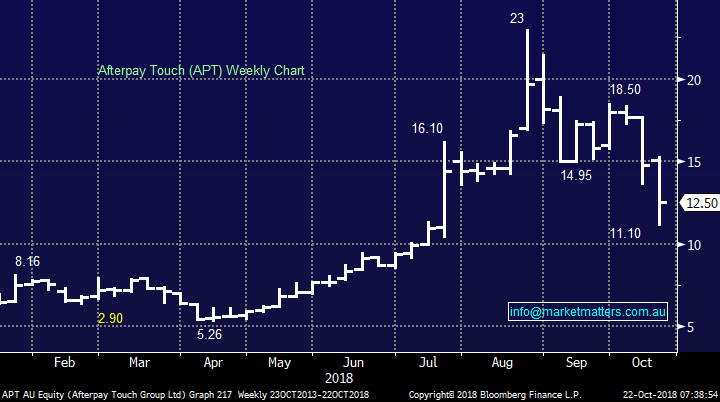
"The main talking point of yesterday was Afterpay Touch (APT) which tumbled 25% in an hour following an aggressively titled story in the Sydney Morning Herald: "Afterpay, payday lenders and 'debt vultures' to face Senate inquiry" - SMH Unfortunately, it makes sense to us, just imagine the uproar if the “big 4” banks came out with similar products (s) to encourage debt in the primarily younger demographic. We’ve consistently been of the opinion that tighter regulation on this sector would eventuate, and that now seems more likely . While we’ve missed upside in the stock / sector, it simply felt wrong.
Hi James, Could you please clarify your above statement on APT as I must be missing something. Why would you think that APT is encouraging spending in the younger demographic or any demographic any more than when the Bank's give customers credit cards to purchase at exorbitant interest rates on the entire balance and allow them to make minimum payments?? I know they go through some credit checks no more than they do with APT on small CC balances. Surely a $300 purchase on APT with 4 equal payments at no interest is a better deal?? Am I missing something? I would certainly encourage my children to buy with APT as opposed to a CC so long as they can afford it? If they miss a payment with APT then they get charged $10 with a total limit of $68 (I think from memory) and cannot use APT again until bill is settled! If they did the same purchase on CC then they would only pay off the minimum balance taking them approx 29 years to pay off, still being charged over 20% interest on ALL outstanding balances. If they missed a payment they can still continue to use the CC for some time still racking up costs. Who is ripping off who here? Could please clarify what I am getting wrong." - Many thanks Terry
Hi Terry – thanks for the topical question.
The APT business is a good one, the growth has been phenomenal however our concern is that if the sector gets regulated more rigorously (which seems likely) and full blown credit checking is put in place, then AfterPay has the most work to do and the most to lose from the change.
The APT business has done so well as it’s a simple product, something that you’ve highlighted well, plus the liability on the purchaser is limited. However, it takes less than 1 minute on a smart phone (I have done it) to sign up to AfterPay with no credit checks. That in itself promotes impulse buying on credit and the operation targets the younger demographic – two aspects we believe the regulator will focus on. In terms of applying for and receiving a credit card this takes a minimum of days and involves more rigorous credit checking. Z1P is another in the sector that provides credit for more highly valued purchases and they do more rigorous credit checking. That process has had a negative impact on their growth relative to APT’s. In short, we simply think the sector is ripe for regulation, whether or not APT is better or worse than having a credit card is hard to comment on as each user is different.
Aterpay Touch (APT) Chart
Overnight Market Matters Wrap
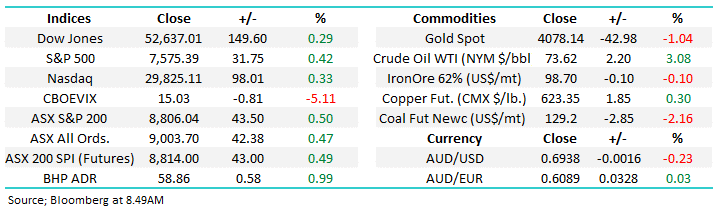
· A quiet session in the US last Friday, with the Dow being the only index in the green, whilst the broader S&P 500 ended only a point lower from its previous close.
· The quarterly earnings season has kicked off strongly with over 80% of the 15% of S&P 500 companies reporting so far, ahead of expectations. American Express, PayPal and Skechers were among those companies that rallied strongly on Friday trading in the wake of their strong quarterly earnings.
· Commodity markets were little changed with gold steady, oil and copper slightly firmer and iron ore a little weaker. BHP is expected to underperform the broader market, after ending its US session down and equivalent of 1.11% from Australia’s previous close.
· The December SPI Futures is indicating the ASX 200 to open 11 points lower towards the 5930 level this morning.
Have a great day!
James & the Market Matters Team
Disclosure
Market Matters may hold stocks mentioned in this report. Subscribers can view a full list of holdings on the website by clicking here. Positions are updated each Friday, or after the session when positions are traded.
Disclaimer
All figures contained from sources believed to be accurate. Market Matters does not make any representation of warranty as to the accuracy of the figures and disclaims any liability resulting from any inaccuracy. Prices as at 22/10/2018
Reports and other documents published on this website and email (‘Reports’) are authored by Market Matters and the reports represent the views of Market Matters. The MarketMatters Report is based on technical analysis of companies, commodities and the market in general. Technical analysis focuses on interpreting charts and other data to determine what the market sentiment about a particular financial product is, or will be. Unlike fundamental analysis, it does not involve a detailed review of the company’s financial position.
The Reports contain general, as opposed to personal, advice. That means they are prepared for multiple distributions without consideration of your investment objectives, financial situation and needs (‘Personal Circumstances’). Accordingly, any advice given is not a recommendation that a particular course of action is suitable for you and the advice is therefore not to be acted on as investment advice. You must assess whether or not any advice is appropriate for your Personal Circumstances before making any investment decisions. You can either make this assessment yourself, or if you require a personal recommendation, you can seek the assistance of a financial advisor. Market Matters or its author(s) accepts no responsibility for any losses or damages resulting from decisions made from or because of information within this publication. Investing and trading in financial products are always risky, so you should do your own research before buying or selling a financial product.
The Reports are published by Market Matters in good faith based on the facts known to it at the time of their preparation and do not purport to contain all relevant information with respect to the financial products to which they relate. Although the Reports are based on information obtained from sources believed to be reliable, Market Matters does not make any representation or warranty that they are accurate, complete or up to date and Market Matters accepts no obligation to correct or update the information or opinions in the Reports. Market Matters may publish content sourced from external content providers.
If you rely on a Report, you do so at your own risk. Past performance is not an indication of future performance. Any projections are estimates only and may not be realised in the future. Except to the extent that liability under any law cannot be excluded, Market Matters disclaims liability for all loss or damage arising as a result of any opinion, advice, recommendation, representation or information expressly or impliedly published in or in relation to this report notwithstanding any error or omission including negligence.