Is the Fed raising rates too hard too fast for the global economy?
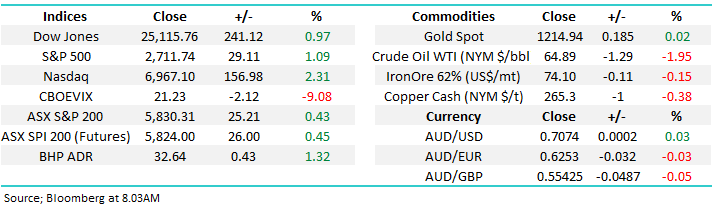
The ASX200 enjoyed another strong day as its said goodbye & good riddance to a very volatile / painful October i.e. down over 500-poiunts / -7.9%. It actually took some typical end of month shenanigans at 4pm yesterday to take the index on the day from slightly in the red to a respectful +25-point close – those buyers will be happy with the rally by overseas markets.
Although the banks have found some noticeable backbone over the last few days the resources have been putting a dampener on the markets recovery as they slip lower, even while the market recovers. If they can catch a “bid tone” my recovery target of the 5900 area may even prove to be a touch conservative – with BHP rallying over 1% on the US ADR market plus they’ve just announced the detail of a $10.4bn capital management program which includes an off-market buy-back, similar in structure to RIO’s recent deal plus a big special dividend with the balance. While this is not a surprise to the market, it has come sooner than the market had assumed so should be supportive of BHP from here.
MM remains mildly bullish the ASX200 short-term targeting the 5900 area – ideally just above.
Overnight US / Europe equity markets rallied strongly giving investors their best 2 days gains since February, sentiment was led by Facebook following an excellent result while both Netflix and eBay rallied over 5% as we saw a distinct return to favour for the high risk / growth stocks i.e. the Dow was up 1% compared to the NASDAQ which surged +2.3%.
The Fear Index (VIX) crumbled over 9% overnight as calm returned to markets almost as fast as it left – investing’s a fickle game at times!
Today’s report is going to revisit the Feds interest rate policy which many, including President Trump, blamed for the markets demise in October.
ASX200 Chart
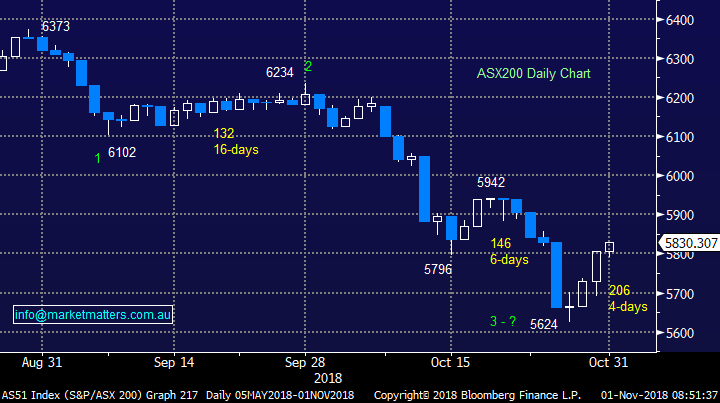
October saw the ASX200 fall 709-points / 11.2% at one stage before managing to regain 30% of the losses, definitely a tough month on the desk!
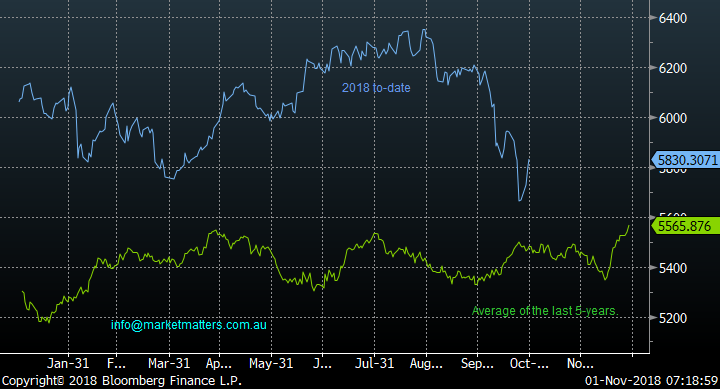
This year certainly has not been following its usual seasonal path e.g. over the last decade the average return for October is up just under +1%, not down aggressively. When we look at the below seasonality chart of the last 5-years it’s clear that 2018 is not your typical years, 2 things come to mind:
1 – Is the year different because the longest bull market in history has come to an end?
2 – November is usually the second weakest month of the year, falling on average just under 2% over the last decade, as many of the large caps trade ex-dividend. Will this November follow suit and compound the years losses?
However, while October is generally a positive month, and November a weak one, the times when weakness has prevailed in October, November has been a positive month in all instances since 1994 except during the GFC. At this stage we anticipate early November will see the ASX200 continue to climb “the wall of worry”
Following ANZ’s solid result yesterday plus how cheap the sector is already trading courtesy of the royal commission & falling house prices MM believes this influential sector will help the Australian market outperform moving forward in periods of global equity weakness.
ASX200 Seasonality Chart
The Fed
The volatility in October was sparked in at least part by concerns the Fed would become too aggressive raising interest rates moving forward and subsequently derailing global growth and the general post GFC recovery.
We believe, like most people, that this is the key to both the overall market’s direction in 2019/2020 and where investors should be invested from a sector perspective.
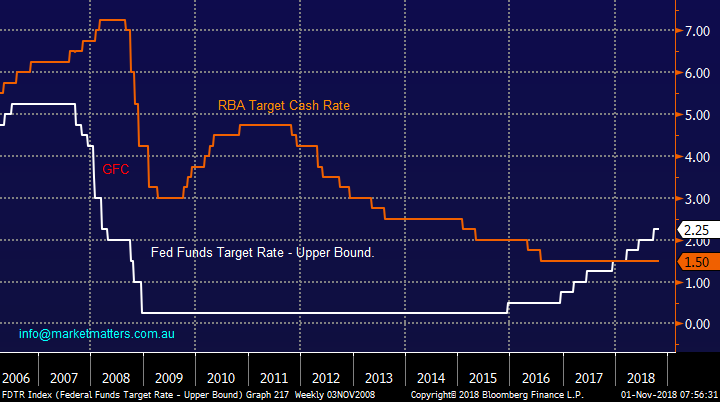
The Fed’s been hiking interest rates now for 3-years as the US economy positively booms whereas the RBA has been sitting on its hands maintaining interest rates at all-time lows of 1.5% – this inactivity locally illustrates both the lack of confidence the RBA has in our economy and explains why the $A has been steadily depreciating. I’m part of a business group in Manly and this morning’s meeting with representation from a good cross section of the Aussie economy highlighted why interest rates locally will stay lower for longer. Our economy is simply not enjoying the same momentum as the US.
In the US, the Fed theoretically has 2 primary jobs:
1 – To control inflation which remains around 2% so all’s good there.
2 - Maintain low unemployment which is also tracking nicely.
Hence in our opinion unless we see some broadsides hitting global economies like further significant escalation of the US – China trade war that impacts global growth, the Fed will follow its laid out path for normalising interest rates i.e. raising again in December and 3 more times in 2019 although the market is doubting the third at present.
We believe it’s naive to not to consider risk to global growth moving forward, especially when many growth equities / markets are trading on the expensive side of the ledger.
Hence we have no interest in growth stocks when they trade above their average valuation of the last 3-years, it simply makes no sense when we consider the risks moving forward – see yesterday’s report.
The RBA and Feds interest rate settings Chart
Overnight global growth came back into vogue following a strong report by Facebook sending the tech based NASDAQ up an impressive +2.3% – what sectors are in vogue is changing faster than fashion magazines at present, it’s more like the weather.
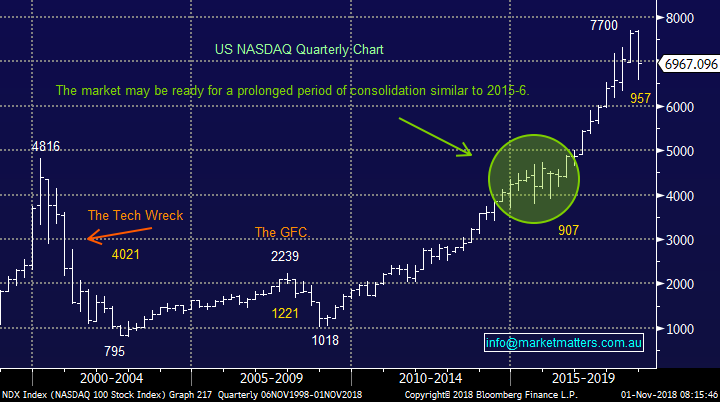
Remember our long-term view for the NASDAQ – we are looking for a few years consolidation between 6000 and 8000, in other words it’s time to take profits into strength and buying excessive weakness BUT more importantly don’t be suckered by human emotion which will have you doing the complete opposite!
The NASDAQ has basically doubled since the selloff / consolidation in 2015/6, our “call” is nothing outlandish just another rest period after significant gains but it’s likely to provide more volatility and 10-20% market swings over the next few years.
US NASDAQ Index Chart
This Fridays unemployment data in the US could see US average hourly earnings up +3% year on year which will probably cement the Feds path, unlikely in our opinion to be embraced by stocks.
The market and President Trump would love a more dovish (less aggressive on raising interest rates) stance but we feel it’s unlikely at this stage.
Let’s keep things simple, usually the best way:
1 - The problem with this reporting season in the US has been earnings forecasts moving forward but not because of interest rates it’s the import costs / tariffs that’s been concerning business I.e. US – China trade war.
2 - Even if markets / economies haven’t yet topped most people acknowledge we are late in the cycle hence anything that pressures margins is a big issue when stocks are expensive - wage gains and tariffs increased costs which has fuelled at least part of this pullback.
3 – A stronger $US dollar caused by rising rates has certainly not helped US competitiveness on the ground, another fact not lost on Donald Trump.
Easy money is becoming a distant memory and US earnings certainly will not grow as fast as they have this year (tax cuts have played into this), any risks to global growth / expansion is very concerning to parts of the stock market.
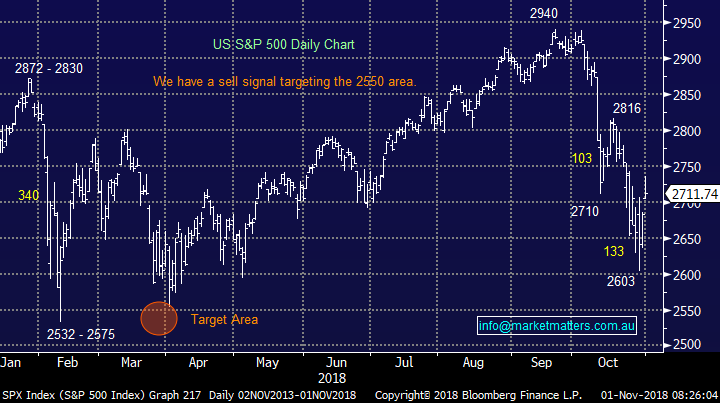
As we said earlier MM believes this remains a very dangerous time for “GARP” investors – growth at any price.
US S&P500 Index Chart
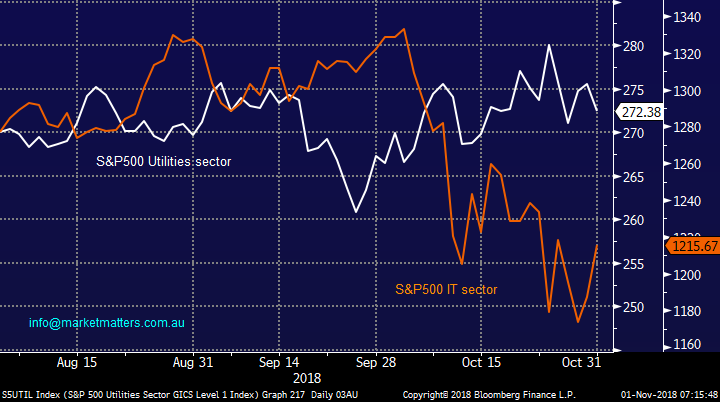
The panic that hit US markets in October can be illustrated by the comparison of the interest sensitive Utilities Sector and the growth based IT Sector.
Rising interest rates should hurt utilities but they are regarded as relatively safe / stable and hence a better place to hide than growth based IT stocks.
As we said yesterday growth has largely outperformed for a decade, a correction of this will take more than a few weeks of panic to realign.
S&P500 Utilities v IT sector Chart
Conclusion
We are now mildly bullish stocks, at least in the short-term but the “easy money” from the bounce we believe is behind us.
MM continues to believe that the high valuation / growth stocks are vulnerable moving forward.
Overseas Indices
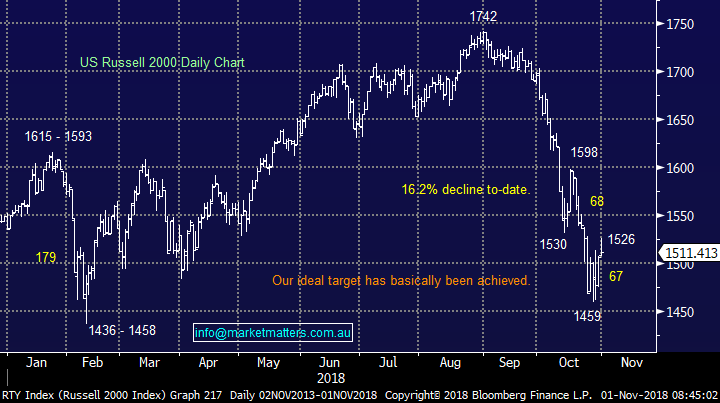
The US Russell 2000 has now satisfied our downside bearish targets switching us to a more neutral stance, we need to see a close back above 1530 to expect further gains short-term.
US Russell 2000 Chart
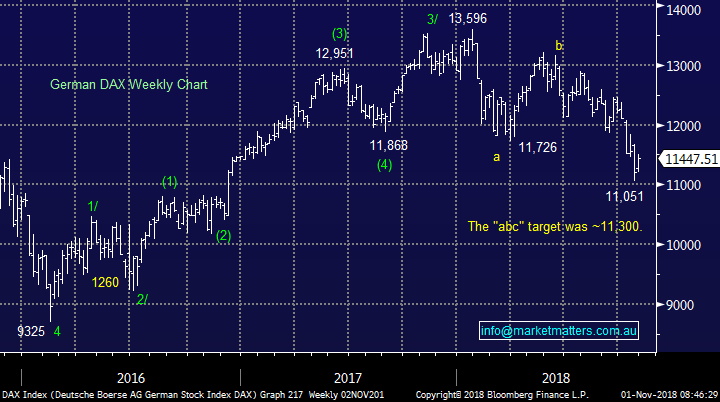
European indices are now also neutral with the German DAX hitting our target area which has been in play since January.
German DAX Chart
Overnight Market Matters Wrap
· The equity markets ended the month of October on a high as investors took advantage one of the weakest months in a number of years to seek out value, especially among the leading technology shares.
· Consequently, the tech heavy Nasdaq 100 rallied 2.31%, after stronger than expected earnings from Facebook (FB.US) boosted sentiment, and the shares jumped close to 4%. Both the Dow and S&P 500 rallied around 1% on the back of a broad market rally.
· Despite the rally, October has been a gruelling month for investors with all three major indices having one of their worst months in years, with the broader S&P 500 off 7.28%, erasing over US$2 trillion off the market value.
· The December SPI Futures is indicating the ASX 200 to start the month 15 points higher towards 5845 this morning.
Have a great day!
James & the Market Matters Team
Disclosure
Market Matters may hold stocks mentioned in this report. Subscribers can view a full list of holdings on the website by clicking here. Positions are updated each Friday, or after the session when positions are traded.
Disclaimer
All figures contained from sources believed to be accurate. Market Matters does not make any representation of warranty as to the accuracy of the figures and disclaims any liability resulting from any inaccuracy. Prices as at 1/11/2018
Reports and other documents published on this website and email (‘Reports’) are authored by Market Matters and the reports represent the views of Market Matters. The MarketMatters Report is based on technical analysis of companies, commodities and the market in general. Technical analysis focuses on interpreting charts and other data to determine what the market sentiment about a particular financial product is, or will be. Unlike fundamental analysis, it does not involve a detailed review of the company’s financial position.
The Reports contain general, as opposed to personal, advice. That means they are prepared for multiple distributions without consideration of your investment objectives, financial situation and needs (‘Personal Circumstances’). Accordingly, any advice given is not a recommendation that a particular course of action is suitable for you and the advice is therefore not to be acted on as investment advice. You must assess whether or not any advice is appropriate for your Personal Circumstances before making any investment decisions. You can either make this assessment yourself, or if you require a personal recommendation, you can seek the assistance of a financial advisor. Market Matters or its author(s) accepts no responsibility for any losses or damages resulting from decisions made from or because of information within this publication. Investing and trading in financial products are always risky, so you should do your own research before buying or selling a financial product.
The Reports are published by Market Matters in good faith based on the facts known to it at the time of their preparation and do not purport to contain all relevant information with respect to the financial products to which they relate. Although the Reports are based on information obtained from sources believed to be reliable, Market Matters does not make any representation or warranty that they are accurate, complete or up to date and Market Matters accepts no obligation to correct or update the information or opinions in the Reports. Market Matters may publish content sourced from external content providers.
If you rely on a Report, you do so at your own risk. Past performance is not an indication of future performance. Any projections are estimates only and may not be realised in the future. Except to the extent that liability under any law cannot be excluded, Market Matters disclaims liability for all loss or damage arising as a result of any opinion, advice, recommendation, representation or information expressly or impliedly published in or in relation to this report notwithstanding any error or omission including negligence.