Casting our eyes over the small end of town (IFN, EHE, SIG, SYR, TGR)
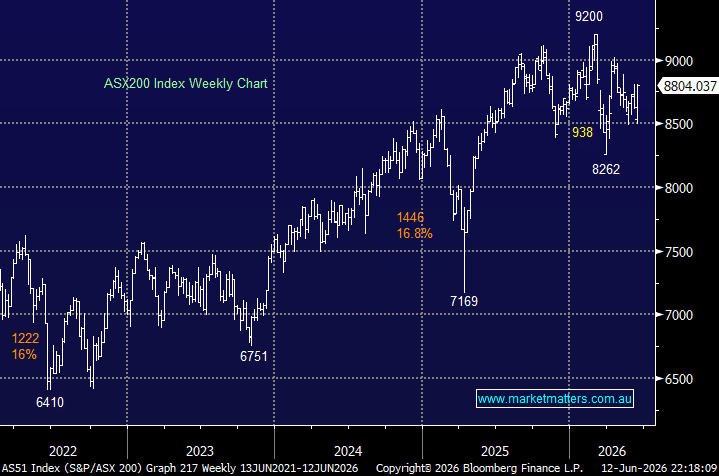
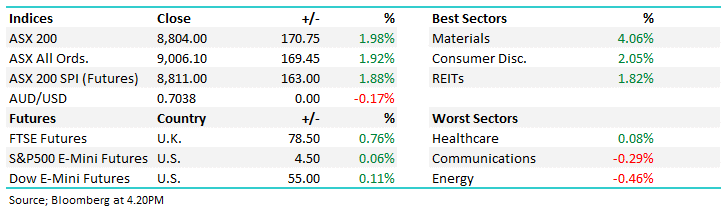
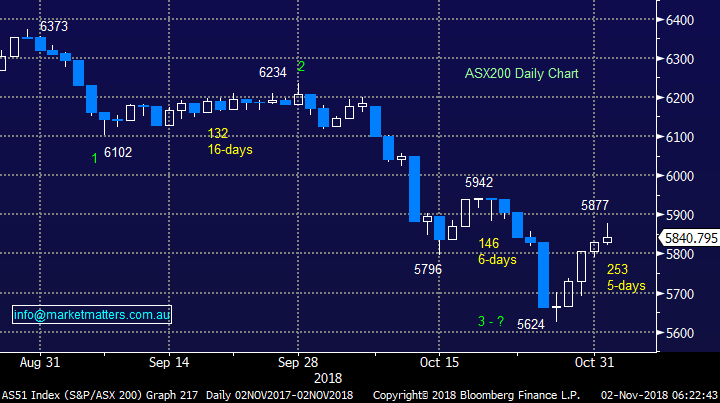
The ASX200 had a choppy day on Thursday failing to embrace the positive news from both BHP and NAB, the index only closed up 10-points with yet again the gains materialising in the “match” after 4pm. However we didn’t expect much more from local stocks who have rallied on average over 50-points a day over the last 5 trading days, its simply time for a rest.
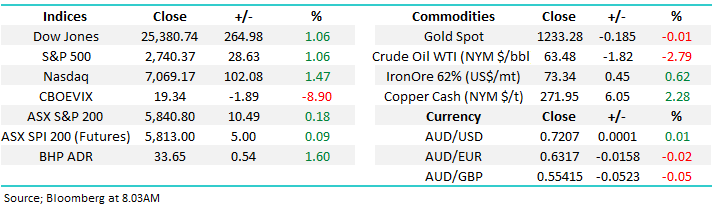
The resources sector may finally have found its bottom after a tough few months, copper bounced +2.4% overnight following increased optimism around US – China trade talks, this should trigger some strength in the resources sector this morning - we purchased nickel producer Western Areas around $2.20 earlier in the week and it’s encouraging to see the stock already rally over 5% from its lows, a weekly close above $2.35 will look excellent.
Additionally an almost 1% fall in the $US index shows investors have become calmer around the seismic issue of a full scale trade war.
MM remains mildly bullish the ASX200 short-term ideally now targeting the 5925 area – only 1.5% higher.
Overnight US stocks again rallied strongly with most US indices bouncing just over 1%, our initial target area for the S&P500 is now just over 2% above this mornings close. Mr Trump on Twitter overnight helped to support stocks … Just had a long and very good conversation with President Xi Jinping of China. We talked about many subjects, with a heavy emphasis on Trade. Those discussions are moving along nicely with meetings being scheduled at the G-20 in Argentina. Also had good discussion on North Korea!
The SPI futures are pointing to a flat open by local stocks although BHP looks set to rally 2%, regaining half of the gains it surrendered during yesterday’s intra-day drift lower.
Today’s report is going to look at the bottom 20% of the ASX200 by market cap, a subject we will probably cover over in 3-4 reports over the next 10-days on relatively quiet days. The logic is simple, opportunities are often overlooked in smaller stocks and at least one of these is likely to have a cracking 2019!
Hopefully we are correct for the balance of 2018 as WSA is 5th smallest stock in the ASX200 with a market cap of only $727m following its 45% correction. Also the 4th smallest stock in Australia’s major index is under a take-over offer i.e. there are gems in the smaller end of town.
ASX200 Chart
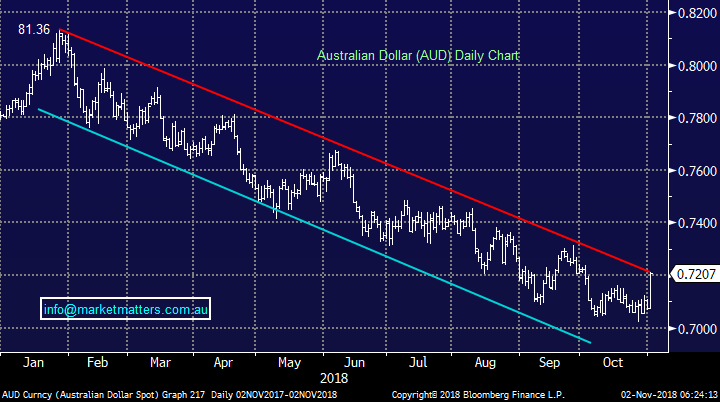
Australian Dollar $A 72.10.
I started writing this report last night when the $A was trading almost 1% lower but the opinion remains intact but will a little less impact.
The $A has endured a tough 2018 so far but a few glimmers of hope have emerged:
1 – Yesterday Australia’s monthly trade surplus surged to $3bn this month courtesy of strong resources exports.
2 – In fact overall the economic data out of Australia continues to hold firm with the exception of housing prices.
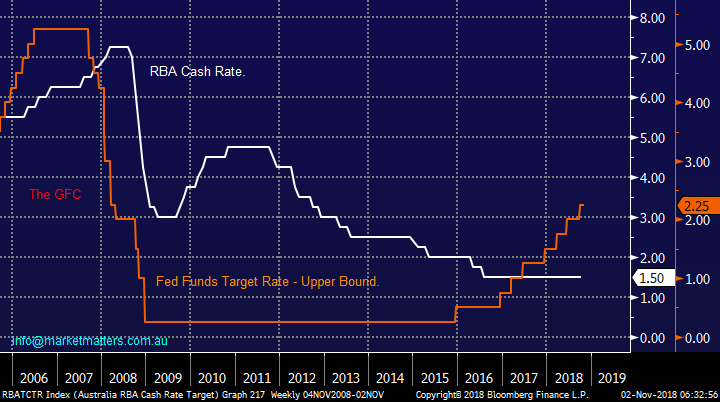
3 - The market is factoring in 3-4 rate hikes by the Fed by the start of 2020 and zero by the RBA – in our opinion the risks here are supportive of the $A.
4 – The market feels bearish the $A across the board with the interest rate differential between Australia and the US justifying investors holding funds in $US BUT when things become too obvious respective positions usually become “too crowded and vulnerable”.
When we combine all of the above together a “short squeeze in the $A” towards the 73-74c area feels a strong possibility.
Hence $US earners may have a relatively tough few weeks / months – potentially not great news for our positions in QBE, CSL, Aristocrat (ALL) and Cochlear (COH).
Australian Dollar Chart
THE RBA and Fed cash rates Chart
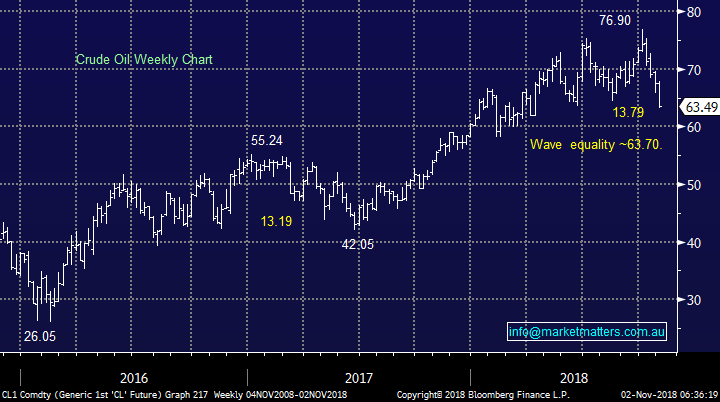
Crude Oil $US63.50 (December contract)
MM has been bearish crude oil for the past few weeks targeting sub $US64 – we’ve now had an 18% correction in under 5-weeks changing our stance:
1 – MM is now neutral crude oil and would no longer advocate a short / sold position.
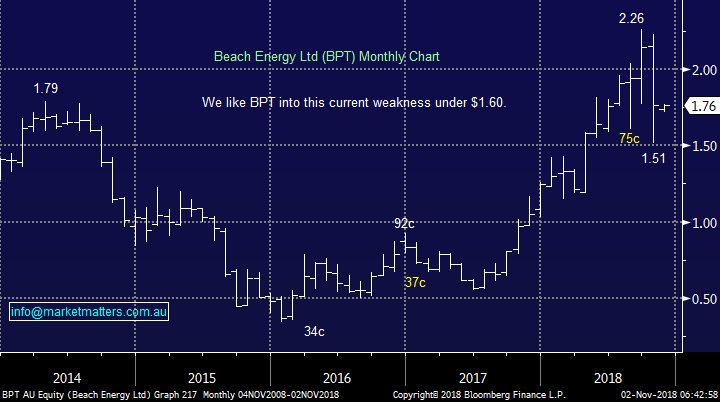
2 – We are considering taking a position in the sector through Beach Petroleum (BPT) or potentially ‘paying up’ for BHP - there’s nothing not to like in yesterday’s announcement.
Crude Oil Chart
Beach Energy (BPT) Chart
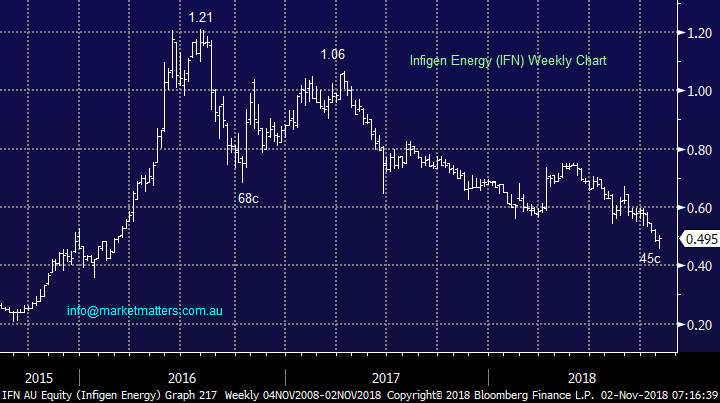
1 Infigen Energy (IFN) 49.5c
IFN is currently the smallest stock in the ASX200 with a market cap of $564m. The companies a developer / operator of renewable energy
Unfortunately the stock has fallen by more than 50% over the last few years as the business has delivered weak earnings and looks to be buying growth with cheap debt (for now).
IFN is now trading on an Est P/E of 11x for 2019 which is not challenging and it’s probably finally offering investors some value below 50c. We love the concept of renewable energy but as a business IFN has not operated successfully for shareholders.
Technically / fundamentally we are neutral IFN.
Infigen Energy (IFN) Chart
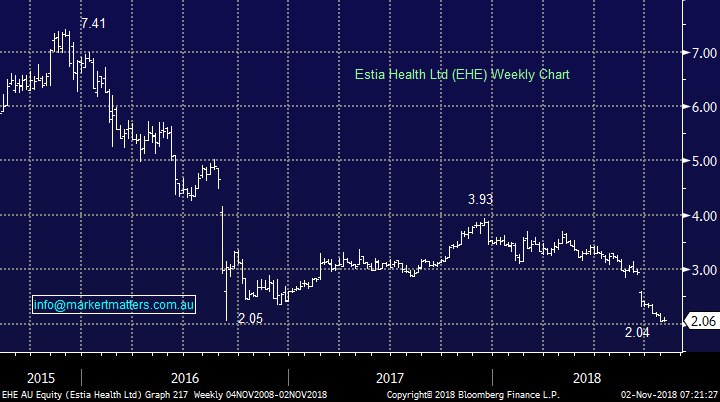
2 Estia Health (EHE) $2.06
EHE is now the second smallest stock in the ASX200 with a market cap of $618m following the stocks 70% demise since 2015. Aged care stocks have been in the news recently for all the wrong reasons but phoenix’s can rise from the ashes of bad news, is this the time?
On the 9th of last night Prime Minister Scott Morrison announced the terms of reference into an Aged Care Quality and Safety commission. We know from the banks et al this is highly unlikely to be good news. The sectors likely to be on the end of some pretty damming negative publicity moving forward which in turn may create better opportunities in the stock / sector.
EHE is relatively cheap from a valuation perspective but they can easily get much cheaper courtesy of the commission, a 1% drop off in occupancy has been forecasted to hurt EHE’s bottom line by almost 10%!
Technically EHE is on support but there are no buy signals currently in sight.
MM will consider EHE if it suffers a spike on news below $2, risk / reward around $2 is too hard.
Estia Health (EHE) Chart
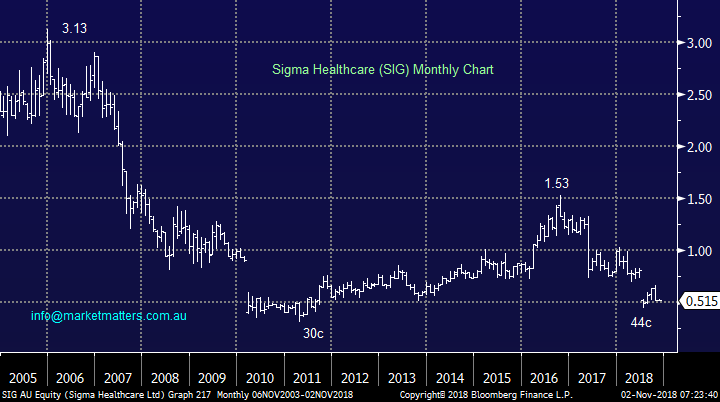
3 Sigma Health (SIG) 51.5c
SIG is now the third smallest stock in the ASX200 with a market cap of $667m having endured a similar share price demise to EHE. The pharmacy chain operator was again smacked back in September following the release of disappointing half year results with a number of negatives including one-off redundancy and restructure $$’s.
The loss of agreement to supply Chemist Warehouse to EBOS Group is set to make next year no easier. We don’t believe SIG shares represent good value moving forward – it’s a trading, not investing stock until further notice.
Technically it looks a short term buy around 40c but an eventual test / break of 30c would not surprise.
MM has no interest in SIG.
Sigma Health (SIG) Chart
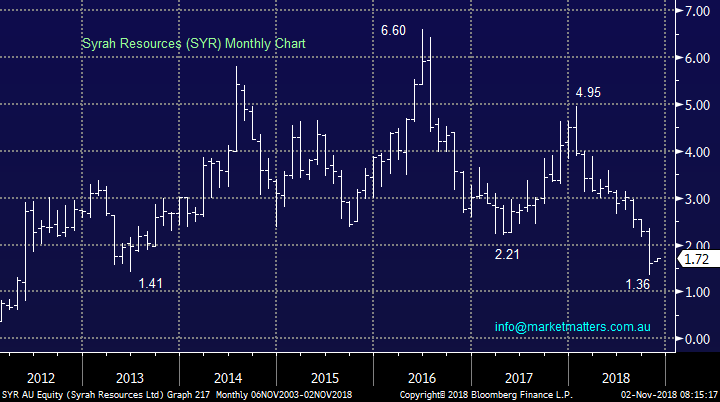
4 Syrah Resources (SYR) $1.72
Graphite producer SYR is now the seventh smallest stock in the ASX200 with a market cap of $781m. This is good timing following the stocks 7.5% pop higher yesterday as risk was bought across the market.
Unfortunately the “easy money” for SYR, like Kidman Resources (KDR), is probably now behind us leaving us neutral.
SYR is the 4th most shorted stock in the index with over 15% of its shares sold short, although this volume has been falling into the stock’s recent sell-off i.e. hedge fund managers are taking profits.
Technically we are neutral SYR but at least it’s a recent positive to see an insider buying some stock, albeit in a small way, as opposed to dumping it as was the case with Kogan.
MM is neutral SYR.
Syrah Resources (SYR) Chart
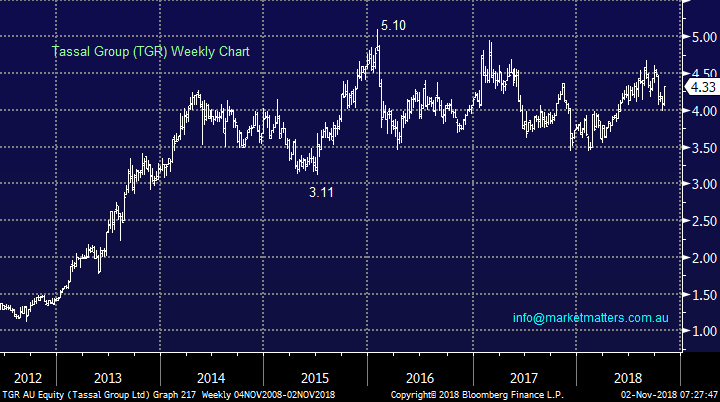
5 Tassal Group (TGR) $4.33
TGR is now the eight smallest stock in the ASX200 with a market cap of $797m and unlike the previous 4 it’s been a strong performer over recent years – we question does value remain?
The Tasmanian salmon farmer recently announced a $50.3m adjusted profit as the company grows organically + acquisition as prawn farming becomes the next mountain to climb.
The stock appears to be trading on a fair valuation while it yields 3.7% fully franked, to us this is a solid story / stock but not exciting at todays prices.
Technically we are neutral / bullish TGR with stops on longs now below $3.95.
MM is neutral / positive TGR at current levels but do not see attractive enough risk / reward to become a buyer.
Tassal Group (TGR) Chart
Conclusion
We remain mildly bullish stocks from current levels but looking to reduce our market exposure into strength, ideally ~5925 for the ASX200.
Unfortunately we found no exciting opportunities amongst the 5 stocks looked at today
Overseas Indices
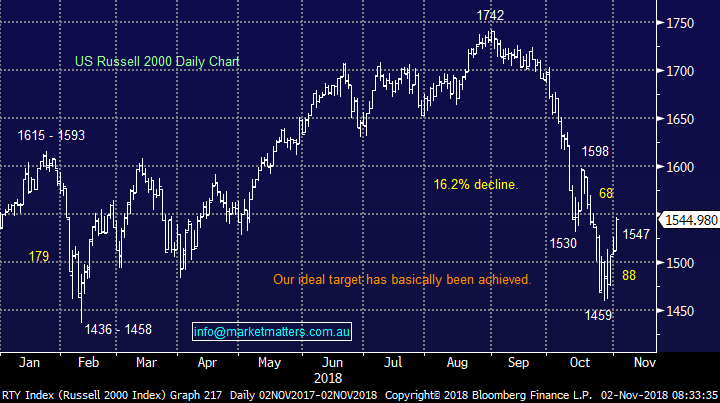
We are now neutral / bullish US stocks with a target now only a few % higher.
US Russell 2000 Chart
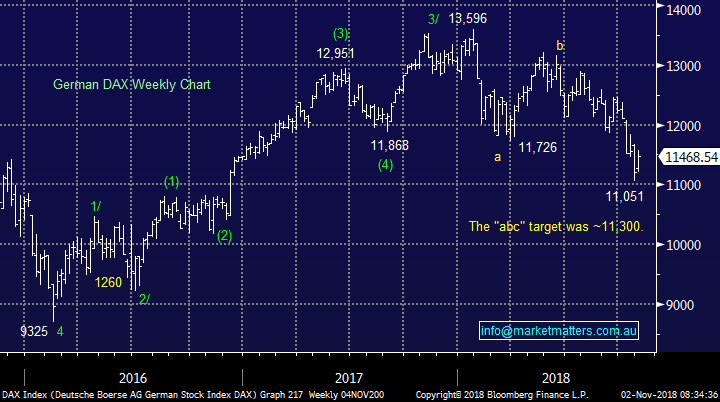
European indices are now also neutral with the German DAX hitting our target area which has been in play since January. To turn us bullish we need to se strength above 11,8000.
German DAX Chart
Overnight Market Matters Wrap
· The US continued its recent recovery overnight, with all major indices ending its session over 1% following comments from President Trump that trade discussions with China are “moving along nicely”.
· On the commodities front, a boost was seen with base metals and gold rallying strongly. Crude oil on the other hand fell over 2% as producers increase supply ahead of Iranian sanctions due to start on November 4th.
· BHP is expected to outperform the broader market yet again, after ending its US session up an equivalent of 1.60% from Australia’s previous close.
· The December SPI Futures is indicating the ASX 200 to open marginally lower, testing the 5835 level this morning.
Have a great day!
James & the Market Matters Team
Disclosure
Market Matters may hold stocks mentioned in this report. Subscribers can view a full list of holdings on the website by clicking here. Positions are updated each Friday, or after the session when positions are traded.
Disclaimer
All figures contained from sources believed to be accurate. Market Matters does not make any representation of warranty as to the accuracy of the figures and disclaims any liability resulting from any inaccuracy. Prices as at 02/11/2018
Reports and other documents published on this website and email (‘Reports’) are authored by Market Matters and the reports represent the views of Market Matters. The MarketMatters Report is based on technical analysis of companies, commodities and the market in general. Technical analysis focuses on interpreting charts and other data to determine what the market sentiment about a particular financial product is, or will be. Unlike fundamental analysis, it does not involve a detailed review of the company’s financial position.
The Reports contain general, as opposed to personal, advice. That means they are prepared for multiple distributions without consideration of your investment objectives, financial situation and needs (‘Personal Circumstances’). Accordingly, any advice given is not a recommendation that a particular course of action is suitable for you and the advice is therefore not to be acted on as investment advice. You must assess whether or not any advice is appropriate for your Personal Circumstances before making any investment decisions. You can either make this assessment yourself, or if you require a personal recommendation, you can seek the assistance of a financial advisor. Market Matters or its author(s) accepts no responsibility for any losses or damages resulting from decisions made from or because of information within this publication. Investing and trading in financial products are always risky, so you should do your own research before buying or selling a financial product.
The Reports are published by Market Matters in good faith based on the facts known to it at the time of their preparation and do not purport to contain all relevant information with respect to the financial products to which they relate. Although the Reports are based on information obtained from sources believed to be reliable, Market Matters does not make any representation or warranty that they are accurate, complete or up to date and Market Matters accepts no obligation to correct or update the information or opinions in the Reports. Market Matters may publish content sourced from external content providers.
If you rely on a Report, you do so at your own risk. Past performance is not an indication of future performance. Any projections are estimates only and may not be realised in the future. Except to the extent that liability under any law cannot be excluded, Market Matters disclaims liability for all loss or damage arising as a result of any opinion, advice, recommendation, representation or information expressly or impliedly published in or in relation to this report notwithstanding any error or omission including negligence.