Subscribers’ Questions – (ANZ, TLS, CYB, JHG, AHG, PLG, KDR, BHP, PGH, CSL)
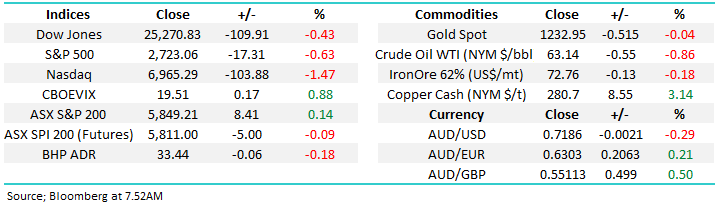
We start Melbourne Cup week with a definite “Spring” in our step as Sydney warms up and the markets recovered reasonably well from its October panic. Finally some sun at Nippers on Sunday! This week we see the much anticipated US mid-terms with President Trump and the Republicans touted as likely to lose their majority in the House, hence any surprises are likely to be pro-Trump and the market. We can see some choppy volatility into the vote, but would not be surprised to ultimately see a fairly quiet week when it comes to net change.
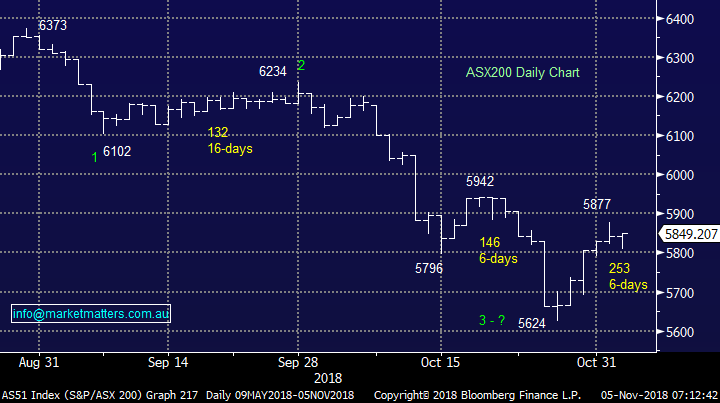
We are mildly bullish the ASX200 short-term, initially targeting a break of the 5900 area.
The US market slipped into the close of Friday, dragged lower by Apple (AAPL.US) which tumbled almost 7%. The futures market is calling our market to open down around 10-points, which overall feels about correct. We believe the market simply needs a rest after its strong +4.5% recovery. Uncertainty around the US elections still gives fund managers the perfect excuse to sit on their hands for now.
Thanks yet again for the great volume of questions, please excuse the brevity at times.
ASX200 Chart
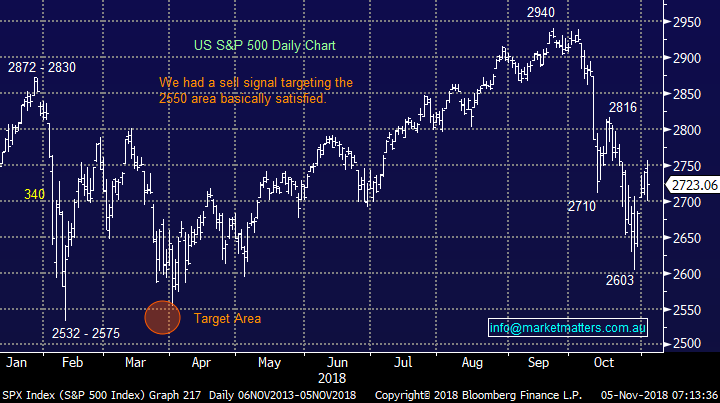
US stocks have corrected as expected, the obvious question is what now, especially as fund managers are cashed up and largely negative i.e. the path of most pain is probably now up!
We see 2 potential scenarios moving into Christmas and 2019, both of which will be exciting and full of opportunities:
1 – The S&P500 will recover back over 2800 but will ultimately fail, setting up 2019 as a bearish year – certainly overdue statistically.
2 – The S&P500 continues to climb the wall of worry in a choppy, not impulsive manner testing / potentially making a fresh all-time high before again suffering a decent correction.
US S&P500 Index Chart
Question 1
“I see you are bullish ASX 200 short term 5900, which could be a few days or weeks or maybe not. In a broader view, and probably tricky in a volatile period, although historically a positive time for markets. What are your thoughts now, for the run up to XMAS/NEW YEAR with October behind us? Maybe a short review of individual sector performance and some highlights of any MM stocks” – Simon A.
Hi Simon,
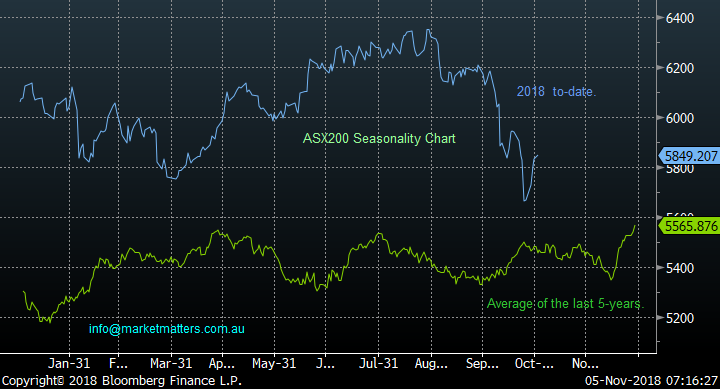
The seasonality patterns have not been that accurate in 2018 and I speculated previously that it may have been because 2018 was an inflection point i.e. end to the longest bull market in history.
Theoretically, November and often early December is tough for the ASX200 before it surges into the years end, however the years when October has been weak November is generally strong.
At this stage, I’m inclined to let the market tell us what it wants to do, but we certainly love buying weakness in early December.
ASX200 Seasonality Chart
Question 2
“A question, or two - how long before the banks will be back in favour? And is Telstra a good story or should I dump it, the trouble is I paid $5.50 when it was high, I bought the income stream, big mistake?” - Cheers Bob M.
Hi Bob,
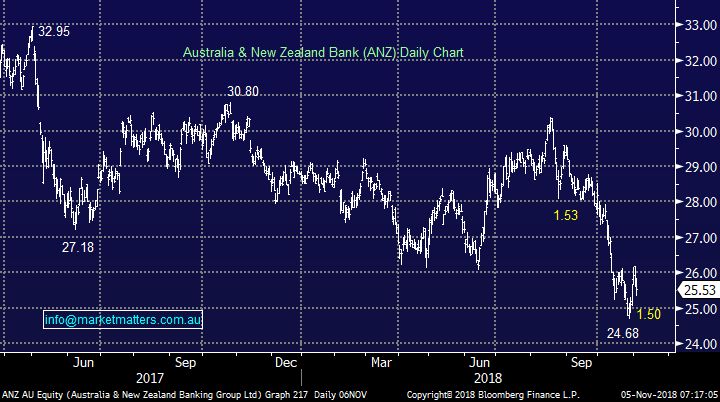
The question on the banks is in roundabout way the most common one we receive. We believe the banks are a buy into weakness, but sentiment is so bad in the sector following the royal commission and assisted by falling housing prices that they are not a sector to chase into strength. Also Shorten's plans / threats around franking credits are not helping the cause.
We believe the sector will outperform moving forward, but they are only a buy into weakness, we have a decent exposure to the sector and remain comfortable for now.
We like ANZ Bank (ANZ) under $24.50 but this clearly will not be as attractive after its 80c dividend in a weeks’ time.
ANZ Bank (ANZ) Chart
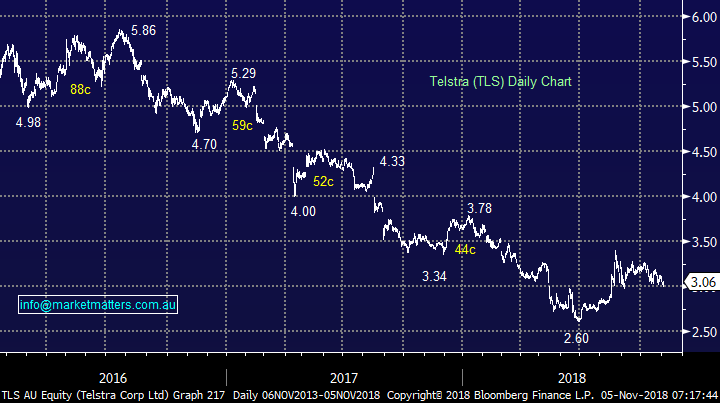
Telstra (TLS) has been a classic / painful dividend trap for many, but we believe its reasonable value around current prices. Remember to evaluate a stock / position objectively, thinking about one's entry price is not a positive process, but unfortunately something we all have been guilty of in the past.
MM is long TLS and comfortable at present, while it remains above $3.00
Telstra (TLS) Chart
Question 3
“Hi James, Question for Monday. CYB and JHG have been very disappointing recommendations showing significant current unrealised loss from buy in price. Any positive upswing from Brexit resolution may only just recoup some losses from 2 very painful positions. How can we avoid such outcomes in the future? What, in hindsight, did MM miss or get wrong in making these recommendations? What can we learn from this going forward? What does Charlie Aitken think about CYB now? Interested in your “post mortem”. – Thanks Peter O.
Hi Peter,
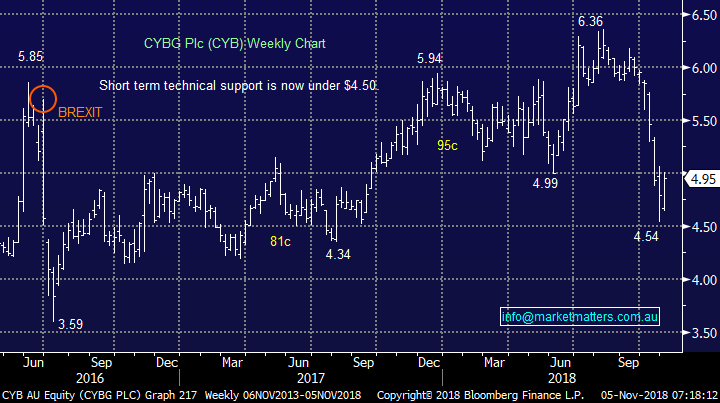
I’m a touch confused on your CYB comment, MM has made money on our last 2 forays into the stock:
1 – We bought at $5.40 on 22/11/17 and sold in July around $6 earlier this year, over 10% profit and avoided a painful decline.
2 – We bought ~ $4.65 in April to September 2017 and then sold fairly quickly in October for around $5.30 & $5.15, another profit over 10%.
I know we have discussed the stock at times with a positive bias, especially around their tie up with Virgin, but we have not yet pressed the buy trigger and patience has paid off so far.
CYBG Plc (CYB) Chart
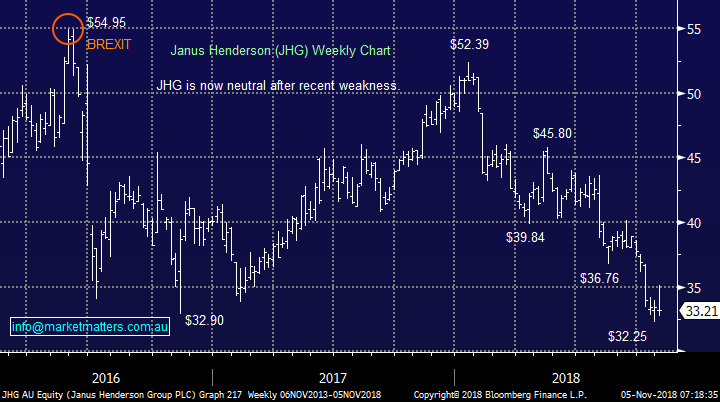
However, we are down over 20% on our holding in Janus Henderson (JHG) and our lesson has been learnt hear loud and clear!
We no longer will hold / justify a position on fundamentals alone, we want the technical picture to align hence quantifying our risk / reward.
Janus Henderson (JHG) Chart
Question 4
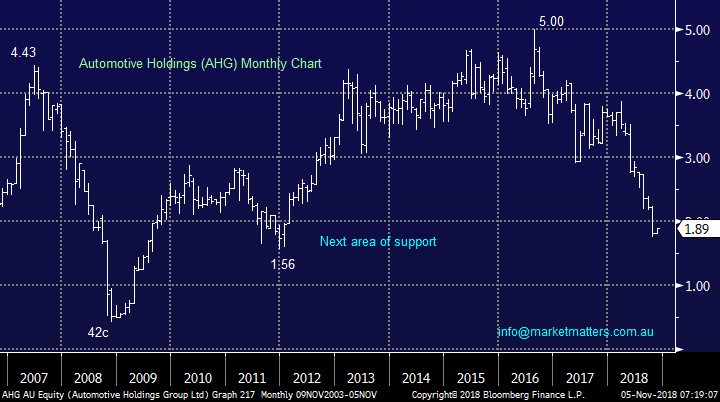
“Hi James and MM team, what is your analysis saying about Automotive Holdings Group (AHG)? The stock has been down lately, however PE and fully franked div yields look reasonably good. Any red flags or fundamentally sound?” - Thanks Brendon L.
Hi Brendon,
I think it’s fair to say that the valuation and yield looks amazing, but obviously the market doesn’t believe it will continue. At the end of October Morgan Stanley downgraded the stock to a sell, targeting $1.55 - over 15% lower. Basically they are saying the decline in house prices will lead to a meaningful decline in vehicle sales – this logic feels sound.
We see no reason to catch this falling knife until Australian household debt levels start to fall and housing prices find a base.
Automotive Holdings Group (AHG) Chart
Question 5
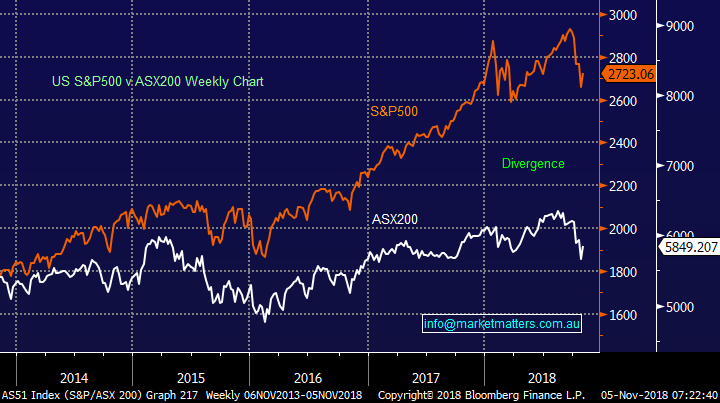
“Hi James, we have seen times when the US market was doing well and the Aussie market did not and now, we are doing better whilst the US market is not so hot. Hence, we wonder what effect it has with Australian investors actually switching between countries. Hence are they surfing the tides on both beaches, which makes good sense for those who understand both markets. However, there are different styles of investing such as quick trading and super-fund discretionary styles like yours. Does MM run a system that trades in the US market or is this too hard? Hence this question is about the different trading styles and countries, how might you define and allow for these? Also, with the US mid-term election, what might the effect be if Trump gets Trumped (TT). Should the Aussie investors and traders be considering a TT outcome and what might be the shorter- and longer-term effects of this, especially for the commodities and growth sectors.” - Kind Regards, Phil B.
Hi Phil,
We totally agree it’s easy to look at global stock markets as one simple market in this day and age. On the TT, I believe it’s already expected for the House hence market moves are likely to be muted.
The 2 major differences when you move overseas is loss of franking credits (Labor may reduce end this anyway) and currency risks.
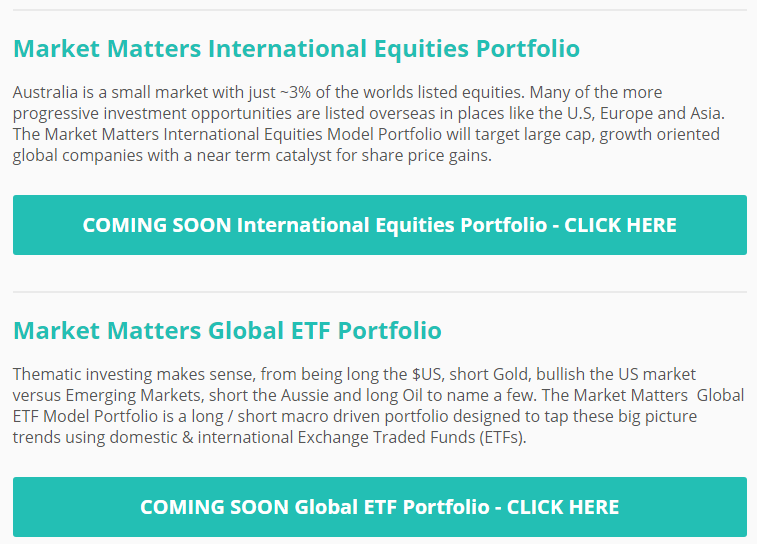
We have two new additional portfolios in the works which are currently listed on the website as - COMING SOON – both portfolios have an international skew;
US S&P500 v Australian ASX200 Chart
Question 6
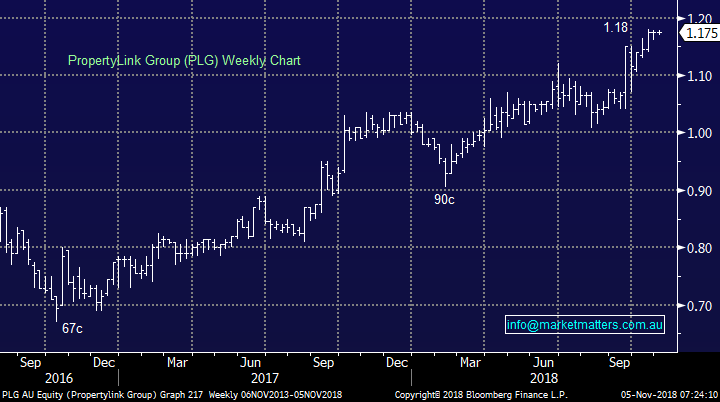
“Hi MM, I don't really understand what is happening at PLG. What is the significance of the Extraordinary General Meeting and should I be nervous? Could you advise please.” - Nick A.
Hi Nick, it’s actually a fairly complicated set of circumstances. Firstly, it’s worth setting the scene of the investment web between the companies involved, being ESR, PLG, CNI, and CIP. ESR owns ~19.9% of PLG and 14.9% of Centuria Capital (CNI). CNI owns 10.9% of PLG and 22.9% of the issued units in CIP. PLG has a 17.7% interest in CIP.
Property Link Group (PLG) made a play to buy the Centuria Industrial REIT (CIP) which was rejected by CIP. Following that, ESR Real-Estate (Australia) has made a play to buy PLG conditional upon PLG not pursuing the proposed takeover of CIP. Centuria Capital (CNI) is against ESR taking over PLG, have called an Extraordinary AGM to try and remove the board and ultimately block the deal. If successful, shares on PLG would most likely go down in the short term. Clear as mud!
Propertylink Group (PLG) Chart
Question 7
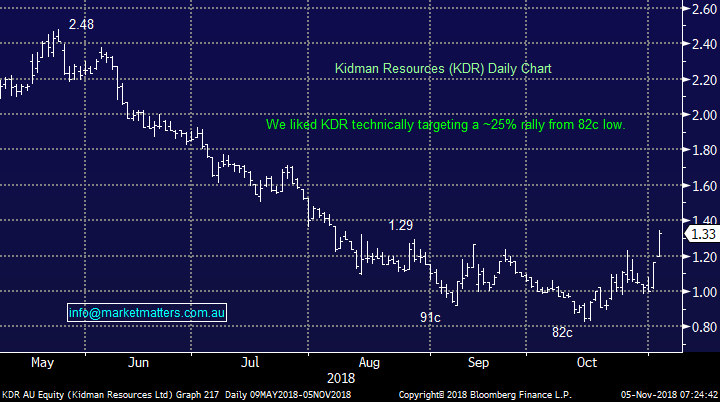
“Hi, KDR reached $1.30 today. Is the momentum in both KDR and ORE likely to continue? Bought KDR @ $0.89 three weeks ago, so seriously considering taking my profits. Also, forgot to add, seems there’s a rotation from financials into materials going on today, particularly in the banks. Is this likely to continue in the short term? - David H.
Hi David,
KDR looks great, I hope a number of subscribers followed our call on the stock – if we were long we would be taking profit on half of our holding.
On the banks to resources rotation I would not be surprised to see a little more short-term, 3 of the “Big 4” banks go ex-dividend this month and its generally a relatively tough month for the sector.
Kidman Resources (KDR) Chart
Question 8
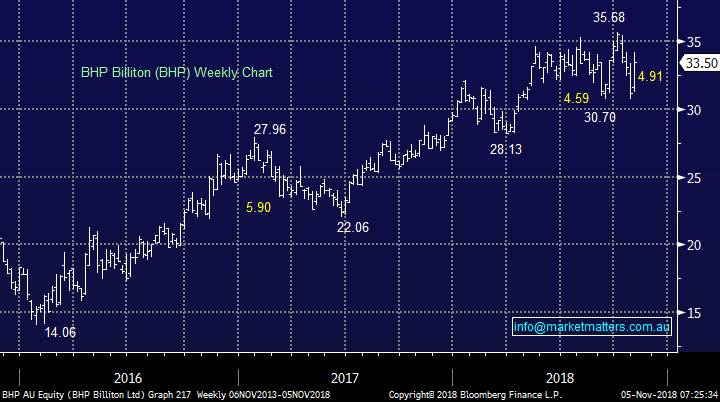
“Hi James, thanks for some really good info on the current volatility which is greatly appreciated. On this BHP buy-back, am I missing something or is the offer to buy-back at a 14% discount – that would be $28.47 if the average price on which it was calculated turned out to be the same as today’s close of $33.11 – not really all that generous at all.
If I had bought my BHP for around $36 in 2010, then forgot to sell them when they went to around $44 to $45 in 2011, then I might not want to take a loss now, by tendering for the buy-back at about $28. And if I was not paying any tax because my investment company was still carrying forward accumulated 2009-10 tax losses, then I might not think this buy-back had any value for me at all.” -Regards, Gil.
Hi Gil – the benefit of the off market buy-back comes from the franking component, the same as RIO’s recently. Based on the close price you have used at $33.11, the BHP buy-back will consist of a 0.38cps capital component and the rest packaged as a fully franked dividend, so the calculation based off $33.11 is; $33.11– 14% = $28.476. Then minus the 0.38cps = a fully franked dividend of $28.095. Divide that by 0.70 to get the true value inclusive of franking credits which equals $40.135 +0.38cps = $40.51 imbedded value.
There is also a special dividend component to the capital return program which will account for about half of the $10.4bn asset sales. Without going into the specifics, and there are various assumptions in this number, the special dividend component is likely to be around ~A$1.45.
BHP Billiton (BHP) Chart
Question 9
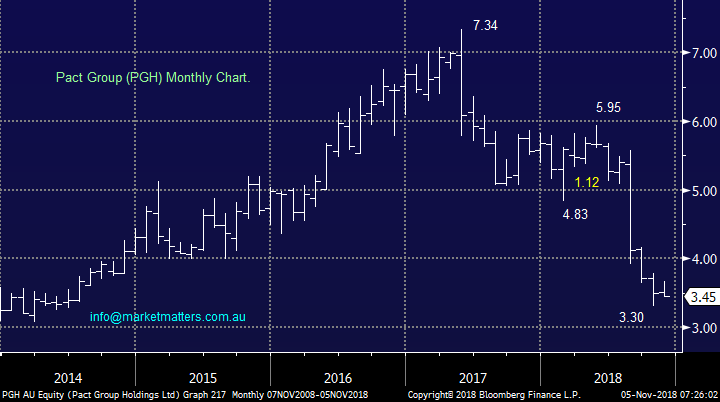
“Hi Team, I really enjoyed reading today’s report “Casting our eyes over the small end of town. In a similar theme - just wanted some insights into Pact Group Holdings (PGH) which was crunched in August following poor results (including one off restructure costs) and has continued to be sold lower ever since trending towards all-time lows. Management forecast FY19 returns should improve and dividend yield is circa 6.6% on current price. Citi/Credit Suisse upgraded sector player AMCOR to buy/outperform a few weeks back. Is this a stock we should consider in current weakness?” – Regards Shaun A.
Hi Shaun,
We’ve actually had PGH pop up on our radar since its sharp decline.
Technically we could be buyers into fresh lows below $3.20 looking for a ~15% bounce – but this is a stock that needs time to digest its rerating in our opinion before a more meaningful rally is likely to materialise.
Pact Group Holdings (PGH) Chart
Question 10
Hi James & team. I very much enjoy your service. thank you. I recently read that several of the large investment firms including Goldman Sachs & Wells Fargo are calling a strong rally following the October correction. Increased stock buy-back activity appears to have got some of them excited. I also read that the US market generally pops after mid-term elections. But what happens if the Democrats win as some of the polls are suggesting? Will this potentially have a negative impact on markets? Can you please provide some macro insights about this? Thanks, James R.
Hi James,
As discussed earlier the markets expecting Trump to lose the House – remember “buy on rumour sell on fact” perhaps simply in reverse this time.
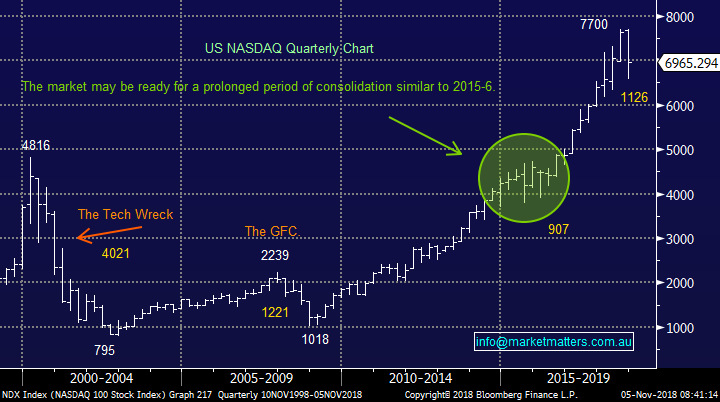
Our bigger picture remains the same, we ae looking for a choppy correction over the next 1-2 years hence:
1 – If we see a strong rally into Christmas we will lighten our exposure to stocks.
2 – Conversely if the NASDAQ tumbles under 6500 this month we will be buyers looking for at least a strong Christmas rally.
US NASDAQ Chart
Question 11
Hi James, your note on your weekend report you receive criticism from some clients for being too active with your trades. The hardest part I find with the reports is deciding when it is necessary to act. Using CSL as an example; I've made 3 purchases at prices of $102, $107 and when the market dropped at $185. If I sold the holding at $195, after allowing for tax, brokerage etc, I'd be left with net proceeds of $22,300. To re-purchase the original 129 CSL shares with my net proceeds, the share price needs to drop to $173. I think you've mentioned before about a calculation with regards to the average PE of a growth stock over time which then allows you to calculate a potential price target. Somewhere I've read for CSL that might be closer to $165. If this is the case, I would rather keep holding the CSL just in case they don't drift quite that low. When you're making your short-term trade recommendations, would it be possible to also give us some kind of thought on longer term price targets as a guide for those who may already be an owner of a stock who prefer to hold where possible?” - Kind regards Ange P.
Hi Ange,
It’s undoubtedly tricky for us to offer a perfect tailored service for all subscribers, ultimately we provide general insight and each subscriber determines whether or not its applicable for them. With the MM Growth Portfolio we simply try and add value (alpha) weekly and if we are successful the portfolio should look good on a rolling basis.
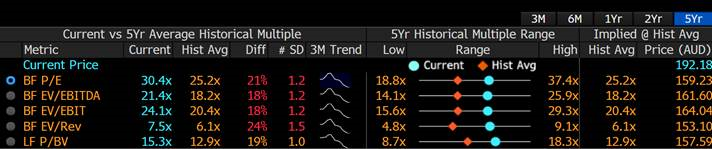
In terms of CSL multiples; Its 5 year average is 25.2x. Currently it trades on 30.4x and recently at ~$230 it was trading on 37.4x – a massive premium to its usual multiple. If we price CSL on 25.2x the stocks would be trading at $159.23 based on consensus earnings. The multiple the market will pay is dependent on growth / quality in earnings and the markets appetite for those sort of earnings at the time.
CSL PE Ranges
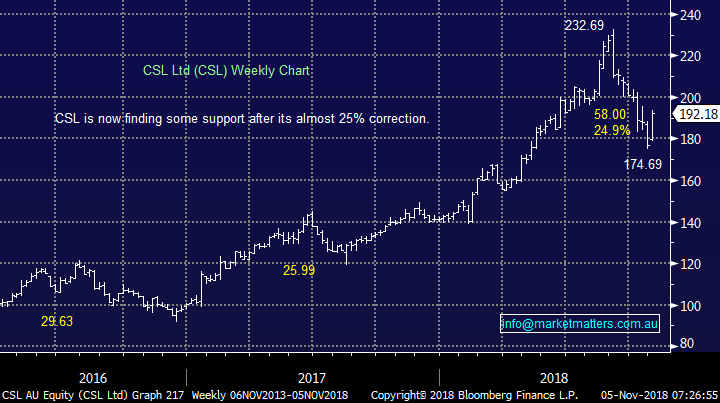
CSL Ltd (CSL) Chart
Question 12
“Hi Market Matters, while I find your commentary in your emails very useful, unfortunately the colour of the font for the bulk of the email being a light grey is extremely difficult to read on my mobile phone, especially in any daylight conditions. Where black text is used, I generally have little difficulty reading it. Would you please give consideration to using black font colour for the body of your emails?” - Kind regards Geoff J.
Hi Geoff, this is an issue with some Samsung devices. We do publish our reports in Black text however some select Samsung smart phones publish this in grey. We are addressing this issue in a new development being worked on now. I appreciate it’s annoying but will be fixed.
Overnight Market Matters Wrap
• The US lost ground last Friday, unable to hold its futures lead during our afternoon session as the US-China trade tensions are once again dominating headlines as Trump remains confident that he will strike a deal at the G-20 summit later this month.
• Base metals on the LME rallied, mirroring Trumps confidence that a trade deal will be done. Copper closed up more than 3%, however iron ore was lower, alongside with crude oil.
• The December SPI Futures is indicating the ASX 200 to open 16 points lower, testing the 5830 level this morning as focus returns on the big banks, following Westpac (WBC) reporting its annual numbers this morning.
Have a great day!
James & the Market Matters Team
Disclosure
Market Matters may hold stocks mentioned in this report. Subscribers can view a full list of holdings on the website by clicking here. Positions are updated each Friday, or after the session when positions are traded.
Disclaimer
All figures contained from sources believed to be accurate. Market Matters does not make any representation of warranty as to the accuracy of the figures and disclaims any liability resulting from any inaccuracy. Prices as at 05/11/2018
Reports and other documents published on this website and email (‘Reports’) are authored by Market Matters and the reports represent the views of Market Matters. The MarketMatters Report is based on technical analysis of companies, commodities and the market in general. Technical analysis focuses on interpreting charts and other data to determine what the market sentiment about a particular financial product is, or will be. Unlike fundamental analysis, it does not involve a detailed review of the company’s financial position.
The Reports contain general, as opposed to personal, advice. That means they are prepared for multiple distributions without consideration of your investment objectives, financial situation and needs (‘Personal Circumstances’). Accordingly, any advice given is not a recommendation that a particular course of action is suitable for you and the advice is therefore not to be acted on as investment advice. You must assess whether or not any advice is appropriate for your Personal Circumstances before making any investment decisions. You can either make this assessment yourself, or if you require a personal recommendation, you can seek the assistance of a financial advisor. Market Matters or its author(s) accepts no responsibility for any losses or damages resulting from decisions made from or because of information within this publication. Investing and trading in financial products are always risky, so you should do your own research before buying or selling a financial product.
The Reports are published by Market Matters in good faith based on the facts known to it at the time of their preparation and do not purport to contain all relevant information with respect to the financial products to which they relate. Although the Reports are based on information obtained from sources believed to be reliable, Market Matters does not make any representation or warranty that they are accurate, complete or up to date and Market Matters accepts no obligation to correct or update the information or opinions in the Reports. Market Matters may publish content sourced from external content providers.
If you rely on a Report, you do so at your own risk. Past performance is not an indication of future performance. Any projections are estimates only and may not be realised in the future. Except to the extent that liability under any law cannot be excluded, Market Matters disclaims liability for all loss or damage arising as a result of any opinion, advice, recommendation, representation or information expressly or impliedly published in or in relation to this report notwithstanding any error or omission including negligence.