Do we now see value in the FANG stocks? (FB, AAPL, AMZN, NFLX, GOOGL)
Yesterday the ASX200 again found some much needed love after the first hour managing to rally 48-points / 0.9% from the days low to finally close down only down -0.5%, this felt like a win by the end of day considering the Dow plunged over 550-points the previous session. On Thursday the US will celebrate Thanksgiving so expect thin and whippy markets as many get set for the long weekend, it felt like many investors followed the old adage “if in doubt stay out” when the Dow lost all its gains in the last hour of trade overnight - MM believes there’s a good chance we may have now seen the finale of Novembers selling, time will tell.
When we look inside the local market the “big 4 banks” remain strong as were the healthcare stocks which bounced strongly after the large block sale of CSL which hit the market on Tuesday. However the standout drag from both a points and sentiment perspective were the resources with heavyweights BHP Billiton (ASX: BHP) and RIO Tinto (ASX: RIO) both tumbling well over 3%, this sector probably needs to regain its mojo if we are correct with our bullish outlook from current levels.
MM is now bullish the ASX200 short-term targeting a “Christmas rally” to the 5900-6000 area.
Yesterday MM were extremely active in our Growth Portfolio as was previously planned / outlined in recent morning notes – we bought Appen Ltd (ASX: APX), Xero Ltd (XRO) and Altium (ALU) committing almost 10% of the portfolio to the high growth / valuation stocks, a sector we have generally avoided for the last 6-months.
Hopefully the catch cry will soon be “all aboard the Christmas rally” we are certainly now positioned for one.
Overnight US stocks closed positive even after a slide into the close with the S&P500 finishing up +0.3% - anything is better than the previous session! Europe was very strong closing up over 1% across the board. The SPI futures are calling the ASX200 to open up 15-points with BHP up 50c in the US we may do even better.
Today’s report is going to look the FANG stocks who regularly lead global markets both in price and sentiment. Obviously it’s been a tough few weeks for the NASDAQ and FANG stocks, we question if its time for investors who seek overseas market exposure to put some $$ to work / catch this falling knife, similar to how MM did locally yesterday.
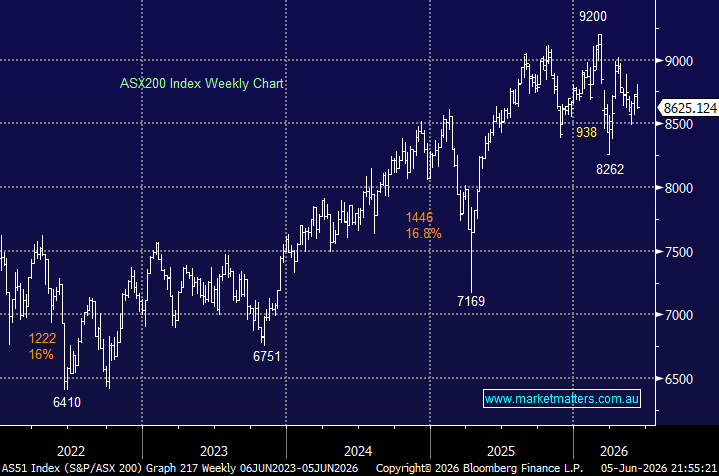
ASX200 Chart
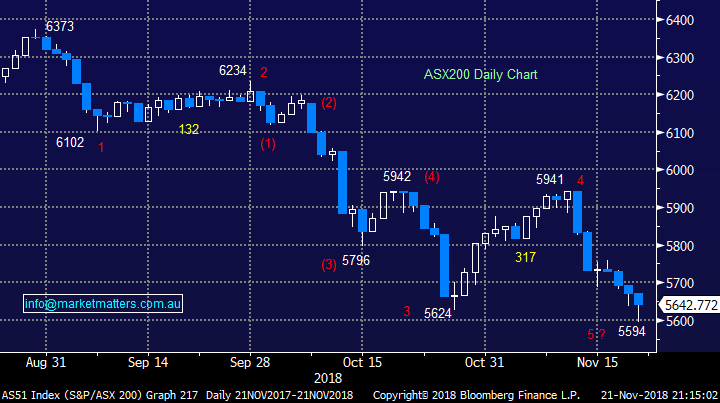
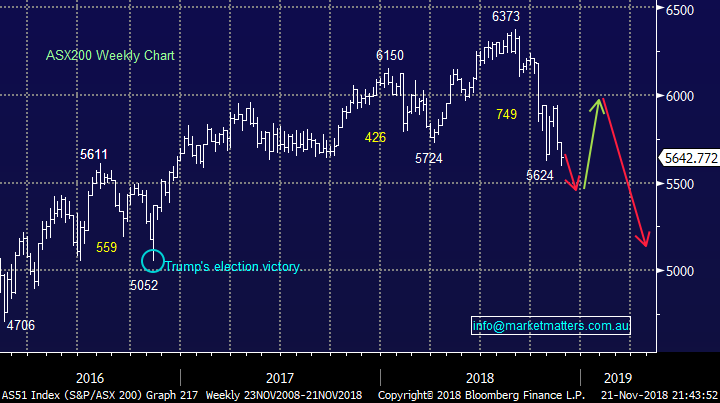
It’s important that subscribers fully comprehend our expectations for the ASX200 into 2019, and beyond. The below chart was included last weekend, and outlined our anticipated path forward.
MM has gone long in anticipation of a strong “Christmas Rally” towards 6000 before another painful correction back towards 5000 hence expect us to be sellers over the next 4-6 weeks.
ASX200 Chart
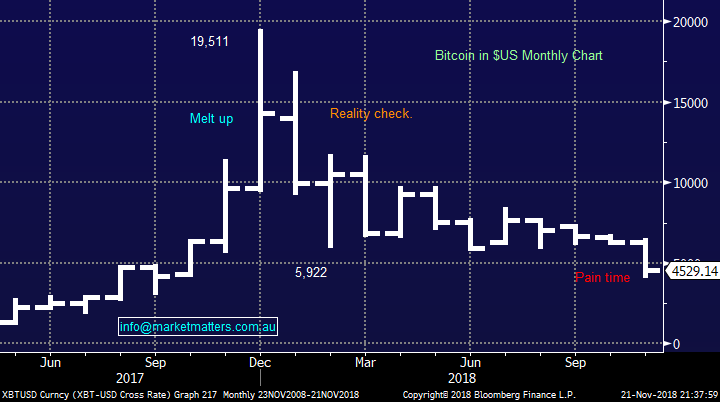
Last week we tried to make equity investors feel slightly better by pointing out the performance of the recent phenomenon in the aggressive investing / punting space – Bitcoin. Well we fired that shot way too early, in the last 2-weeks alone Bitcoin has corrected ~25% compared to the ASX200 which is ‘only’ down 5% which feels like a proverbial bed of roses in comparison.
Bitcoin $US Chart
Is it time to buy the FANG stocks?
With regards to the ASX200 we often say ”the market cannot go up without the banks” well in the US the same is probably true for the FANG stocks, at MM we add influential Apple (AAPL) to the normal 4 stock group to become Facebook (FB), Apple (AAPL) / Amazon (AMZN), Netflix (NFLX) and Google (GOOGL).
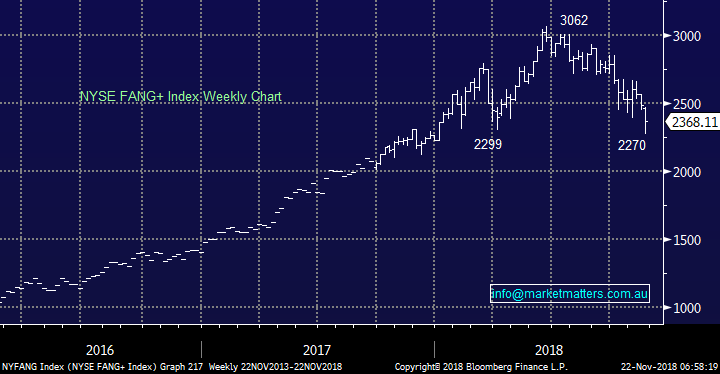
The Fang+ Index shown below has corrected just under 26% since its June high – this index actually contains other highly traded growth stocks like Alibaba (BABA), Twitter (TWTR) and Tesla (TSLA) but it’s a fair reflection of the classic group of US Growth stocks.
We are now looking for a bounce to the recent strong declines in these 5 household names but we are not confident we are witnessing a medium term important low.
The trend following / momentum players (we often refer to as lemmings) chased this growth group of tech names up ~200% over 2-years making the current correction of this advance very normal in usual market dynamics but it just doesn’t feel normal when you watch say Apple (AAPL) plunge 25% in just 2-months.
NYSE FANG Index Chart
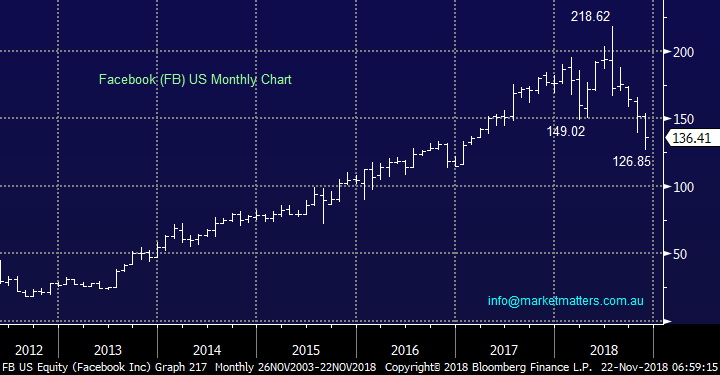
1 Facebook (FB) $US136.17
Facebook (FB) has corrected 42% from its July high on a tide of risk aversion and its own internal issues around privacy and corporate structures.
A huge amount of optimism has been removed from the social networks share price and an Est P/E for 2018 of 18.4x is now not too scary on a valuation perspective.
Technically we can see an initial bounce back towards $US155, or say 15%.
MM is now neutral, to slightly bullish Facebook although I’m personally not a fan of the social media site
Facebook (FB) Chart
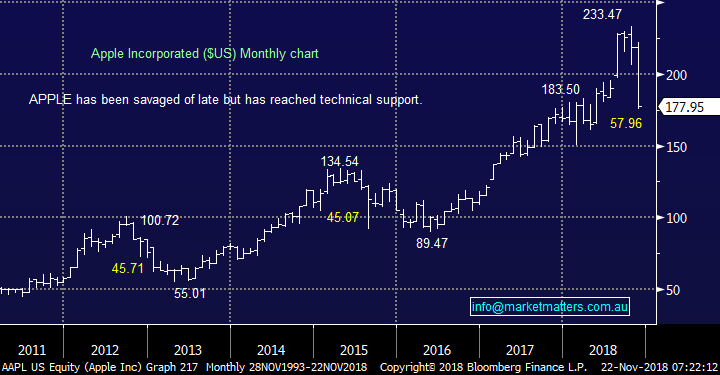
2 Apple (AAPL) $177.98.
Apple (AAPL) has now corrected 24.8% since its October all-time high with the vast amount of this damage unfolding over the last few weeks following escalating concerns around demand for new iPhones moving forward.
Apple is now trading on 13x forward earnings while delivering growth of 14%, clearly attractive numbers but the stock’s very out of favour at present – remember elastic bands usually stretch too far.
MM likes AAPL below $US180 but would maintain some “ammunition” to accumulate below $US160 while / if the stocks remains out of favour.
Apple (AAPL) Chart
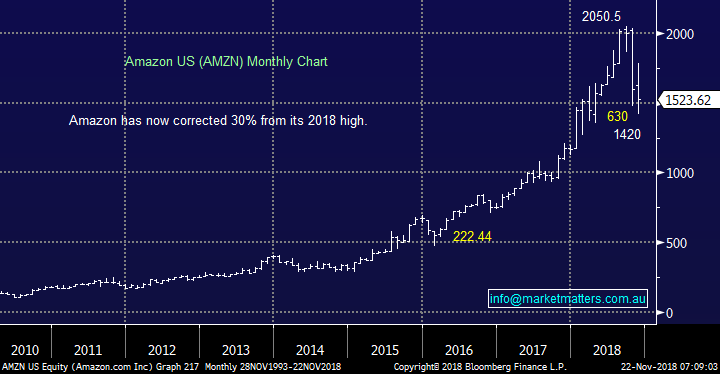
3 Amazon (AMZN) $1524.80.
Amazon (AMZN) has now corrected 30% from its September high and has reached its $US1400 major support area.
Technically the stock looks good and a bounce towards $US1750 feels likely i.e. up 15%.
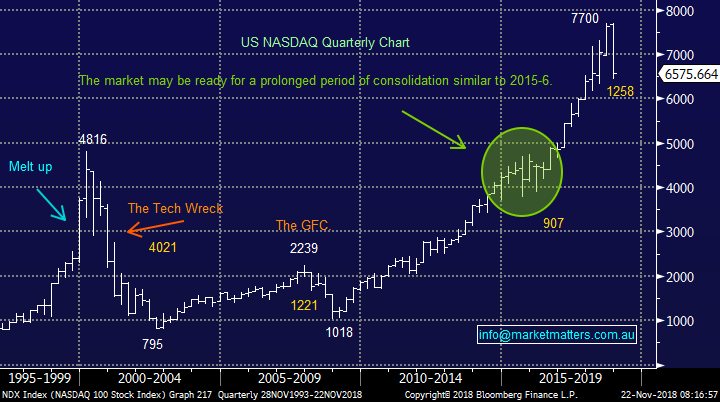
Similar to our long-term view on the NASDAQ we can see Amazon trading between 1250 and 1750 for the next few years as it simply takes a rest after its dramatic rally since the GFC.
MM is neutral / bullish Amazon but overall we feel it’s a classic time to buy weakness and sell strength.
Amazon (AMZN) Chart
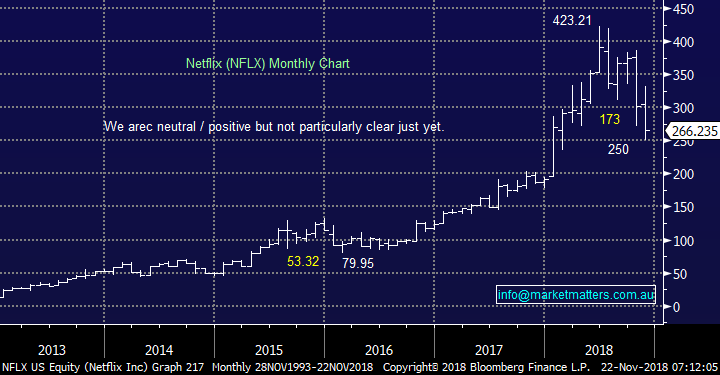
4 Netflix (NFLX) $266.23.
Netflix (NFLX) has now corrected 41% from its June high with the last 2-months more than doubling the losses.
The internet TV business has grown extremely well over the last 3-years but its very elevated valuation continues to concern us moving forward.
MM is neutral NFLX.
Netflix (NFLX) Chart
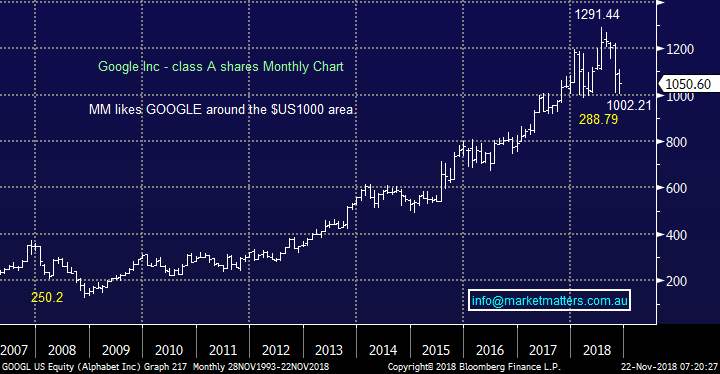
5 Google Alphabet (GOOGL) $1049.35.
Google (GOOGL) has now corrected 22% from its July high making it clearly the most stable / orderly within the group.
Technically we like GOOGL for a rally towards $US1100, another 5-6% higher.
MM likes Google at least short-term.
Google Alphabet (GOOGL) Chart
Conclusion
We are mildly bullish the FANG stocks into Christmas expecting them to correct some of the recent collective 32% decline.
Subscribers should remember we believe the NASDAQ is due a prolonged period of consolidation i.e. buy panic selling and sell strong recoveries – not the natural human mindset.
NASDAQ Chart
Overseas Indices
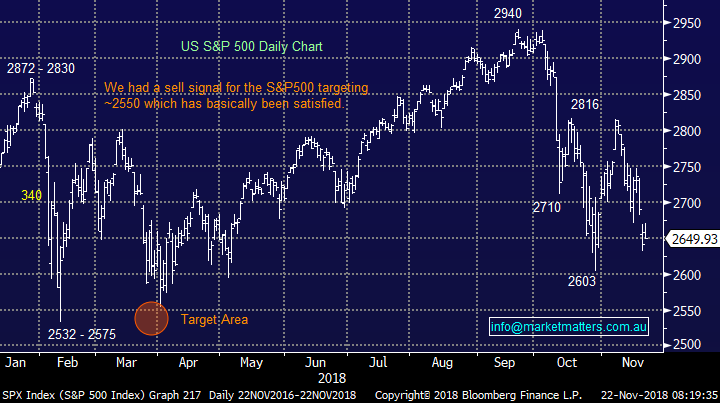
The S&P500 tried to rally last night but it was always going to be a big ask into Thanksgiving – a roast turkey with no market exposure looks to have got most investors vote.,
We are still bullish US stocks into Christmas / 2019, especially if the S&P500 can close above 2675, only 1% higher.
US S&P500 Chart
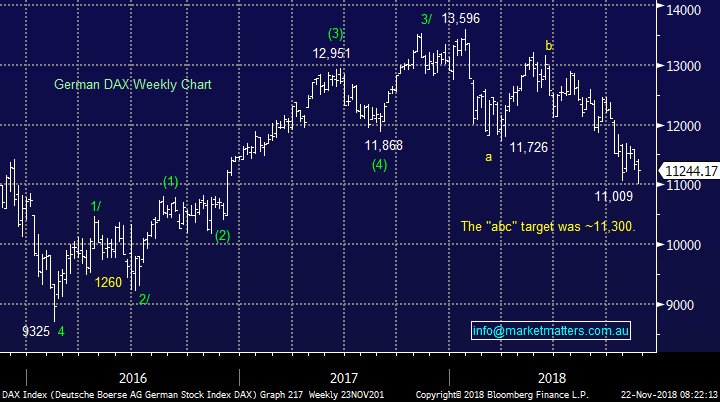
European indices are now also neutral with the German DAX hitting our target area which has been in play since January. To turn us bullish we still need to see strength above 11,800.
German DAX Chart
Overnight Market Matters Wrap
· A better session was experienced across the globe overnight, with the US ending their day on a quieter yet slightly positive note ahead of their thanksgiving day tonight.
· The FAANG stocks- Facebook, Apple, Amazon, Netflix and Google parent Alphabet led the way after the recent sharp selloff, which saw each of them down over 20% from their highs. Consequently the tech heavy Nasdaq is the strongest index overnight, rallying about 0.9% to around 7000, with the recovery in the broader markets a little more subdued.
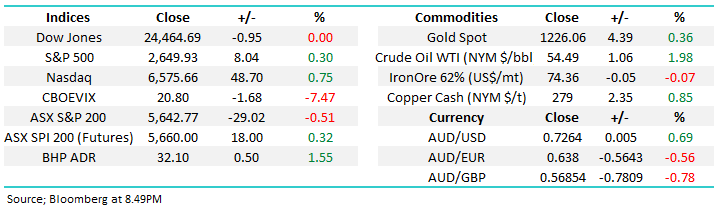
· Material and energy stocks were also firmer as commodities rebounded, with the oil price recovering 1.98% overnight along with a firmer gold and base metal suite. This followed the OECD only slightly downgrading their global growth forecasts for 2019 and 2020 to around 3.5%.
· BHP is expected to outperform again today, after ending its US session up an equivalent of 1.55% from Australia’s previous close.
· The December SPI Futures is indicating the ASX 200 to open marginally higher, up 10 points towards the 5650 level this morning.
Have a great day!
James & the Market Matters Team
Disclosure
Market Matters may hold stocks mentioned in this report. Subscribers can view a full list of holdings on the website by clicking here. Positions are updated each Friday, or after the session when positions are traded.
Disclaimer
All figures contained from sources believed to be accurate. Market Matters does not make any representation of warranty as to the accuracy of the figures and disclaims any liability resulting from any inaccuracy. Prices as at 22/11/2018
Reports and other documents published on this website and email (‘Reports’) are authored by Market Matters and the reports represent the views of Market Matters. The MarketMatters Report is based on technical analysis of companies, commodities and the market in general. Technical analysis focuses on interpreting charts and other data to determine what the market sentiment about a particular financial product is, or will be. Unlike fundamental analysis, it does not involve a detailed review of the company’s financial position.
The Reports contain general, as opposed to personal, advice. That means they are prepared for multiple distributions without consideration of your investment objectives, financial situation and needs (‘Personal Circumstances’). Accordingly, any advice given is not a recommendation that a particular course of action is suitable for you and the advice is therefore not to be acted on as investment advice. You must assess whether or not any advice is appropriate for your Personal Circumstances before making any investment decisions. You can either make this assessment yourself, or if you require a personal recommendation, you can seek the assistance of a financial advisor. Market Matters or its author(s) accepts no responsibility for any losses or damages resulting from decisions made from or because of information within this publication. Investing and trading in financial products are always risky, so you should do your own research before buying or selling a financial product.
The Reports are published by Market Matters in good faith based on the facts known to it at the time of their preparation and do not purport to contain all relevant information with respect to the financial products to which they relate. Although the Reports are based on information obtained from sources believed to be reliable, Market Matters does not make any representation or warranty that they are accurate, complete or up to date and Market Matters accepts no obligation to correct or update the information or opinions in the Reports. Market Matters may publish content sourced from external content providers.
If you rely on a Report, you do so at your own risk. Past performance is not an indication of future performance. Any projections are estimates only and may not be realised in the future. Except to the extent that liability under any law cannot be excluded, Market Matters disclaims liability for all loss or damage arising as a result of any opinion, advice, recommendation, representation or information expressly or impliedly published in or in relation to this report notwithstanding any error or omission including negligence.