The Resources Sector is rapidly becoming interesting (NCM, IEM, BHP, SFR, IEM)
The ASX200 endured a tough Monday as resource stocks were slammed dragging the market below 5700 – it’s hard for the bulls to win on a day when BHP and RIO fall by over 3.5% while many other large resources companies actually fell by more. On a positive note the banks remained firm as did some of the high growth / valuation stocks primarily in the Software and Services Sector – at times this sector has been a leading market indicator in 2018. We are bullish the volatile growth stocks at today’s levels having gone long Xero (ASX: XRO), Altium (ASX: ALU) and Appen Ltd (ASX: APX) last week, we believe a good omen for the overall market if we are correct.
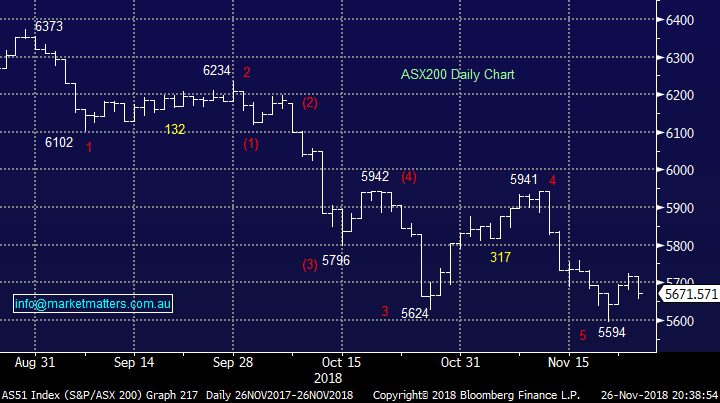
In yesterday’s report we actually stated the below opinion on how MM thought the market would trade as the resources stocks looked likely to weigh on the ASX200. Following a days trading between 5655 and 5700 we should add this was more of a rough guess that happened to get lucky with the most important point was we remained bullish and the 5650 area would probably limit any weakness.
“This time we don’t anticipate the market to open near its lows and power ahead, to close up on the day, as it did on both Thursday and Friday, but a day or 2 of consolidation between 5650 and 5700 will suit our bullish picture just fine.” – MM.
We have thrown a few statistics at subscribers over the last month, especially around the Christmas rally which MM continues to believe has started to unfold, another couple of interesting ones crossed my screens yesterday:
1 – Assuming the US S&P500 fails to close up 3% for the week it will be a rare occurrence when US stocks are down in both October and November. The last 10 occasions when this has occurred the S&P500 rallied in December 100% of the time for an average gain of over 4% = bears beware!
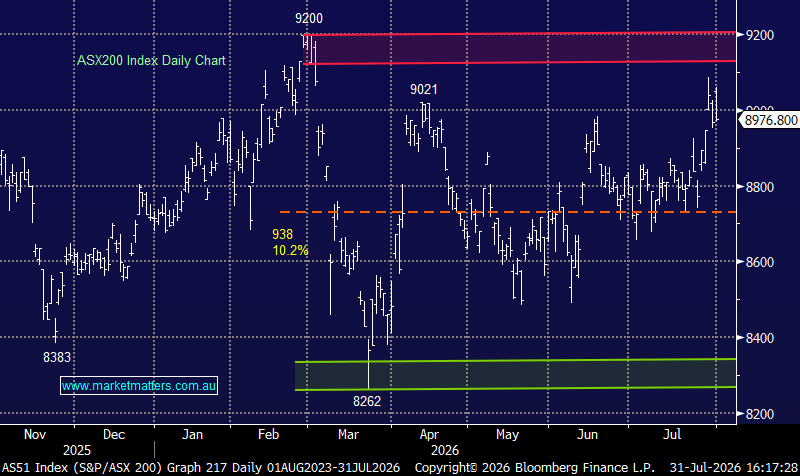
2 – The ASX200 has now corrected 12.2% from its August high but is interestingly now only trading at its average PE ratio 14x for the last 15-years i.e. investors should remember to sell when euphoria gets ahead of itself and vice versa.
MM remains bullish the ASX200 short-term targeting a “Christmas rally” towards the 5900-6000 area.
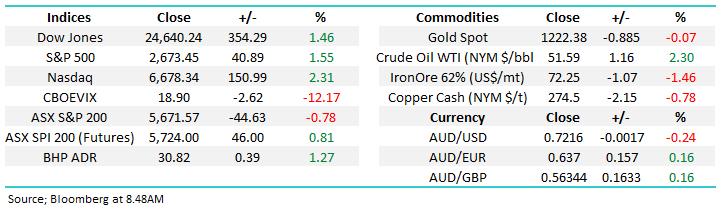
Overnight US stocks were strong with the Dow closing up over 350-points while the NASDAQ was led the way surging ~2.3%. The SPI futures are pointing to the ASX200 opening up around 50-points with BHP bouncing ~1% in the US, regaining only about a third of yesterday’s sell-off.
Today’s report is again going to focus on the resource’s sector as we consider increasing our exposure into current significant weakness.
ASX200 Chart
Before we look at the Resources Sector with at least half an eye on increasing our exposure to the battered group we need to look at what stocks / positions we are considering liquidating to finance the potential purchases.
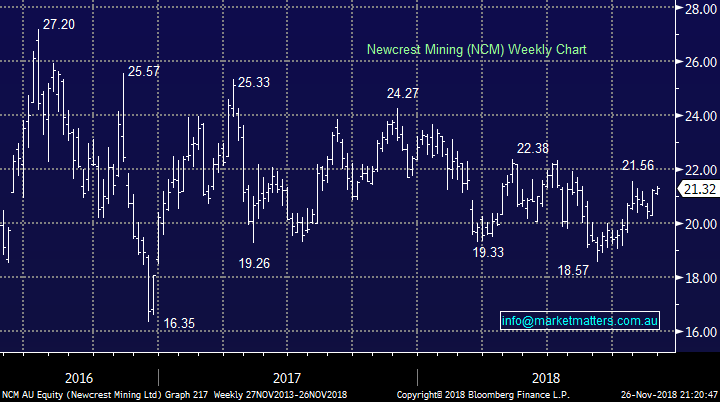
Newcrest Mining (ASX: NCM) $21.32
MM has held a 3% allocation to NCM in its Growth Portfolio since July and the position is currently showing a very small profit as the gold miner and its sector has remained supported by overall stock market and economic concerns.
If we are correct and a Christmas rally is underway NCM is unlikely to be on many shoppers must buy list i.e. since early September NCM has rallied almost 15% while BHP has slipped over 14% from its October high – an inverse relationship we believe has potentially gone too far.
However seasonally NCM does usually enjoy a Christmas rally along with the ASX200 gaining an average of +3.7% over the last decade – probably more a function of a weaker US
MM is considering selling NCM to fund purchases in the traditional resources space.
Newcrest Mining (ASX: NCM) Chart
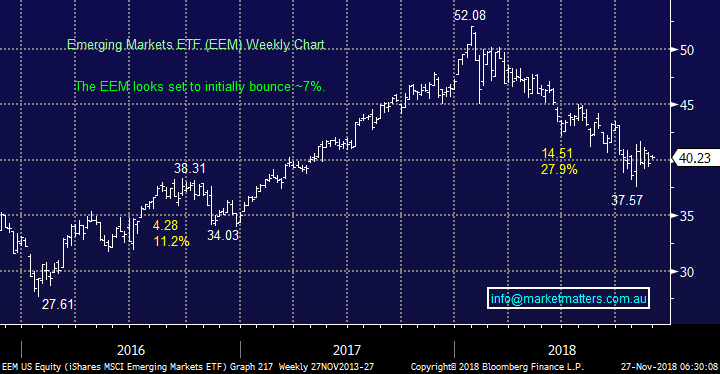
Emerging Markets ETF (ASX: IEM) $55.44
MM has held a 5% allocation to the Emerging Markets in its Growth Portfolio since September via the iShares ETF (IEM) - the position is currently showing a few percent loss.
Technically we are targeting a 7% bounce from the US version from current levels which equates to ~58 for the IEM.
MM is considering selling its IEM holding to fund purchases in the traditional resources space if this elastic band stretches further.
iShares Emerging markets US ETF Chart
Australian Resources, is now the time?
I remember when we sold the last of our position in BHP Billiton (ASX: BHP) back in May at $34 we received the chagrin of a few subscribers, although not as many as when we called the big Australian to basically halve back in 2014. This is not us trying to pat ourselves on the back here just reiterating our mantra around the resources sector:
“Resources stocks are trading / active investing vehicles simply because they cannot control their profitability, beyond some efficiencies, that is controlled by the underlying commodities which they produce.”
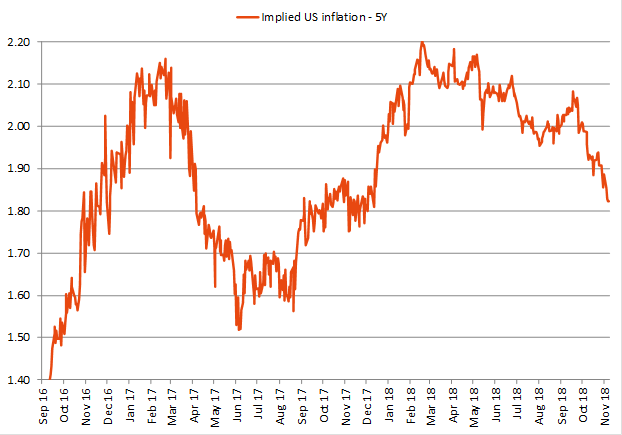
Resources and commodities have been smacked over recent weeks because the world has become fixated on the US slipping into recession in 2019 / 2020 E.g. traders are now only factoring in 2 ½ interest rate hikes in the US between now and the end of 2019 compared to the 5 the Fed have been spruiking. The implied US inflation chart shown below illustrates the lack of desperate need for the Fed to keep pushing rates sharply higher.
There’s nothing like a recession and of course the US – China trade concerns to ignite a rout in Australia’s much loved resources. The obvious question is if / when do we try and catch this falling knife.
The Growth Portfolio already holds 5% in Western Areas (ASX:WSA) and RIO Tinto (ASX: RIO) respectively, not huge but still painful on days like yesterday.
Source; Shaw and Partners
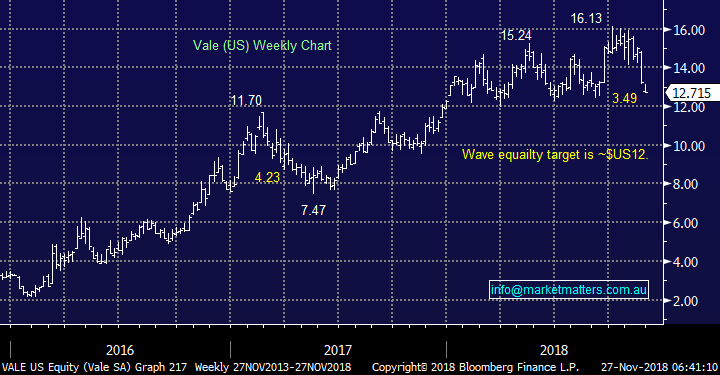
MM has been bearish US listed Vale, the world’s largest iron ore and nickel producer, for a few months targeting the $US12 area, now only 5% away following the stocks ~21% correction.
The implication from Vale is to remain a touch patient before pulling the trigger to increase our local resources exposure.
Vale (US: VALE) Chart
If we sell our NCM and IEM positions it will free up 8% cash for us in the Growth Portfolio, below are the 3 most likely candidates if weakness continues in resources over the coming week.
NB We will be looking to take on 1-2 new positions, not increase our current holdings to spread our risk across different underlying commodities / stocks exposures.
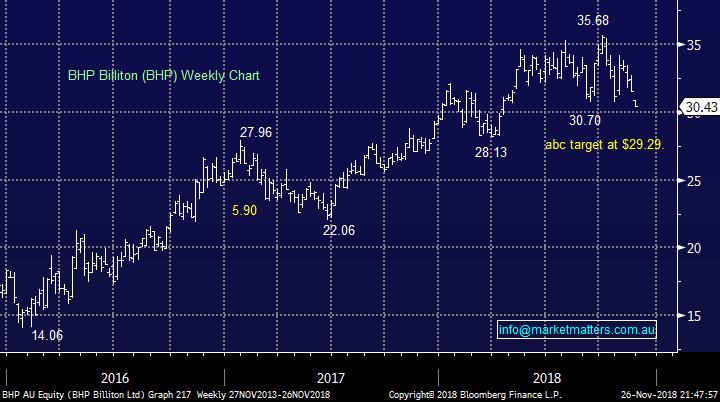
1 BHP Billiton (ASX: BHP) $30.43
No change, BHP has been on our radar since May when we sold to our position to re-enter below $30. While the news from BHP has been solid in 2018, with capital returns catching the eye, we have remained cognizant that the market has been long & optimistic the stock – investing with the crowd usually concerns us.
At this stage we see no reason to chase this piece of resources royalty at current levels.
MM remains keen buyers of BHP around $29.50.
BHP Billiton (ASX: BHP) Chart
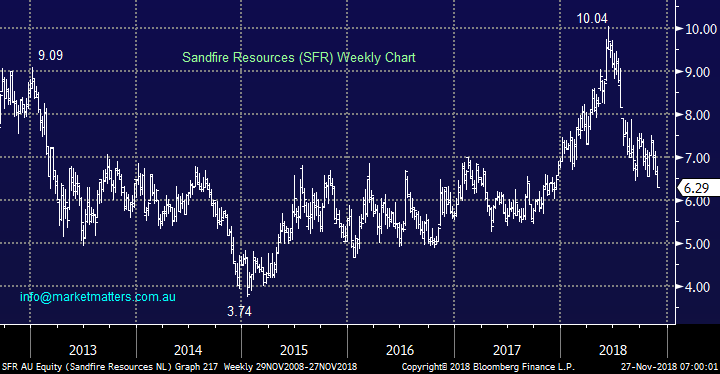
2 Sandfire Resources (ASX: SFR) $6.29
Sandfire is an interesting one to MM as overall it coincides with our view on the index into 2019/2020. SFR has already corrected 37% in 2018 as the sector remains very out of favour. As a company all looks ok following a solid September quarterly report when 2019 guidance was maintained, plus the company has over $200m cash on hand.
The US – China trade war is definitely a negative factor for SFR but there’s a lot of bad news / risk built into the share price. We are bullish the copper and gold producer from around the $6 area looking for a 15-20% bounce but ultimately we can see sub $4 hence we are only considering a short-term play.
MM is short-term positive SFR from around $6 for quick 15-20% bounce.
Sandfire Resources (ASX: SFR) Chart
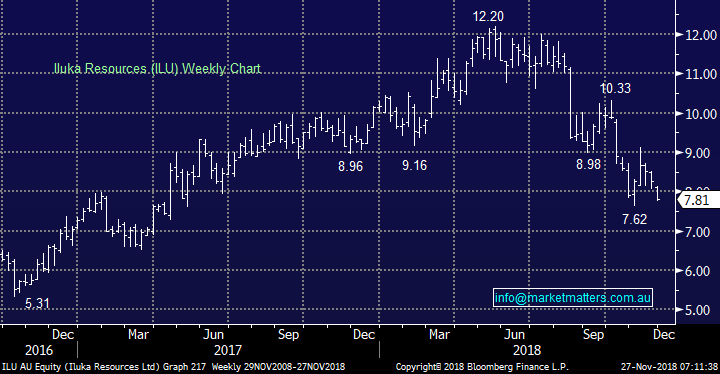
3 Iluka (ASX: ILU) $7.81
MM likes the mineral sands business although we are clearly happy to have exited our position at $10.80 back in February, it felt premature for a while but certainly not today.
The stock’s been under noticeable pressure since the release of its half year results back in August – a reasonable result with revenue up almost 25% while net profit after tax (NPAT) came in at $126m – less than the market was positioned for but not a disaster in our opinion. The main negative through stemmed from higher costs associated with the expansion of its Sierra Rutile operation, the market has clearly spoken with its feet!
The correction in 2018 is approaching 40% and we believe the markets becoming too negative the stock.
MM currently likes ILU into fresh lows under $7.60.
Iluka (ASX: ILU) Chart
Conclusion
MM is considering exiting one or both of its holdings in NCM and the IEM ETF and switching into the resources sector if weakness persists.
At this stage its close but we feel the elastic band probably has further to stretch.
Watch for alerts in coming days.
Overseas Indices
US stocks enjoyed a great night following ion from the Thanksgiving festivities with the “risk on” NASDAQ leading the way rallying +2.3%.
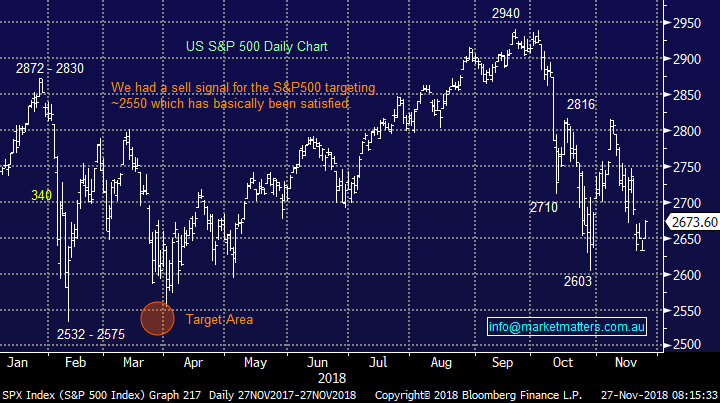
We are still bullish US stocks into Christmas / 2019, especially if the S&P500 can close above 2700, only 1% higher.
US S&P500 Chart
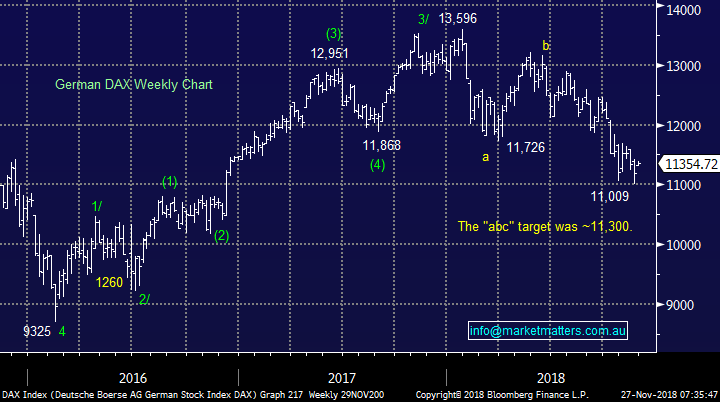
European indices remain neutral with the German DAX hitting our target area which has been in play since January. To turn us bullish we still need to see strength above 11,800.
German DAX Chart
Overnight Market Matters Wrap
· Both the Euro and US regions were on a charge overnight, leading towards the end of November as Italian budgetary woes receded and British parliament will vote on the Brexit deal on December 11.
· US energy stocks gained following crude oil’s 2.30% advance, where we expect BHP to outperform the broader market today after ending its US session up an equivalent of 1.27% from Australia’s previous close.
· Metals on the LME were mostly lower, while the big move overnight was iron ore, after trading limit down in Asia yesterday.
· The December SPI Futures is indicating the ASX 200 to open 46 points higher, testing the 5720 level this morning.
Have a great day!
James & the Market Matters Team
Disclosure
Market Matters may hold stocks mentioned in this report. Subscribers can view a full list of holdings on the website by clicking here. Positions are updated each Friday, or after the session when positions are traded.
Disclaimer
All figures contained from sources believed to be accurate. Market Matters does not make any representation of warranty as to the accuracy of the figures and disclaims any liability resulting from any inaccuracy. Prices as at 27/11/2018
Reports and other documents published on this website and email (‘Reports’) are authored by Market Matters and the reports represent the views of Market Matters. The MarketMatters Report is based on technical analysis of companies, commodities and the market in general. Technical analysis focuses on interpreting charts and other data to determine what the market sentiment about a particular financial product is, or will be. Unlike fundamental analysis, it does not involve a detailed review of the company’s financial position.
The Reports contain general, as opposed to personal, advice. That means they are prepared for multiple distributions without consideration of your investment objectives, financial situation and needs (‘Personal Circumstances’). Accordingly, any advice given is not a recommendation that a particular course of action is suitable for you and the advice is therefore not to be acted on as investment advice. You must assess whether or not any advice is appropriate for your Personal Circumstances before making any investment decisions. You can either make this assessment yourself, or if you require a personal recommendation, you can seek the assistance of a financial advisor. Market Matters or its author(s) accepts no responsibility for any losses or damages resulting from decisions made from or because of information within this publication. Investing and trading in financial products are always risky, so you should do your own research before buying or selling a financial product.
The Reports are published by Market Matters in good faith based on the facts known to it at the time of their preparation and do not purport to contain all relevant information with respect to the financial products to which they relate. Although the Reports are based on information obtained from sources believed to be reliable, Market Matters does not make any representation or warranty that they are accurate, complete or up to date and Market Matters accepts no obligation to correct or update the information or opinions in the Reports. Market Matters may publish content sourced from external content providers.
If you rely on a Report, you do so at your own risk. Past performance is not an indication of future performance. Any projections are estimates only and may not be realised in the future. Except to the extent that liability under any law cannot be excluded, Market Matters disclaims liability for all loss or damage arising as a result of any opinion, advice, recommendation, representation or information expressly or impliedly published in or in relation to this report notwithstanding any error or omission including negligence.