Overseas Wednesday on a Thursday!
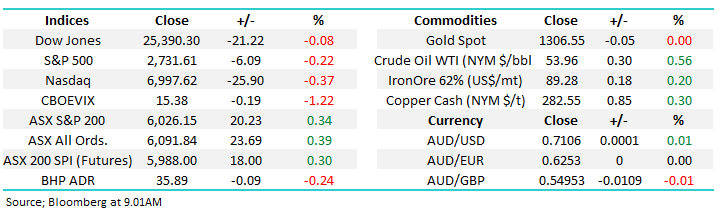
The ASX200 maintained its strong start to February rallying 20-points to register its highest close since mid-October 2018. However the stars of the show were different to Tuesday with the banks surrendering some of their explosive post Hayne report gains, not helped by an average CBA result, whereas the broad market was noticeably strong with almost 10% of the ASX200 rallying by over 3%.
The market continues to embrace a “risk on” attitude which was illustrated by the gold stocks being the only standout sector to close in the red, (other than the banks). Also, the market moves following the RBA’s comments again demonstrated the current glass half full mindset towards equities:
1 – Equities embraced the RBA’s retreat away from future interest rate hikes i.e. they now believe “the probabilities are more evenly balanced” between an interest rate hike and an interest rate cut – effectively mirroring the Fed’s data dependency call.
2 – Conversely local stocks ignored the reasons behind the RBA’s change in stance i.e. an uncertain economic landscape due to high household debt, falling property prices, weak retail / car sales and China’s economic slowdown.
We have no doubt the market will again get the economic jitters at some stage in 2019 – no great call as stock markets correct around 10% on average once a year. At the moment the ASX200 continues to demonstrate the traits of an index which has a strong underbelly. While we continue to target a US led pullback over the weeks ahead we believe this strong rebound from Decembers panic selling has months further to unfold in the bigger picture.
MM is now in “buy mode “due to our relatively large cash position – the current reporting season may provide some opportunities.
Overnight, US markets were quiet however CYBG (ASX:CYB) released a quarterly update in the UK upgrading margin and costs guidance. CYB was up 14% in the UK and looks likely to open around $3.70 locally today. Overall our market is expected to open up ~15-points higher.
A quieter day on the reporting front today, although we’ve already had results from Downer (ASX:DOW), AGL Energy (ASX:AGL) & Mirvac (ASX:MGR). DOW looks a cracker with a big upgrade to guidance while AGL has had a very good 1H beating expectations, however no share buy-back may be an issue and while they reaffirmed guidance to be at the midpoint of the $970-$1070m range, the market was at the top end so about 3.5% miss to expectations.
Today we are again going to look at 5 big movers during the last week from overseas markets – a late overseas Wednesday report.
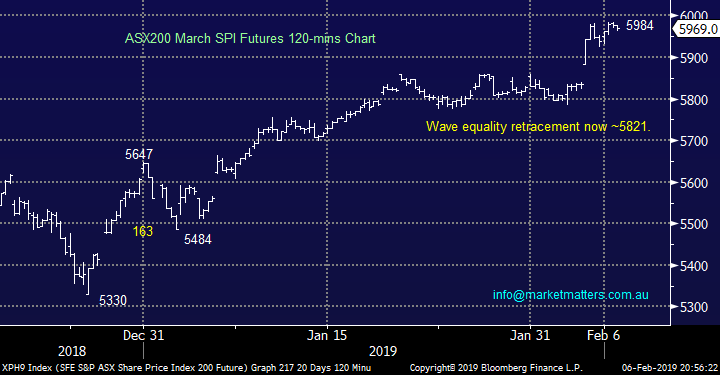
ASX200 March SPI Futures Chart
The little “Aussies Battler” fell almost 1c following the RBA’s interest rate about turn yesterday but interestingly it remains almost 4c above last month’s panic low – we are a rare beast at present believing the decline in the $A is complete, or at the very least largely over.
If we are correct over the next few years the heavily owned $US earners may surrender some of their major outperformance – no sign yesterday with the likes of ResMed (RMD), Cochlear (COH) and Macquarie Group (MQG) all performing strongly.
Australian Dollar ($A) Chart
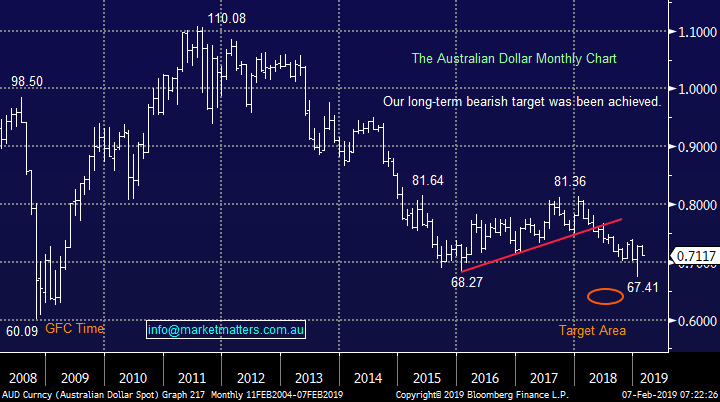
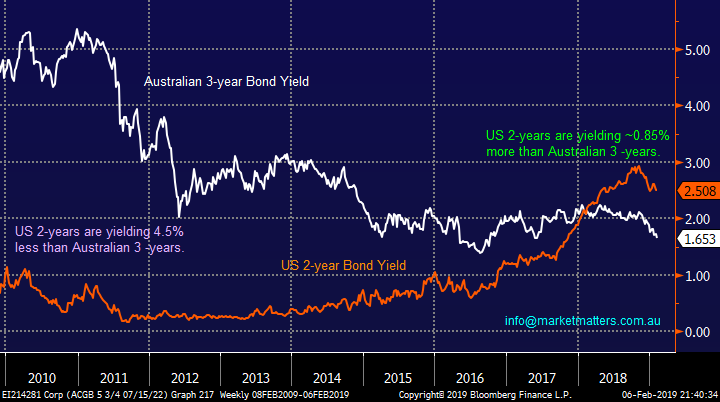
The reason for the $A’s decline since 2011 is easy to comprehend when we consider the interest rate differential between our respective countries – it’s been a long, long time since US bonds paid more interest than our own. Simply money held in $US is earning more interest than that held in $A.
At MM we are not calling this interest rate differential to reverse in a hurry but as we saw with the banks this week when the market is positioned one way the surprises can hurt the crowd moving in the other.
On balance MM continues to believe the risks for the $A are now up.
Australian Bond Yeild vs US Bond Yield Chart
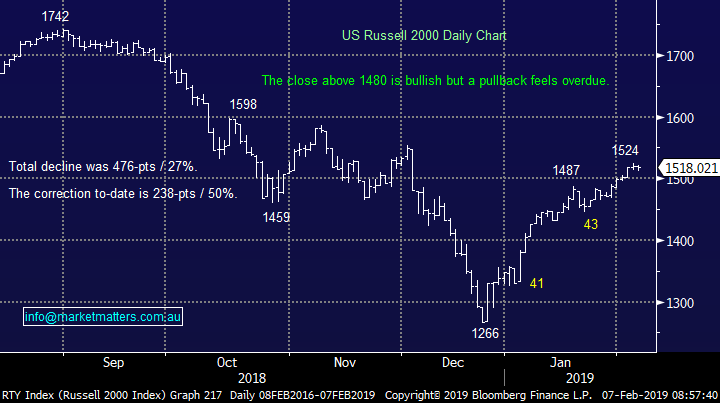
No change, we continue to look for a ~6% correction for US indices to provide a buying opportunity.
US Russell 2000 Chart
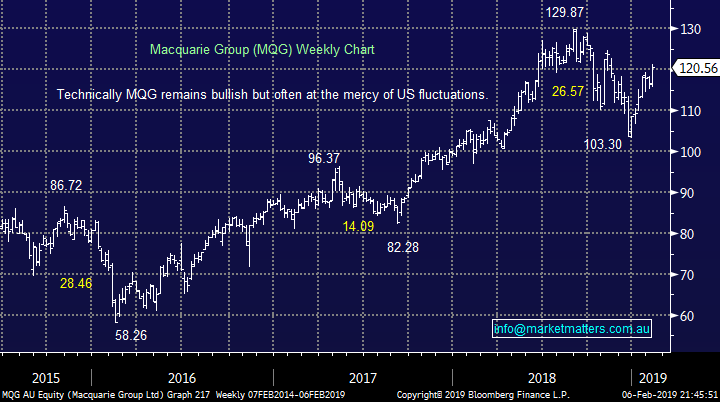
Interestingly Macquarie Bank (MQG) which is highly correlated to US stocks agrees with our bullish view for US indices over the months ahead – not necessarily weeks.
MM is bullish MQG targeting a break of $130 in the short-term, around 10% higher – hence we are ideally buyers of a pullback for a short-term play.
NB This is a short-term view based around our outlook for stocks over the next few months as opposed to our longer term risk / reward view for the $A.
Macquarie Bank (ASX: MQG) Chart
Looking for opportunities overseas Indices.
Today we have looked at the 3 best performing stocks and 2 worst in the Top 100 listed companies by market capitalisation.
When we look at the sheer size of the top performers and their explosive gains it’s no surprise we’re starting February off with global indices significantly higher than their panic lows in late December.
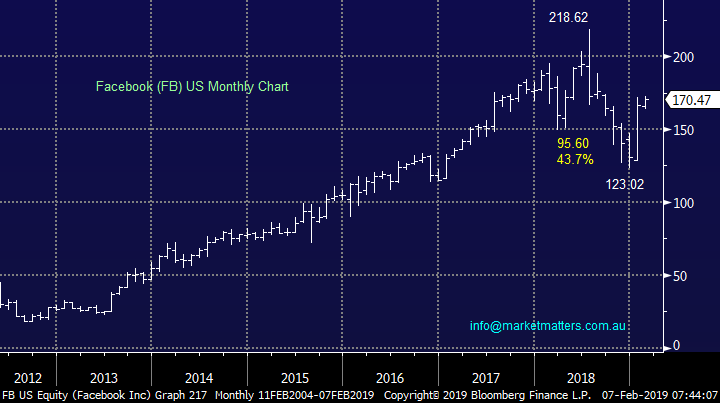
1 Facebook (FB US) $US170.47
Facebook is now the up an impressive +18% over the last 5 trading days. The stock has surged since announcing its 4th quarter earnings that exceeded the most bullish analysts expectations i.e. web advertising continues to grow for the majors.
FB certainly endured some bad press in 2018 led by issues around privacy and data sharing. However while the company’s revenue continues to perform these issues are likely to reside in the back of investors’ minds.
MM is now neutral / bullish FB with a 2019 target around 15% higher.
Facebook (FB US) Chart
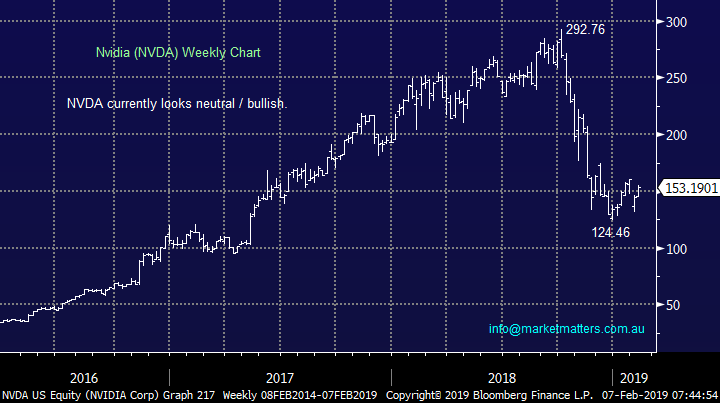
2 NVIDIA Corp (NVDA US) $US153.19
Last time we looked at NVIDIA (NVDA) we thought it was due a recovery and it’s now up almost 16% to-date over the last 5 trading days.
We believe the world’s 60th largest stock can recovery further following its 57% plunge in 2018.
MM remains bullish NVDA targeting another 15-20% upside in the months ahead.
NVIDIA Corp (NVDA US) Chart
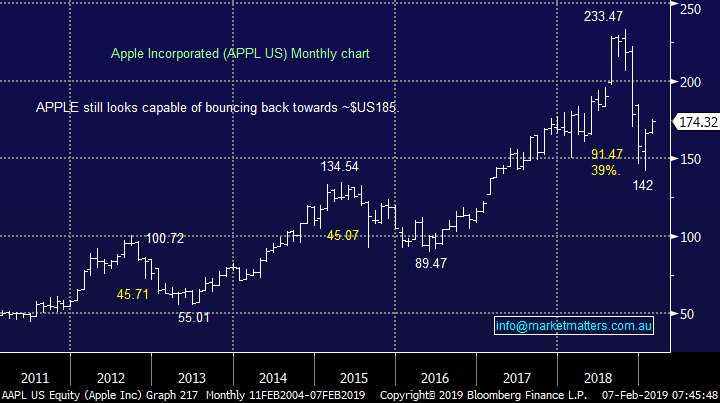
3 Apple Inc (AAPL US) $US174.32
The world’s largest company is now up close to 13% over the last 5 trading days helping the “FANG” index surge into 2019. The stock has enjoyed a solid relief rally following their beat of already reduced earnings expectation, but their diminishing footprint in China remains a worry.
Moving forward iPhone sales no longer appear to be the company’s growth engine and its likely to be replaced by Apple Services – which is the bucket that include iTunes, Apple Pay, Apple Care, Cloud Services – basically all the things that help further monetise the user base.
We can easily see the $US180-200 region come into play over the coming months but we would consider trimming exposure there.
Apple Inc (AAPL US) Chart
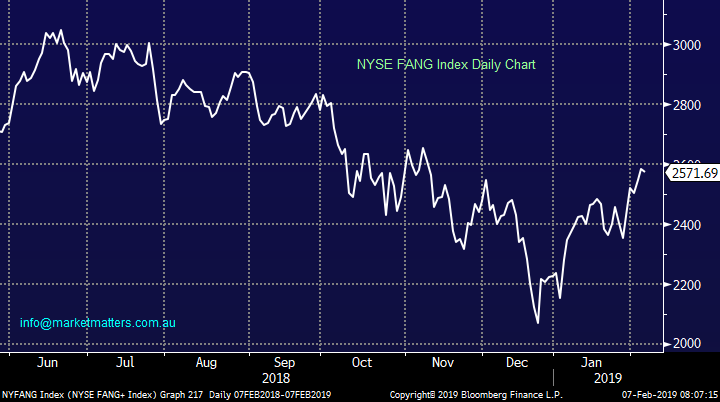
Our ideal retracement target for the FANG+ index is ~8% lower – from a risk / reward perspective we would no longer be long the FANG stocks in the short-term.
NYSE FANG+ Index Chart
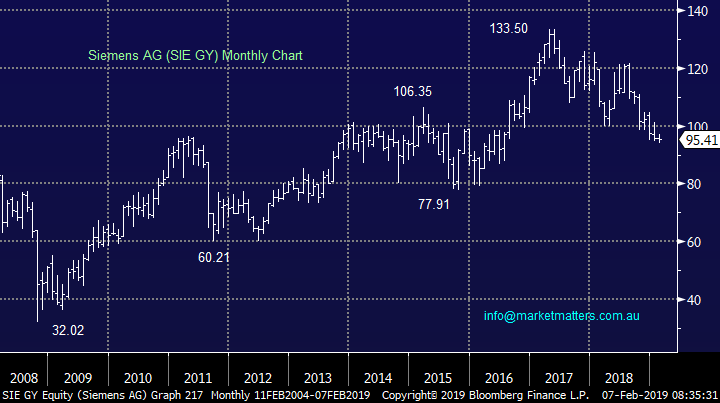
4 Siemens AG (SIE GR) Euro95.41
EU anti-trust regulators recently rejected an Alstom-Siemens tie up which has helped push the stock down ~5% over the last 5 trading days. Conversely French based Alstom has fared well following the regulators decision, rallying nicely – like the market this is our preferred exposure to this sector.
The German engineering and manufacturing business has failed to embrace the recent global equities recovery which does not bode well for the stock.
MM is neutral / bearish Siemens.
Siemens AG (SIE GR) Chart
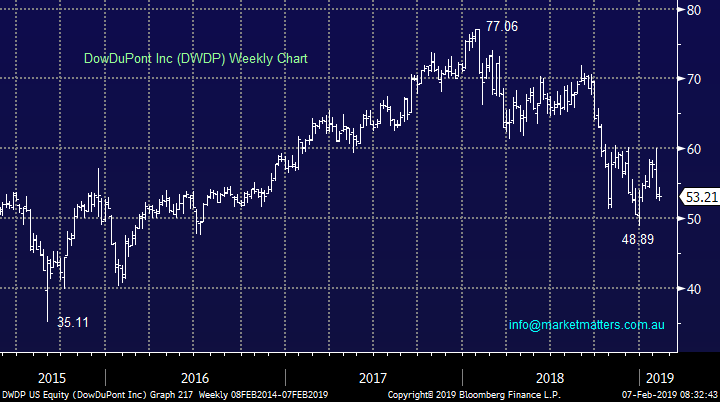
5 DowDuPont (DWDP US) $US53.37
DowDuPont is now down close to -10% over the last 5 trading days, not a great result when global stocks as a group are rising.
Last October DWDP fell over 16% following the announcement that they were taking a massive $4.6bn impairment charge in the 3rd quarter of last year for goodwill / assets in its agricultural division. They also said the Ag division would not live up to analysts’ expectations due to “lower growth in North America and Latin America” i.e. a big downgrade.
We are short-term bearish targeting a further 15% downside.
Dupont (DWDP US) Chart
Conclusion
Of the 5 international stocks we looked at today below is summary of our view from today:
Bullish- NVIDIA Corp (NVDA US).
Bullish from lower levels– Apple (AAPL US) and Facebook (FB US).
Neutral / bearish –Siemens (SIE GY) and DowDuPont (DWDP US).
Overnight Market Matters Wrap
· The US had a breather from its recent ascent overnight, ending its day with little change however with an overall positive earnings season thus far.
· European markets were also slightly easier, although CYB rose nearly 14% after a stronger Q1 earnings update and we expect this to flow domestically, ending its UK session up an equivalent of $0.52 from Australia’s close.
· The A$ is under further pressure overnight at just over US71c following the RBA Governor’s comments yesterday on interest rates, which moved from a tightening bias to a more neutral stance. Commodities were again mixed with oil and copper firmer and aluminium and gold a little easier.
· The March SPI Futures is indicating the ASX 200 to open 26 points higher towards the 6050 level this morning.
Have a great day!
James & the Market Matters Team
Disclosure
Market Matters may hold stocks mentioned in this report. Subscribers can view a full list of holdings on the website by clicking here. Positions are updated each Friday, or after the session when positions are traded.
Disclaimer
All figures contained from sources believed to be accurate. Market Matters does not make any representation of warranty as to the accuracy of the figures and disclaims any liability resulting from any inaccuracy. Prices as at 07/02/2019
Reports and other documents published on this website and email (‘Reports’) are authored by Market Matters and the reports represent the views of Market Matters. The MarketMatters Report is based on technical analysis of companies, commodities and the market in general. Technical analysis focuses on interpreting charts and other data to determine what the market sentiment about a particular financial product is, or will be. Unlike fundamental analysis, it does not involve a detailed review of the company’s financial position.
The Reports contain general, as opposed to personal, advice. That means they are prepared for multiple distributions without consideration of your investment objectives, financial situation and needs (‘Personal Circumstances’). Accordingly, any advice given is not a recommendation that a particular course of action is suitable for you and the advice is therefore not to be acted on as investment advice. You must assess whether or not any advice is appropriate for your Personal Circumstances before making any investment decisions. You can either make this assessment yourself, or if you require a personal recommendation, you can seek the assistance of a financial advisor. Market Matters or its author(s) accepts no responsibility for any losses or damages resulting from decisions made from or because of information within this publication. Investing and trading in financial products are always risky, so you should do your own research before buying or selling a financial product.
The Reports are published by Market Matters in good faith based on the facts known to it at the time of their preparation and do not purport to contain all relevant information with respect to the financial products to which they relate. Although the Reports are based on information obtained from sources believed to be reliable, Market Matters does not make any representation or warranty that they are accurate, complete or up to date and Market Matters accepts no obligation to correct or update the information or opinions in the Reports. Market Matters may publish content sourced from external content providers.
If you rely on a Report, you do so at your own risk. Past performance is not an indication of future performance. Any projections are estimates only and may not be realised in the future. Except to the extent that liability under any law cannot be excluded, Market Matters disclaims liability for all loss or damage arising as a result of any opinion, advice, recommendation, representation or information expressly or impliedly published in or in relation to this report notwithstanding any error or omission including negligence.