Reviewing the MM Growth Portfolio (ASL, MQG, NHF, SGR, CIM, IVC, NAB)
The ASX200 has undoubtedly rallied harder and faster than we expected trading above the upper end of our target range for 2019 in just a few weeks, hence leading us to ask the obvious question – “now what?”. Yesterday the banks led the charge with heavyweights CBA and Westpac both up by around 2%. However the buying was again broad based with over 10% of the ASX200 rallying by over 3% while only 6 stocks fell by the comparable margin, an ongoing sign of a bullish stock market.
My take on why the local market is so strong is a combination of factors best summarised by the below points:
1 – Too many people were short / underweight stocks, like ourselves, leading to an absence of sellers as the rally has gained momentum e.g. we have not considered trimming our overweight banking position but have been looking for value as FOMO creeps into people’s minds (fear of missing out).
2 – As we mentioned yesterday the market has embraced both the Hayne Report and RBA’s altered stance to a more dovish outlook for interest rates – the glass is half full and it’s been painful to fight the momentum. Remember our elastic band analogy, we are getting stretched on the upside but as we saw with the growth trade of 2017 things can go much higher than logic would foretell before they snap back.
3 – It also feels to me that Traders / Hedge Funds have been unwinding the “Short SPI Futures / Long S&P spread trade” which can be very bullish for the underlying ASX200 i.e. the local market may finally outperform the US in 2019 for the first time in over a decade.
I have spoken to a number of money managers this week and the common theme has been we’ve got a decent cash position looking for the next pullback to buy - each conversation has made me more uneasy. We remain very comfortable with a call that US stocks are set for a decent correction but may have a lesser impact on our rampaging index then initially expected – in February, before last night’s action the ASX200 was up almost 4% compared to the US which was up less than 1%, that’s outperformance – a 5 or 6% pullback by US indices may only produce a 2-3% correction here considering the above.
I would like to reiterate that while we continue to target a US led pullback over the weeks ahead we believe this strong rebound from Decembers panic selling has months further to unfold – at this stage the second part of this sentence is looking far more on the money!
MM remains in “buy mode “due to both our market view and relatively large cash position.
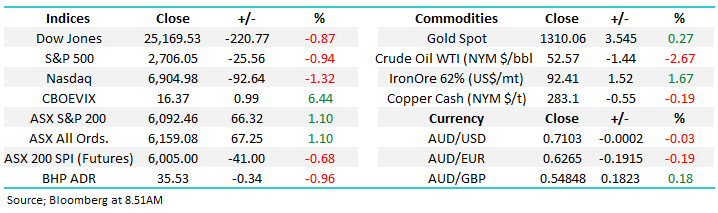
Overnight US markets were weaker led by the NASDAQ which closed down -1.3%, the SPI is implying the ASX200 will open down 30-points / 0.5%.
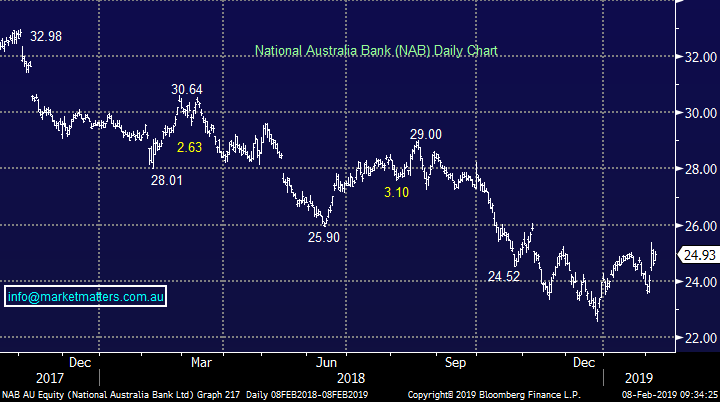
**NAB quarterly update**; After market yesterday NAB came out with news that both their Chairman and CEO would depart, largely as a consequence of their performance under the Royal Commission. They also brought forward their quarterly trading update which was scheduled for today;
Long term banker Phil Chronican will act as interim CEO.
In terms of the trading update they delivered 1Q19 cash profit of $1.65B, which was flat from 2H18 to 1Q19. There was some loan growth offset by a decline in their margins, a similar trend to CBA although NABs more pronounced. They’re doing a good job in terms of expenses which were down 3% over the period while their bad debt charge continued to be low at $193m. Capital CET1 was 10% at the end of December 2018 which pits them on track to achieve their ‘unquestionably strong’ level of 10.5% at the end of FY19. We remain bullish NAB
NAB (ASX:NAB) Chart
Today we are going to review the MM Growth Portfolio’s cash position as a few of our positions hit our sell areas but conversely the MM ideal buy levels are vanishing in the rear view mirror! This has been a relatively uncomfortable week for MM because although we have been invested in the correct stocks / sectors our cash levels have become too high as we took profit into recent strength while the market continued to surge - gaining almost 13% in just 7-weeks. That said, looking at the performance of the portfolio into the recent bounce, does show that holding high cash, as long as we’re in the right sectors can yield reasonable results.
Pink line is the ASX 200 accumulation index, black line is the portfolio.
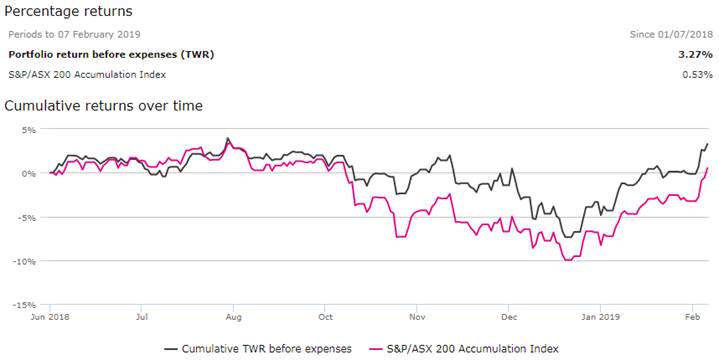
NB: The above tracks the MM High Conviction Active SMA which is available for investment – while this is based on the MM Growth Portfolio, at times there may be slight variances. Click here for more information
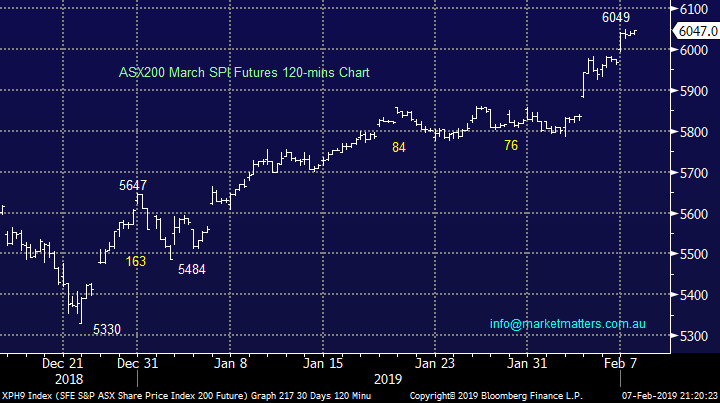
Below I have used the March SPI futures to illustrate the recent moves of the ASX200 because it takes into account future dividends unlike the index which often gaps lower when say CBA goes ex-dividend in a few days’ time. There are around ~60 points worth of dividends coming out of the market before March Futures expire.
ASX200 March SPI Futures Chart
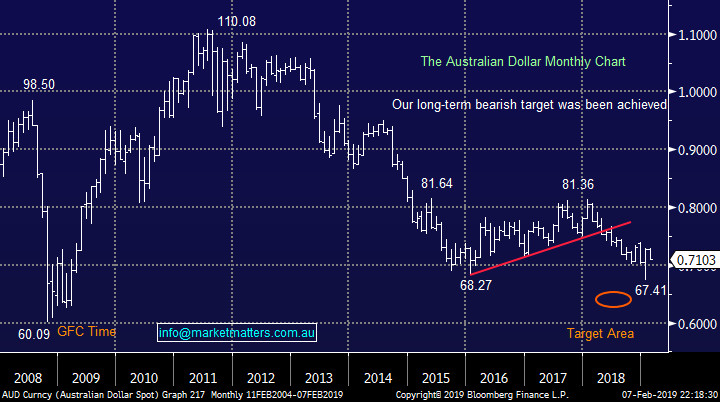
The little “Aussies Battler” continues to have a tough February flirting with 71c overnight after nudging 73c only a few days ago.
We remain comfortable with our medium-term view that the risks remain to the upside for the $A, perhaps a few “large players” share this $A opinion and hence find the local market relatively cheap from an unhedged perspective i.e. buy Australian shares today and if the $A does reach 80c in the next few years a US fund manager would be ahead 10% from a simple currency perspective.
Australian Dollar ($A) Chart
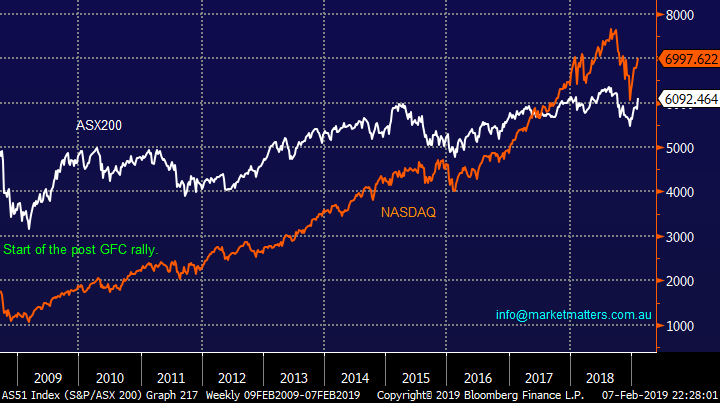
To give more perspective, since the post GFC bull market started back in 2009 the ASX200 is up 95% compared to the NASDAQ’s almost 600% - a little “mean reversion” is easy to comprehend but it may have an enormous short term impact on the ASX200.
NB I have not used the NASDAQ to make a point just because it’s the best performing index but it also has the closest numerical index to the ASX200 – the Dow has also gained close to 300% over the same period.
The ASX200 v NASDAQ Chart
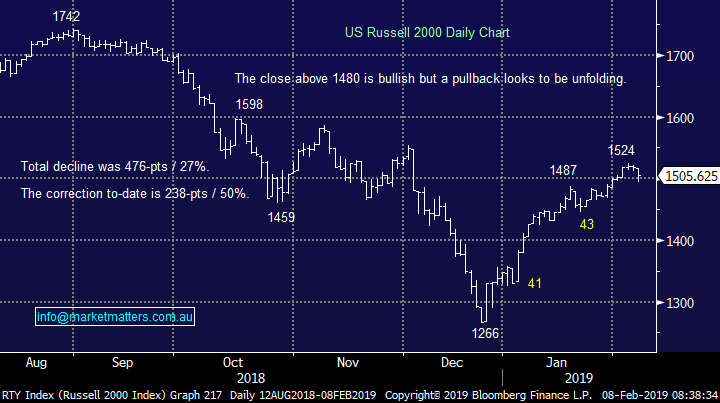
We feel US markets now have a strong risk to the downside with our target ~5-6% lower.
US S&P500 Chart
Where now with MM Growth Portfolio?
We have felt a touch uncomfortable this week watching a market surge higher when we anticipated a pullback for a solid buying opportunity – a common feeling on trading desks this week it appears.
As discussed earlier we see US stocks falling at least 5-6% over the coming weeks raising the question should we be patient and look for better buying levels or start putting some of our cash to work now. Overnight global markets started to get the “wobbles” we have been expecting with the Dow retreating almost 400-points before bouncing ~170 from the lows. However as we all know just because an index rises / falls doesn’t mean individual shares will necessarily follow suit, we remain bullish the market into at least mid-2019 and hence need to focus on accumulating stocks we like at optimum levels.
Today I have updated our thoughts on 6 local stocks we are watching carefully with a view to buying with our large 33% cash position.
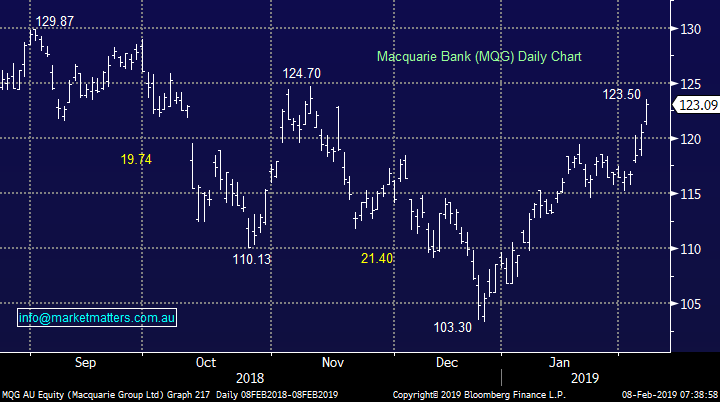
1 Macquarie Group (MQG) $123.09
We remain bullish MQG targeting fresh highs above $130 but this is now only ~6% away.
However the “silver donut” is highly correlated to the US market and if we see a ~5% pullback in the S&P500 a better entry level may present itself with MQG.
MM now likes MQG from a risk / reward perspective around $115.
Macquarie Group (ASX: MQG) Chart
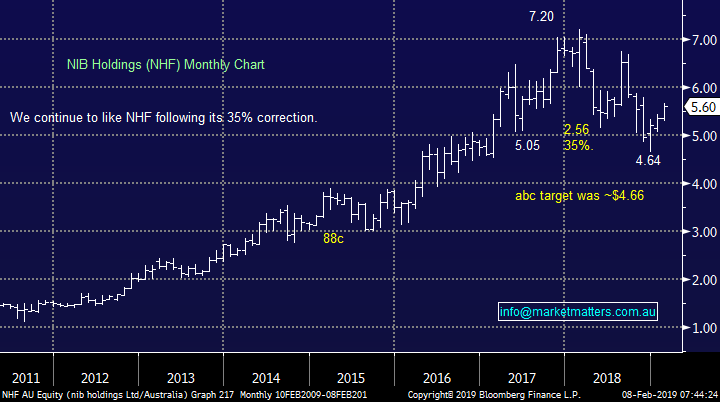
2 NIB Holdings (NHF) $5.60
NIB has rallied strongly tracking the ASX200 higher since its December low but does now look / feel overdue a correction.
MM likes NHF with an ideal entry level around $5. 20.
NIB Holdings (ASX: NHF) Chart
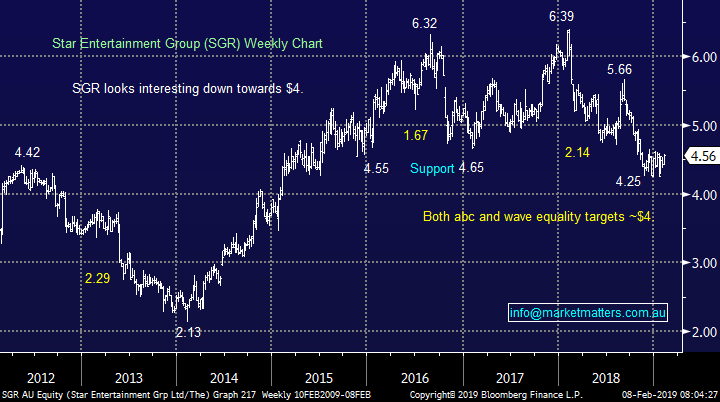
3 Star Entertainment (SGR) $4.56
Star has not embraced the recent strength in local stocks which is a concern short-term hence we intend to remain pedantic with our targeted $4-$4.10 buy area.
MM still likes SGR around the $4 region.
Star Entertainment (ASX: SGR) Chart
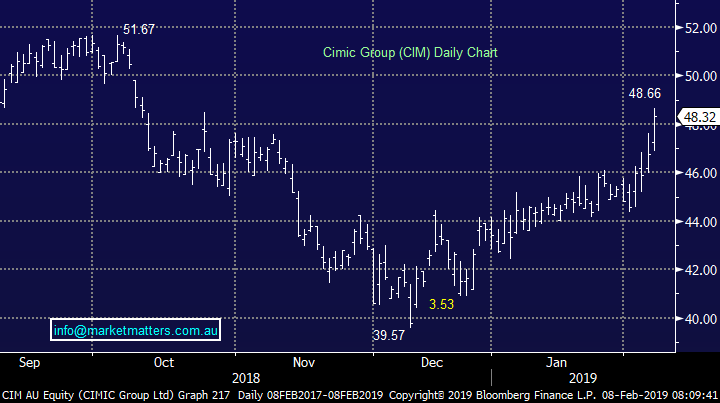
4 CIMIC Group (CIM) $48.329
CIM delivered an excellent report for the last calendar year with net profit coming in up 11% to $781m.
We like this global construction group especially since they strengthened their balance sheet and started delivering improving earnings. Guidance for FY19 was fine and they generally under promise / over deliver.
MM now likes CIM around the $45 area.
CIMIC Group (ASX: CIM) Chart
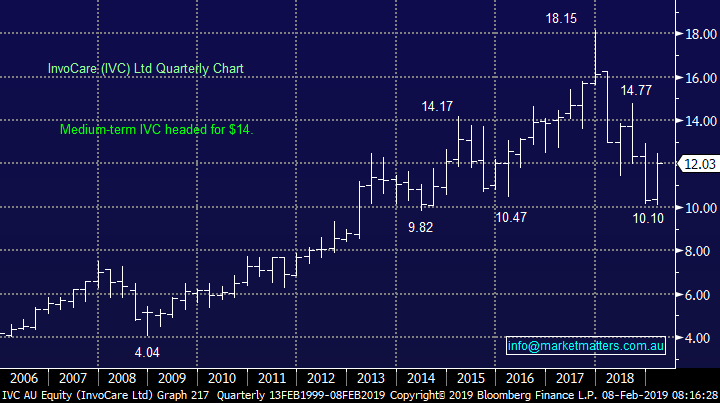
5 Invocare (IVC) $12.03
We have had IVC on our radar for a while, this funeral operator is often regarded as a defensive stock that will do its own thing which suits our view for stocks into the second half on 2019.
MM now likes IVC from around $11.50.
Invocare (ASX: IVC) Chart
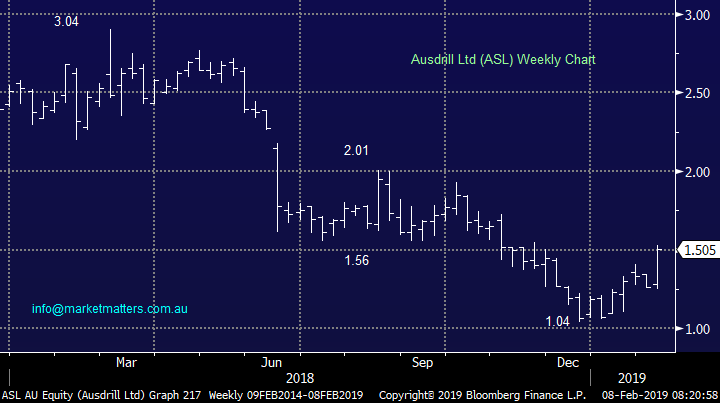
6 Ausdrill (ASL) $1.50
Ausdrill has been kicking goals on the business front this year by winning some excellent new contracts e.g. $171m in late January. We believe this mining services stock is well positioned for 2019 with a target around $2, or 30% higher.
MM now likes ASL at current levels.
NB volumes in this stock can be an issue
Ausdrill (ASX: ASL) Chart
Conclusion
MM is considering the following stocks as potential buys in the weeks to come:
Bullish today – Ausdrill (ASL)
Bullish from lower levels – Macquarie Group, NIB Holdings, Star Entertainment, CIMIC Group and Invocare (IVC).
Overnight Market Matters Wrap
· The US-China Trade concerns reignited, leading the broad global equity markets to sell off as it was reported that trade talks were still a long way from being resolved.
· Across to the Euro region, the German market was the hardest hit, dropping 2.7%, after the EU cut growth forecasts for this year from 1.9% to 1.3% .The UK market dropped 1.1% following the Bank of England warning UK growth would be the lowest in a decade at 1.2% as Brexit concerns bite. There are few signs the EU is prepared to budge on the previously agreed terms, following further discussions with UK Prime Minister May overnight as she tries to renegotiate revised terms which would be backed by the UK parliament as the end of March deadline looms.
· BHP is expected to give some of its recent gains, on the back of the trade concern and after ending its US session down an equivalent of -0.96% from Australia’s previous close.
· The March SPI Futures is indicating the ASX 200 to open 23 points lower, testing the 6070 level this morning.
Have a great day!
James & the Market Matters Team
Disclosure
Market Matters may hold stocks mentioned in this report. Subscribers can view a full list of holdings on the website by clicking here. Positions are updated each Friday, or after the session when positions are traded.
Disclaimer
All figures contained from sources believed to be accurate. Market Matters does not make any representation of warranty as to the accuracy of the figures and disclaims any liability resulting from any inaccuracy. Prices as at 08/02/2019
Reports and other documents published on this website and email (‘Reports’) are authored by Market Matters and the reports represent the views of Market Matters. The MarketMatters Report is based on technical analysis of companies, commodities and the market in general. Technical analysis focuses on interpreting charts and other data to determine what the market sentiment about a particular financial product is, or will be. Unlike fundamental analysis, it does not involve a detailed review of the company’s financial position.
The Reports contain general, as opposed to personal, advice. That means they are prepared for multiple distributions without consideration of your investment objectives, financial situation and needs (‘Personal Circumstances’). Accordingly, any advice given is not a recommendation that a particular course of action is suitable for you and the advice is therefore not to be acted on as investment advice. You must assess whether or not any advice is appropriate for your Personal Circumstances before making any investment decisions. You can either make this assessment yourself, or if you require a personal recommendation, you can seek the assistance of a financial advisor. Market Matters or its author(s) accepts no responsibility for any losses or damages resulting from decisions made from or because of information within this publication. Investing and trading in financial products are always risky, so you should do your own research before buying or selling a financial product.
The Reports are published by Market Matters in good faith based on the facts known to it at the time of their preparation and do not purport to contain all relevant information with respect to the financial products to which they relate. Although the Reports are based on information obtained from sources believed to be reliable, Market Matters does not make any representation or warranty that they are accurate, complete or up to date and Market Matters accepts no obligation to correct or update the information or opinions in the Reports. Market Matters may publish content sourced from external content providers.
If you rely on a Report, you do so at your own risk. Past performance is not an indication of future performance. Any projections are estimates only and may not be realised in the future. Except to the extent that liability under any law cannot be excluded, Market Matters disclaims liability for all loss or damage arising as a result of any opinion, advice, recommendation, representation or information expressly or impliedly published in or in relation to this report notwithstanding any error or omission including negligence.