Volatility escalates as reporting season unfolds (CWY, BIN, BRG, MFG, AMP, SUN, PGH, ORA)
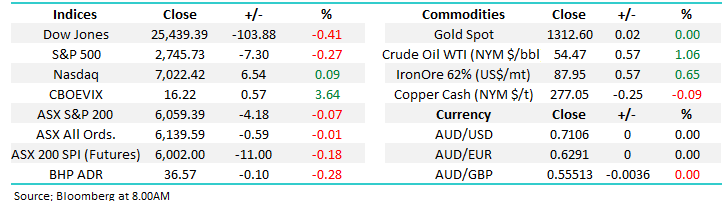
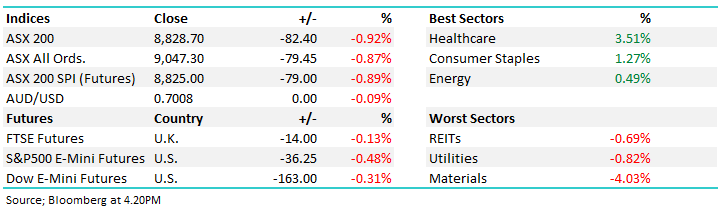
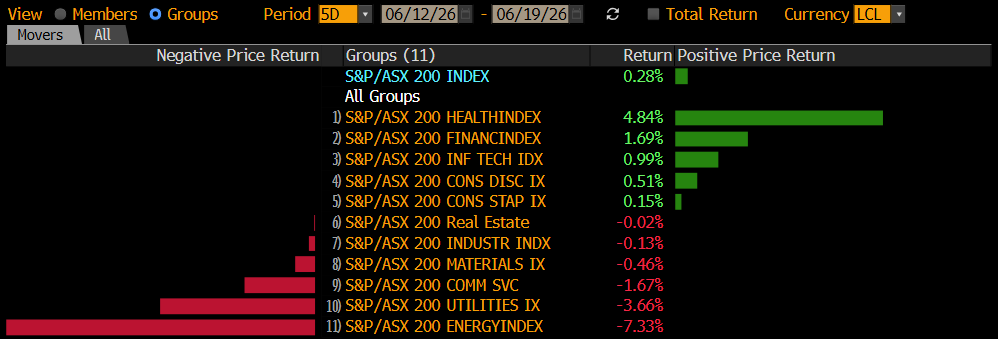
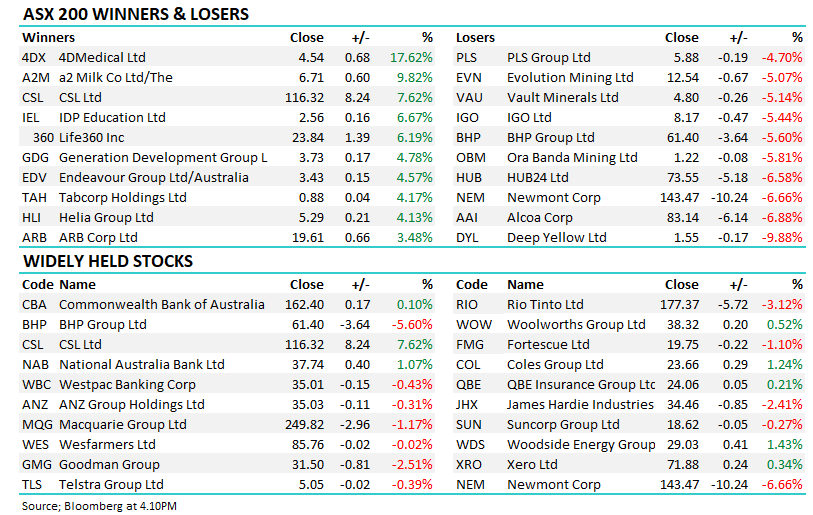
The ASX200 disappointed a few bulls again yesterday failing to make any headway even after another strong night on Wall Street, plus we enjoyed another excellent day for our large cap resources. The fallout from reporting season caught most people’s attention and they were net negative for the index but there were some cracker results that should maintain investors faith in the local market i.e. while AMP -7.8%, Suncorp (SUN) -3.8% and Telstra (TLS) -2.2% weighed on the index Breville Group (BRG) +18%, Cleanaway Waste (CWY) +13.1% and Magellan (MFG) +9.9% hit the ball out of the park.
Considering the banking sector has been under pressure over the last 5-trading days the broad index has held up reasonably well, drifting less than 1% after dividends e.g. heavyweights NAB and Westpac are down well over -2.5% while the regionals have been smashed led by Bendigo bank (BEN) which has fallen -13%. The theme for what little we have seen of 2019 has been stock / sector rotation with noticeable follow through in both directions common place after both good and bad results.
MM remains in “buy mode “due to both our medium-term market view and relatively large cash position.
Overnight US markets were mixed with the broad market down but the tech based NASDAQ marginally higher. US Retails Sales experienced its worst drop in 9-years potentially a nail that may reignite recession fears for 2019 / 2020 but certainly good news that rates are unlikely to rise anytime soon.
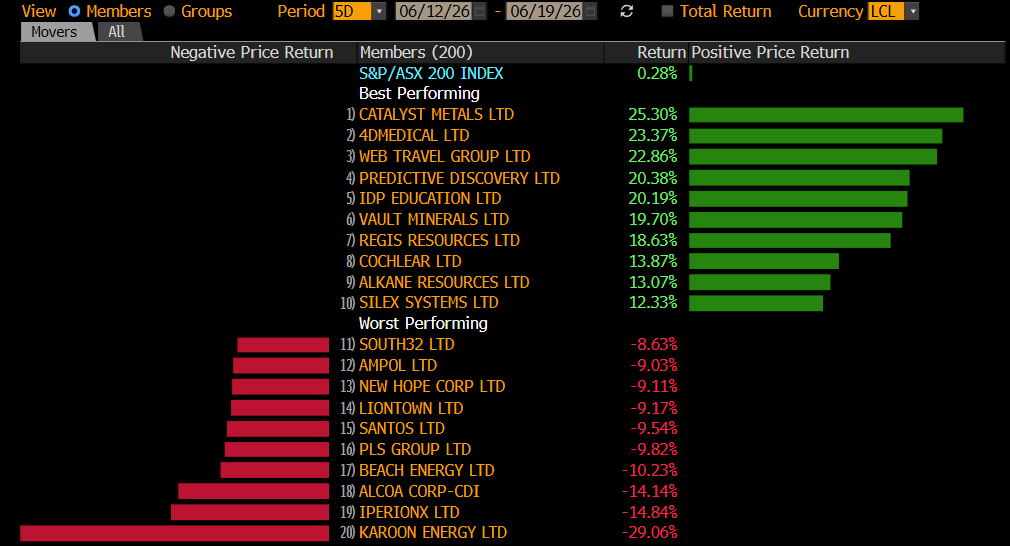
Today we are going to evaluate 3 of the best and worst stocks of the week to see if there’s still room to jump on the winners, or dare to catch the falling knife with the losers.
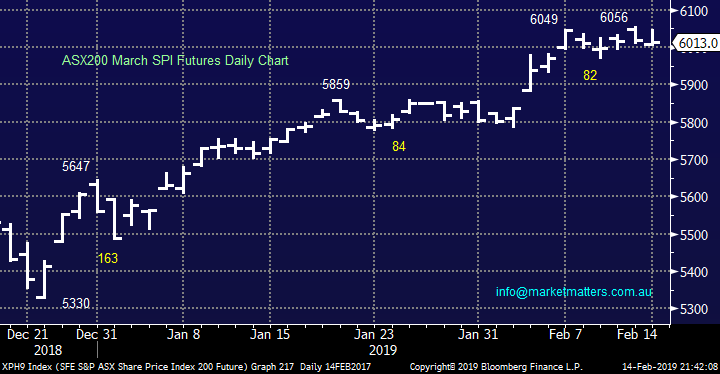
ASX200 March SPI Futures Chart
Overseas indices
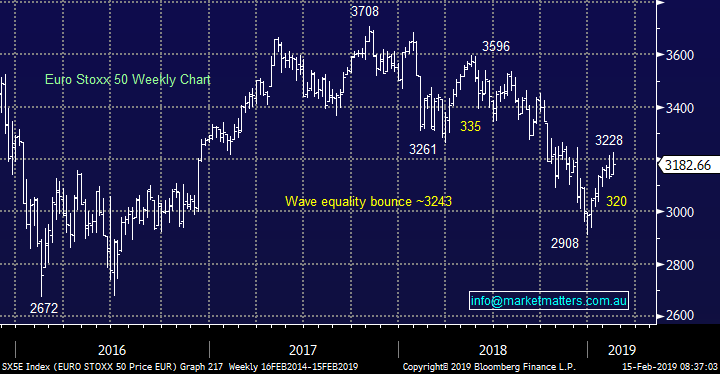
The local market has been far more correlated with European indices than the US post the GFC and importantly following the markets 11% recovery we are now neutral / bearish from a risk / reward basis.
This reaffirms our believe that patience is likely to be rewarded with buying of the market in general – obviously not necessarily on a stock by stock basis.
Euro Stoxx 50 Chart
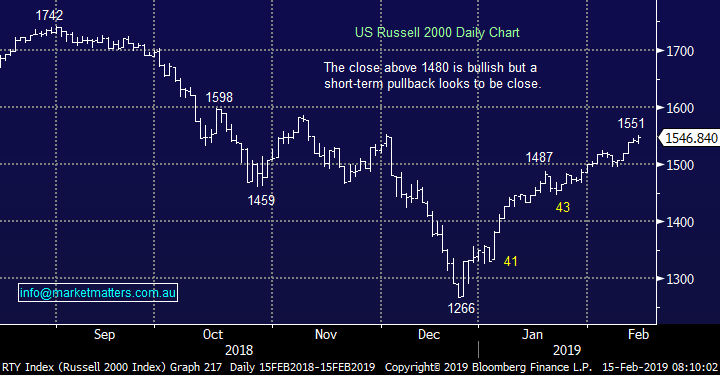
No change with US markets, we still believe they have a strong risk to the downside with our target ~5-6% lower. The upside momentum is clearly waning and a lot of good news has been baked into the recent index appreciation.
US Russell 2000 Chart
3 of the best performing stocks.
There has been much written over the last year about buying stocks that report well because they are usually higher a few months down the track but we must also be mindful in some instances we get rapid reversals and significant losses are accrued very quickly. As we often say human psychology doesn’t help us make money i.e. Investors generally like to buy what’s perceived to be cheap as opposed to jumping on board an already rising market but remember the famous quote by Baron Rothschild:
“I will tell you my secret if you wish. It is this: I never buy at the bottom and I always sell too soon.” – Baron Rothschild.
NB Like ourselves he’s happy to be seller of stocks.
Hence with the 3 stocks below we are considering if / where we should consider buying after their recent stellar performance.
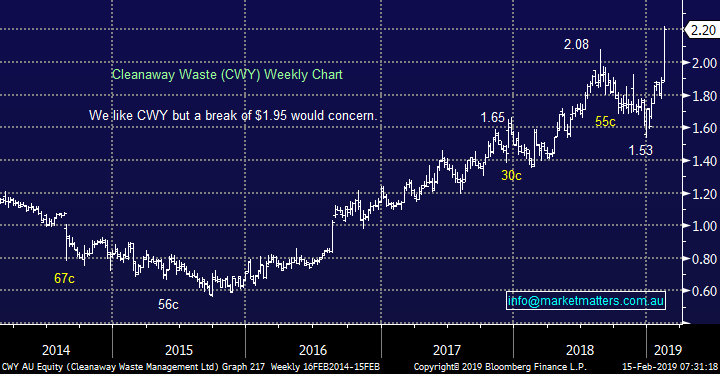
1 Cleanaway Waste (CWY) $2.20
Yesterday CWY rallied an impressive 13% following an excellent report where they delivered a greater than 46% increase in gross revenue and a 52.6% increase in net profit after tax (NPAT) to$60.8m. While the result was good, the guidance was key and they expect more good times ahead. We like this result of course, and the general waste management sector but following the appreciation in CWY we question if there’s more value in sector alternative Bingo Industries.
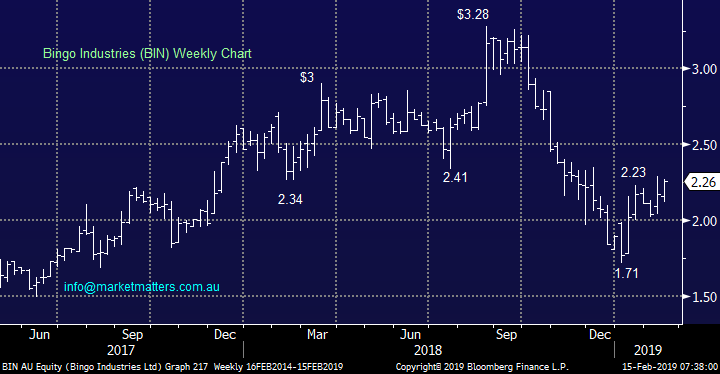
There respective valuations are certainly food for thought – CWY is trading on an Est P/E for 2019 of 32.8x compared to BIN on 19.8x for the same period. BIN of course have the overhang from the muted Dial-a-Dump acquisition with a decision by the ACCC expected later this month. If they can’t proceed, expect a big buy-back which would support the share price.
MM likes both companies but prefers BIN at current levels, whereas CWY around $2.10 would catch our eye 4-5% lower.
Cleanaway Waste (ASX: CWY) Chart
Bingo Industries (ASX: BIN) Chart
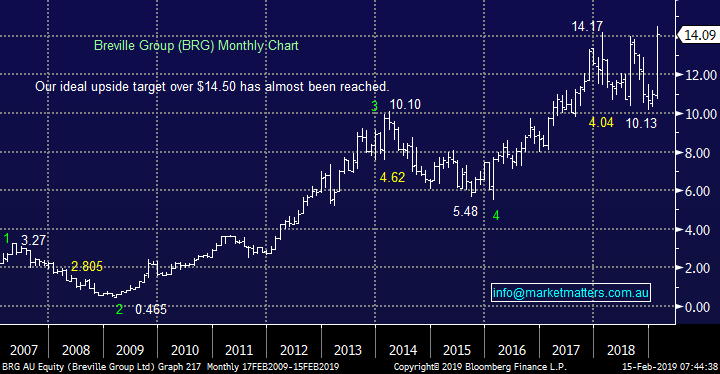
2 Breville Group (BRG) $14.09
The homeware distributor BRG saw strong growth in the first half with adjusted net profit after tax (NPAT) up 14.8% beating the markets expectations driven by some impressive revenue growth, propelling the stock to a fresh all-time high.
Successful expansion into Germany and Austria helped boost the result, with European sales up over 30%. Coffee was also a big driver of growth as global consumption soars. The company continues to perform in a tough macro environment. A quality operator that is executing well in the tough conditions they can control. Guidance for the full year is for EBIT growth “to be slightly higher than the market’s current consensus of ~11%,” hard to interpret that as anything but a beat.
Technically the close above $14 looks like a break out as the stock charters new territory at all-time highs, but we are wary having had the $14.50 target for a while – we avoided the stock due to our general and founded concerns around the retail environment for their products.
MM would be considering taking some $$ off the table at current levels.
Breville Group (ASX: BRG) Chart
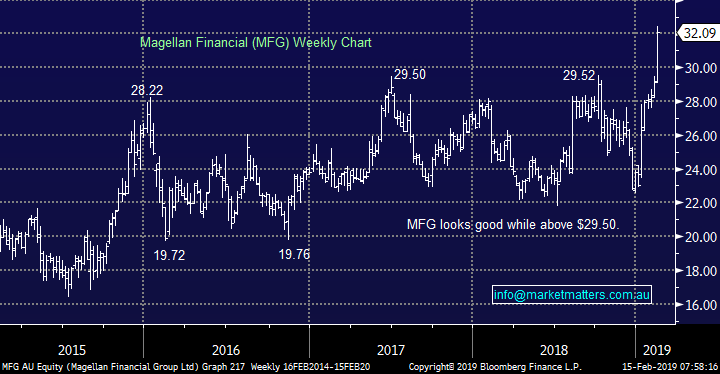
3 Magellan Financial (MFG) $32.09
Magellan like Breville has showed the market how a quality company can perform well in tough sector conditions. The fund manager produced an increase in 1H NPAT of 62% to $176.3m largely down to a 35% increase in funds under management (FUM) which is now well above $70bn. Huge!
Technically a stock breaking out to new all-time highs always looks good with the caveat that we see no failure, in the case of MFG that would be triggered by a close back below $29.50.
MM is neutral / positive MFG at current levels.
Magellan Financial (ASX: MFG) Chart
3 of the worst performing stocks.
There’s a pretty unsavoury saying in the market about the result of ‘picking bottoms” in stocks but at times it can prove very profitable if well thought out and planned.
As we often say the elastic band does regularly become too stretched but its an investors job to identify where the value and risk/reward becomes compelling enough to take on the panicking bears.
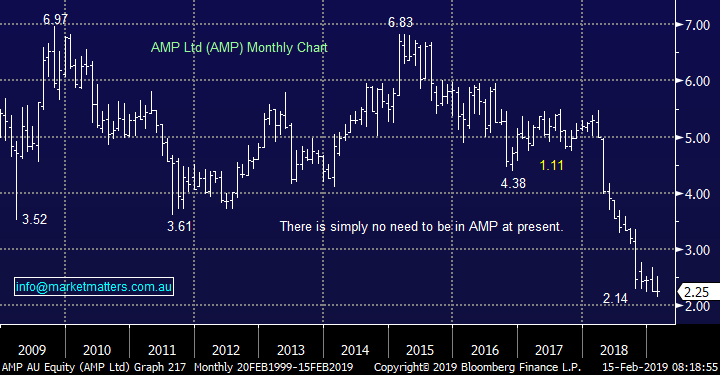
1 AMP (AMP) $2.25
AMP released its results yesterday and although their underlying profit number was ‘sort of’ in-line with market expectations (although at the lower end) the trends were poor. Falling revenue, higher costs, big outflows and a massive image problem that will be hard to turn. AMP shares will undoubtedly bounce a few times in 2019 but at this stage to us its simply too hard.
MM still sees no reason to run the AMP gauntlet.
AMP Ltd (ASX: AMP) Chart
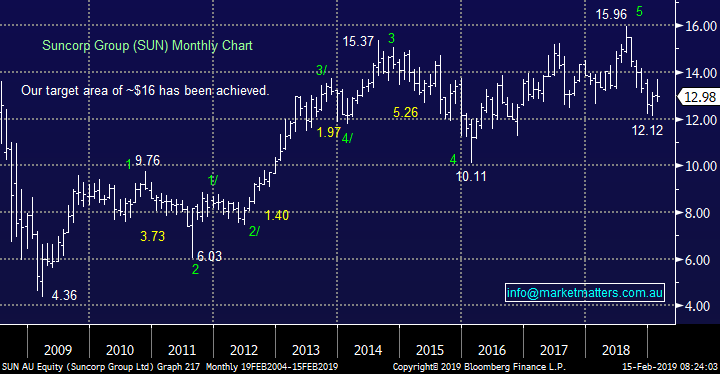
2 Suncorp (SUN) $12.98
SUN fell -3.8% yesterday following the release of its half year results. Half year (underlying) net profit was a beat to expectations however the trends in the banking division were poor. Loan growth is weak and funding costs have risen putting pressure on margins. The regionals don’t have the deposit growth the majors have which is having a decent impact on costs
Technically SUN has been dancing our tune over recent years hence until further notice we will continue to stick with our roadmap – we continue to target ~$10 for SUN.
MM remains net bearish SUN.
Suncorp (ASX: SUN) Chart
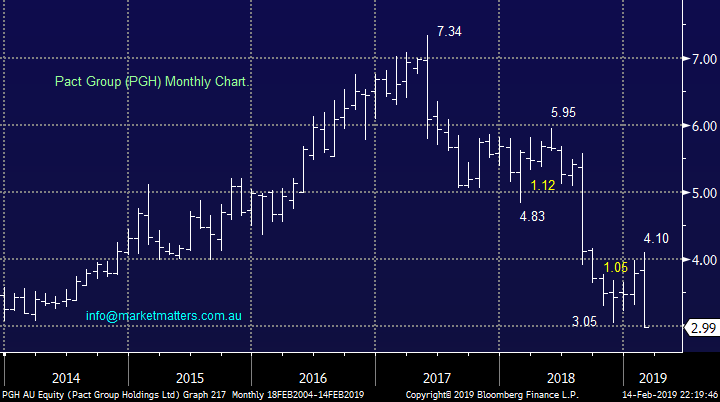
3 Pact Group (PGH) $2.99
We’ve been discussing Pact Group (PGH) a little over recent weeks with a target below $3 to consider buying the out of favour packaging business.
The company’s shares are down -27% from this month’s high following a very disappointing half-year earnings guidance
The shares are now trading on a P/E for 2019 of 12.4x while yielding an estimated 7.7% which is 65% franked, however the downside momentum appears entrenched
PGH remains on the radar, but not yet a buy
Pact Group (ASX: PGH) Chart
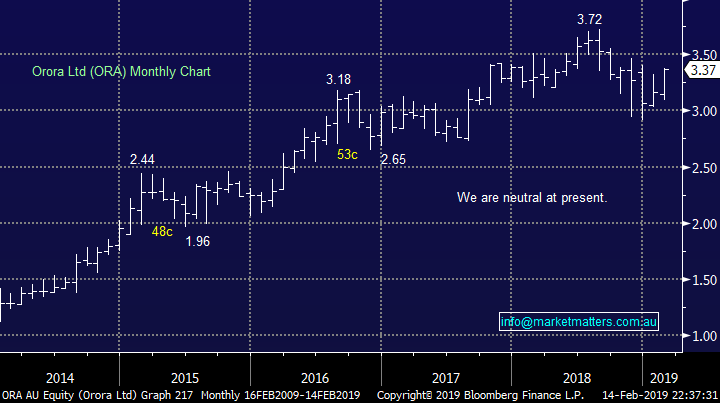
Conversely Australian packaging rival Orora (ORA) has enjoyed a far healthier time following the announcement of its own half-year results which showed a 9.9% increase in revenue and a 7.6% increase in NPAT plus a subsequent 8.3% increase in its dividend. ORA shares are up over 8% over the last 5-days.
ORA is now trading on a P/E for 2019 of 18.2x while yielding an estimated 3.5% which is 50% franked. The question is whether a 50% higher valuation of ORA over PGH is too much, or not yet enough. I believe we may see a little switching between the two in the weeks /months ahead.
MM believes ORA may struggle ~$3.50 from both a technical and valuation perspective.
Orora Ltd (ASX: ORA) Chart
Conclusion
Unfortunately nothing jumped out at us today in dramatic fashion although we will be watching Pact Group below $3, CWY if it pulls back towards $2.10 and BIN carefully.
Overnight Market Matters Wrap
· The SPI is down 11 points after a choppy session in the US. The Dow fell ~100 points, while the S&P 500 and the NASDAQ were close to flat.
· Very weak retail sales data saw US stocks trading in the red early in the day before paring most of those losses as the day progressed. Some brushed off the data as an aberration, while others are worried it is a sign of weakening growth.
· Meanwhile, US-China trade negotiations aren’t going as well as hoped with reports of the Chinese pushing back on structural reforms to the economy. Trump may consider postponing the March 1 deadline for another 60 days.
· LME metals were weaker, while iron ore rallied over 1%. Oil also rallied and gold is trading around $US1315/oz.
Have a great day!
James & the Market Matters Team
Disclosure
Market Matters may hold stocks mentioned in this report. Subscribers can view a full list of holdings on the website by clicking here. Positions are updated each Friday, or after the session when positions are traded.
Disclaimer
All figures contained from sources believed to be accurate. Market Matters does not make any representation of warranty as to the accuracy of the figures and disclaims any liability resulting from any inaccuracy. Prices as at 15/02/2019
Reports and other documents published on this website and email (‘Reports’) are authored by Market Matters and the reports represent the views of Market Matters. The MarketMatters Report is based on technical analysis of companies, commodities and the market in general. Technical analysis focuses on interpreting charts and other data to determine what the market sentiment about a particular financial product is, or will be. Unlike fundamental analysis, it does not involve a detailed review of the company’s financial position.
The Reports contain general, as opposed to personal, advice. That means they are prepared for multiple distributions without consideration of your investment objectives, financial situation and needs (‘Personal Circumstances’). Accordingly, any advice given is not a recommendation that a particular course of action is suitable for you and the advice is therefore not to be acted on as investment advice. You must assess whether or not any advice is appropriate for your Personal Circumstances before making any investment decisions. You can either make this assessment yourself, or if you require a personal recommendation, you can seek the assistance of a financial advisor. Market Matters or its author(s) accepts no responsibility for any losses or damages resulting from decisions made from or because of information within this publication. Investing and trading in financial products are always risky, so you should do your own research before buying or selling a financial product.
The Reports are published by Market Matters in good faith based on the facts known to it at the time of their preparation and do not purport to contain all relevant information with respect to the financial products to which they relate. Although the Reports are based on information obtained from sources believed to be reliable, Market Matters does not make any representation or warranty that they are accurate, complete or up to date and Market Matters accepts no obligation to correct or update the information or opinions in the Reports. Market Matters may publish content sourced from external content providers.
If you rely on a Report, you do so at your own risk. Past performance is not an indication of future performance. Any projections are estimates only and may not be realised in the future. Except to the extent that liability under any law cannot be excluded, Market Matters disclaims liability for all loss or damage arising as a result of any opinion, advice, recommendation, representation or information expressly or impliedly published in or in relation to this report notwithstanding any error or omission including negligence.