Reporting season is almost in the rear view mirror (PGH, EHL, APX, APT, QBE, GEM, OML, LLC)
Yesterday the ASX200 had a fairly lacklustre day considering the positive tailwinds the market enjoyed i.e. the Dow was up 181-points on Friday night, President Trump announced the deadline for his tariffs with China was to be extended, implying an agreement was close, and the net index impact from the days companies reporting was positive yet the market struggled to close up 19-points having been in the red at 3pm. On the sector level the financials and Software & Services were strong, while the consumer services and real estate sectors weighed on the index.
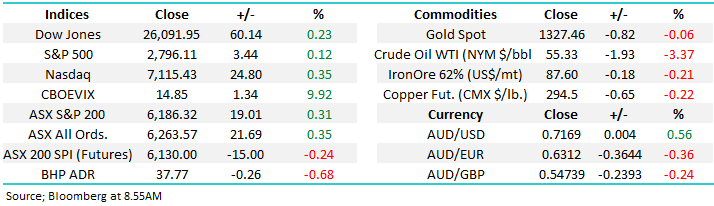
Remember the simple range statistics we’ve quoted over recent weeks – in December and January the SPI futures recovered 375-points and 376-popints respectfully from their monthly lows, now February has put in a slightly better effort of 382-points but this implies assuming the market remains in the same rhythm of the last few months its time for a breather on the upside.
MM’s ideal scenario remains a pullback of around 165-points from the current area and we will be looking to buy this move, at least short-term i.e. around 3%, back towards the psychological 6000-area.
MM remains in a patient “buy mode” with relatively elevated cash levels.
Overnight US markets were firm but not strong following Trumps announcement around tariffs with the Dow gaining 60-points but closing 150-points below its intra-day high. The SPI is calling the ASX200 to open down 15-points with BHP down ~1% in the US. The tariff situation now looking like a buy the rumour, sell the fact sort of scenario.
Today we are again going to evaluate 3 of the best and worst stocks from yesterday as the local reporting season matures like a good bottle of red.
ASX200 March SPI Futures Chart
Two stocks MM is considering for our “dogs position” had small pullbacks yesterday and remain very much on our watch list.
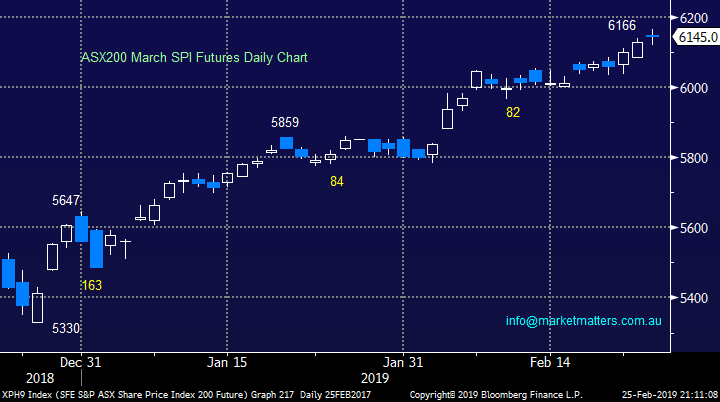
Pact Group (PGH) $2.80
Packaging business PGH fell -2.1% yesterday towards the $2.70 area where the stock becomes interesting for a small position.
Pact Group (ASX: PGH) Chart
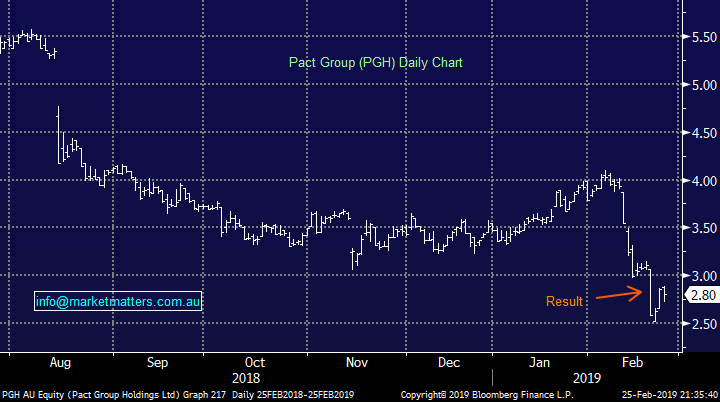
Emeco Holdings (EHL) $2.32
Similarly earthmoving equipment leaser EHL drifted almost 3% after a few days strong bounce.
We are not as excited by EHL above $2 as we would be below and we should also always remember that stocks that disappoint during reporting season do have a tendency to underperform in the following months hence this is often a more “risky” strategy than buying strong stocks i.e. “if in doubt do nought”.
Emeco Holdings (ASX: EHL) Chart
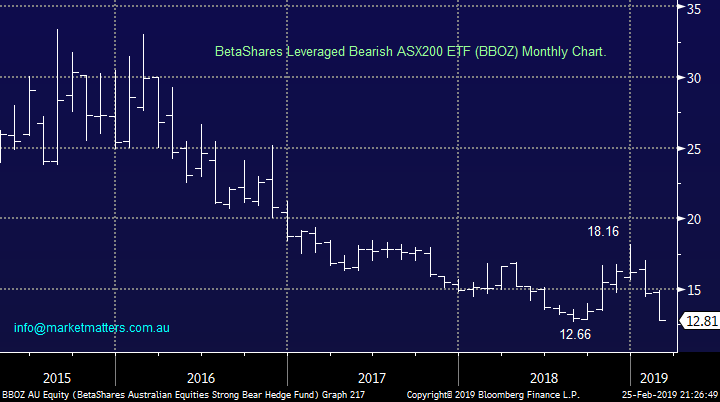
Bearish ASX200 ETF.
MM enjoyed an initial dabble into the bearish ETF space late last year and we can potentially see ourselves applying the same strategy sometime in the months ahead.
Today felt an ideal opportunity to explain the BetaShares leveraged bearish ETF (BBOZ). To illustrate the leverage of the BBOZ:
1 – During the last 5-months of 2018 the ASX200 fell 963-points / 15% but the BBOZ rallied over 40%.
2 – Conversely in 2019 the ASX200 has recovered 781-points / 14.4% but the BBOZ has fallen almost 30%.
The BBOZ is a good vehicle to add value / hedge our Portfolios when we believe the ASX200 is vulnerable to a meaningful correction.
It enables MM to back our stock selection in the face of a market that may have gotten ahead of itself – remember the market corrects over 10% roughly every 2-years and 5% far more regularly.
BetaShares Leveraged Bearish ASX200 ETF (ASX: BBOZ) Monthly Chart
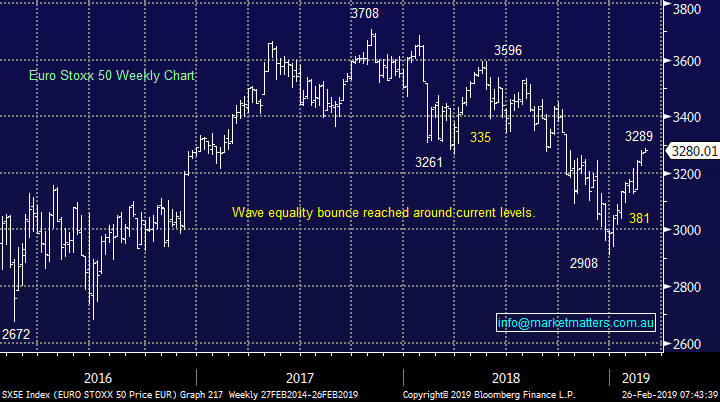
Overseas indices
No change with European indices who have reached more resistance and our target area following their 13% bounce, we are now neutral to bearish from a simple risk / reward basis.
This reaffirms our believe that patience is likely to be rewarded with buying of the market in general – clearly not necessarily on a stock by stock basis.
Euro Stoxx 50 Chart
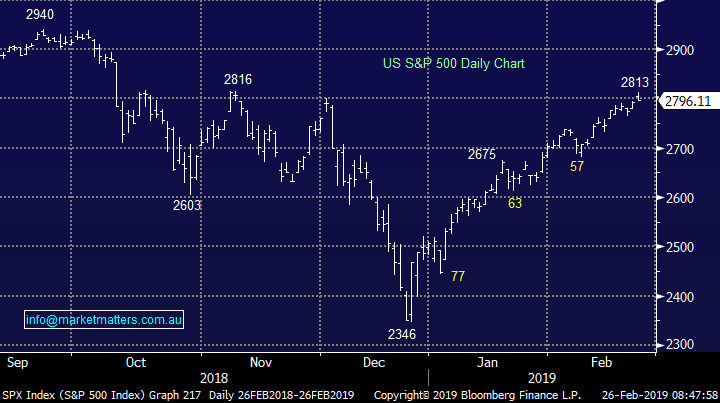
No change with US markets, we still believe they have a strong risk to the downside with our target ~5-6% lower. The upside momentum is feels wanning and a lot of good news has been baked into the recent index appreciation with yesterday’s apparent resolution of the US-China traded war potentially the icing on the cake.
Perhaps a classic “buy on rumour sell on fact” outcome.
US S&P500 Chart
3 of the best performing stocks.
As reporting season tapers off yesterday we saw the 3 stocks rally by over 10% and 7 by over 4%, we have covered 3 of these winners today with an emphasis on stocks we are / or likely to invest in through 2019.
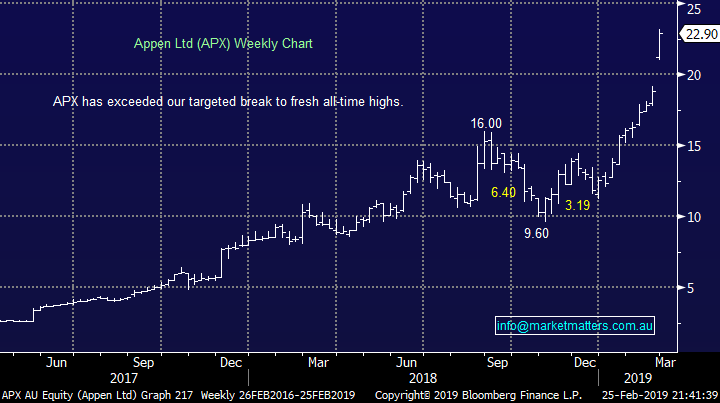
1 Appen (APX) $22.90
As we touched on the afternoon report APX surged higher as it once again delivered a cracking set of results that beat prior guidance while eclipsing market expectations. The market has very few legitimate growth exposures in industries like artificial intelligence and APX is clearly nailing it.
While we bought this stock well at ~$12.50 we clearly took a ~26% profit too early, however at MM we are very prepared to buy back into a stock at a higher price than we sold, investing is about making money and there’s zero room for ego and what ifs. We underestimated the strength of this business and the momentum in its earnings, and while valuations here should always be anchored to growth, its current Est. P/E of 42x for 2019 is not too daunting. Happily this can be a volatile stock with decent corrections of 40% and 23% in the last 6-months alone, we intend to let the dust settle at this stage.
We are bullish APX looking for an opportune risk / reward opportunity to buy.
Appen (ASX: APX) Chart
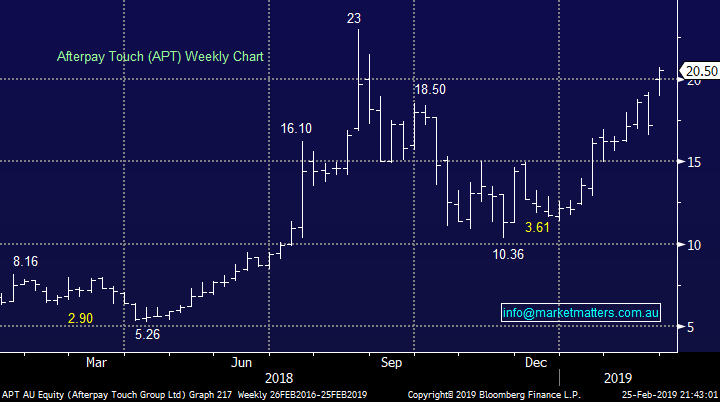
2 Afterpay Touch (APT) $20.50
We covered APT in our “Catching our eye” segment yesterday afternoon following the “buy now pay later” companies 19% lunge higher courtesy of a positive outcome from the senate committee on Friday. The outcome was clearly short term positive for the sector, the main risk was that the BNPL space would be rolled into the National Credit Code requiring more stringent credit checking before any credit could be provided – a huge win in today’s tightening regulatory environment although the issue may raise its head again in the future when the debt levels of our millennials become a huge issue.
Technically APT looks destined for a test of ~$25, or over 20% higher but investors should acknowledge the volatility in both the stock and sector.
MM is bullish APT short-term but is only interested around the $16 area at this stage.
Afterpay Touch (ASX: APT) Chart
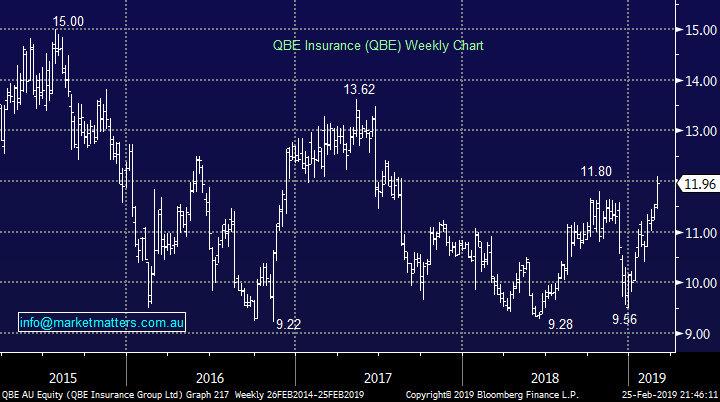
3 QBE Insurance (QBE) $11.96
Initially it looked like another slight miss for QBE but the market rallied after yesterday’s result finally closing up 4% above its high for 2018. The core business is tracking well and signs that the downgrade cycle might be behind them are appearing.
MM is long QBE and happily like our foray into Telstra we are nicely ahead on these “dog” performers since the GFC- timing is an important part of investing. However we are now closer to the sell side here after its solid rally over recent weeks
MM likes QBE around $12 following its result but are likely to exit stage left above $13 which would represent a removal of its 15% valuation discount to global peers.
QBE Insurance (ASX: QBE) Chart
3 of the worst performing stocks.
The losers were a smaller group on the day with only 1 company falling by over 10% although 6 managed to decline by over 4%.
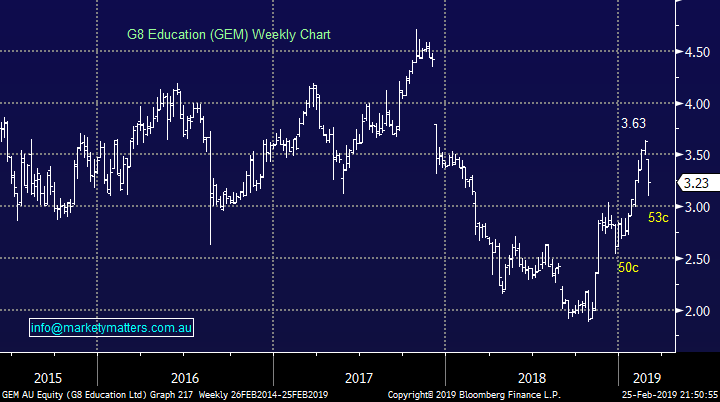
1 G8 Education (GEM) $3.23
Yesterday childcare operator GEM reported its full year numbers and the stock was sold off hard. GEM had rallied strongly into the result so the market was clearly looking for a better set of numbers. While earnings were a slight miss, it was occupancy levels that were the main concern. The company does see some improving dynamics here which is also being shown through other bits of industry data. The main question being whether or not 2018 was trough occupancy in Australian childcare?
MM likes GEM around $3.10. The stock is reasonably cheap (15x) and they’ve got a turnaround under way.
G8 Education (ASX: GEM) Chart
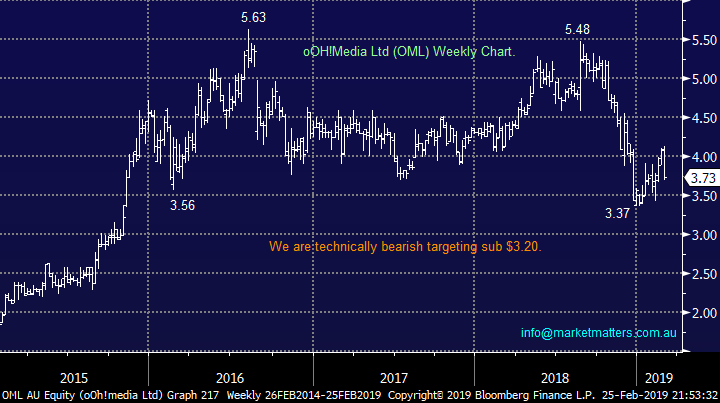
2 oOH!Media Ltd (OML) $3.73
Adverting and marketing business OML was crunched over 8% yesterday, its greatest decline since 2016. Their forecasted earnings came in below analysts expectations although they still see growth in 2019. Revenue was up but so were costs while they are concerned about the looming election driving a number of customers, like the banks, into advertising hibernation.
MM is bearish OML targeting over 10% further downside.
oOH!Media Ltd (ASX: OML) Chart
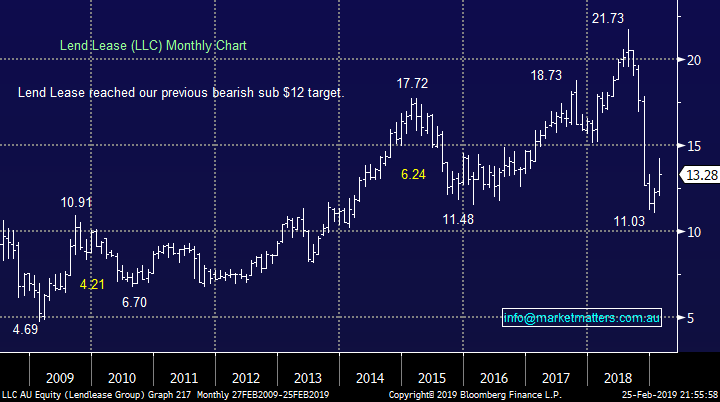
3 Lend Lease (LLC) $13.28
Yesterday LLC fell over 6% following the release of a 96% first half NPAT to under $16m – sort of a here nor there result in terms of profit however it was the focus on the struggling engineering division that attracted most attention. It now seems that LLC are falling on their sword in terms of the struggling division with the board announcing they are looking to sell its flagging engineering group with the estimated restructuring cost coming in around half a billion dollars.
Recently we have seen pressure on earnings in the real estate developer space which surprises nobody who reads the papers. Another decent leg lower in LLC would not surprise.
MM is neutral LLC at present.
Len Lease (ASX: LLC) Chart
Conclusion
The main takeout today is MM is considering selling QBE above $13 and buying GEM under $3.20.
Overnight Market Matters Wrap
· The US equity markets continued its winning streak, with all major indices edging marginally higher overnight as the US-China trade deal remains as the focal point to investors.
· Metals on the LME were mixed with no big moves, while iron ore settled lower, and Crude Oil reacting predictably to US President Trump’s tweet, falling more than 3%.
· BHP is expected to underperform the broader market, after ending its US session down 0.68% from Australia’s previous close.
· The March SPI Futures is indicating the ASX 200 to open 25 points lower towards the 6160 level this morning.
Have a great day!
James & the Market Matters Team
Disclosure
Market Matters may hold stocks mentioned in this report. Subscribers can view a full list of holdings on the website by clicking here. Positions are updated each Friday, or after the session when positions are traded.
Disclaimer
All figures contained from sources believed to be accurate. Market Matters does not make any representation of warranty as to the accuracy of the figures and disclaims any liability resulting from any inaccuracy. Prices as at 26/02/2019
Reports and other documents published on this website and email (‘Reports’) are authored by Market Matters and the reports represent the views of Market Matters. The MarketMatters Report is based on technical analysis of companies, commodities and the market in general. Technical analysis focuses on interpreting charts and other data to determine what the market sentiment about a particular financial product is, or will be. Unlike fundamental analysis, it does not involve a detailed review of the company’s financial position.
The Reports contain general, as opposed to personal, advice. That means they are prepared for multiple distributions without consideration of your investment objectives, financial situation and needs (‘Personal Circumstances’). Accordingly, any advice given is not a recommendation that a particular course of action is suitable for you and the advice is therefore not to be acted on as investment advice. You must assess whether or not any advice is appropriate for your Personal Circumstances before making any investment decisions. You can either make this assessment yourself, or if you require a personal recommendation, you can seek the assistance of a financial advisor. Market Matters or its author(s) accepts no responsibility for any losses or damages resulting from decisions made from or because of information within this publication. Investing and trading in financial products are always risky, so you should do your own research before buying or selling a financial product.
The Reports are published by Market Matters in good faith based on the facts known to it at the time of their preparation and do not purport to contain all relevant information with respect to the financial products to which they relate. Although the Reports are based on information obtained from sources believed to be reliable, Market Matters does not make any representation or warranty that they are accurate, complete or up to date and Market Matters accepts no obligation to correct or update the information or opinions in the Reports. Market Matters may publish content sourced from external content providers.
If you rely on a Report, you do so at your own risk. Past performance is not an indication of future performance. Any projections are estimates only and may not be realised in the future. Except to the extent that liability under any law cannot be excluded, Market Matters disclaims liability for all loss or damage arising as a result of any opinion, advice, recommendation, representation or information expressly or impliedly published in or in relation to this report notwithstanding any error or omission including negligence.