Will Norwegian selling present more opportunities in our Energy Sector? (QBE, IAG, AMP, IOOF, WPL, STO, OSH, BPT, ORG, CTX)
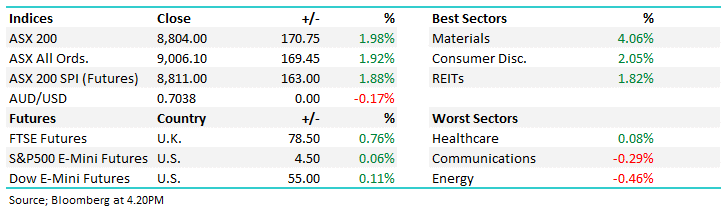
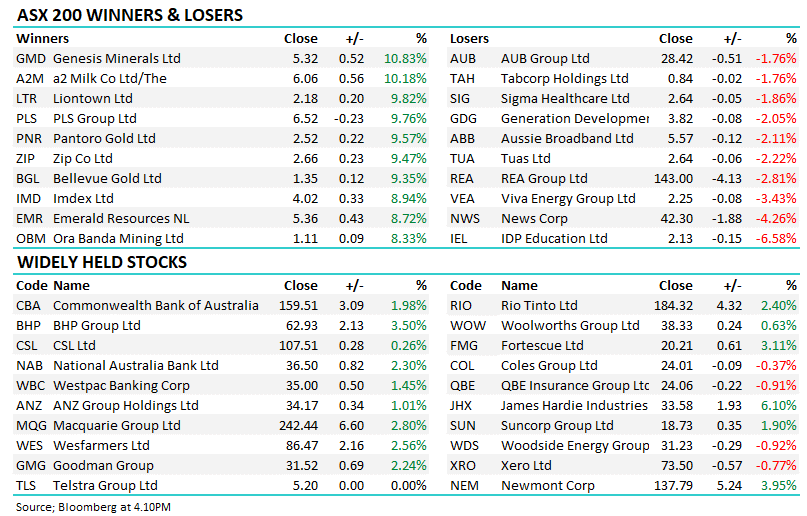
The ASX200 continued with its 3-day pullback yesterday but I would definitely describe the -0.4% decline as more of a drift as opposed to a fall with any major degree of menace. Weakness was overall broad based with standouts actually more on the positive side - 7 stocks closed up by over 4% whereas only 3 were in the same basket on the negative side of the ledger. The only sector which particularly caught our eye was the Energy Sector which fell -1.5% following Fridays news that the Norwegian sovereign wealth fund was looking to sell their $8bn worth of global oil and gas holdings to reduce the countries dependency on the sector - a smart and logical decision in our opinion.
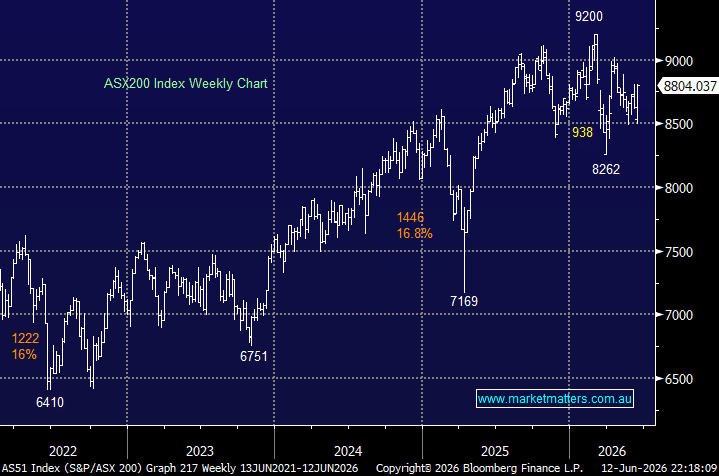
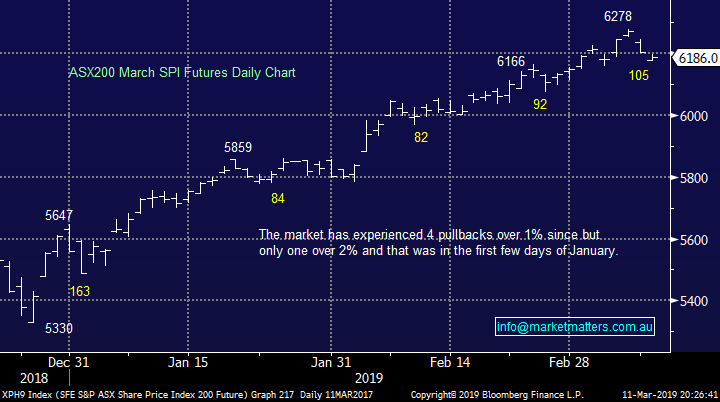
Monday was a day when we ignored the Asian party for a change with both ourselves and New Zealand falling while most of Asia rallied strongly e.g. China +1.9%, Hong Kong +1% and Japan +0.5%. however as I alluded to above it felt like a nothing day with March likely to give some far more interesting offerings moving forward. So far this month the ASX200 has only traded in a 106-point range between 6164 and 6270, it continues to feel like our anticipated period of consolidation following 3-months of 375-point extension to the upside is on the money.
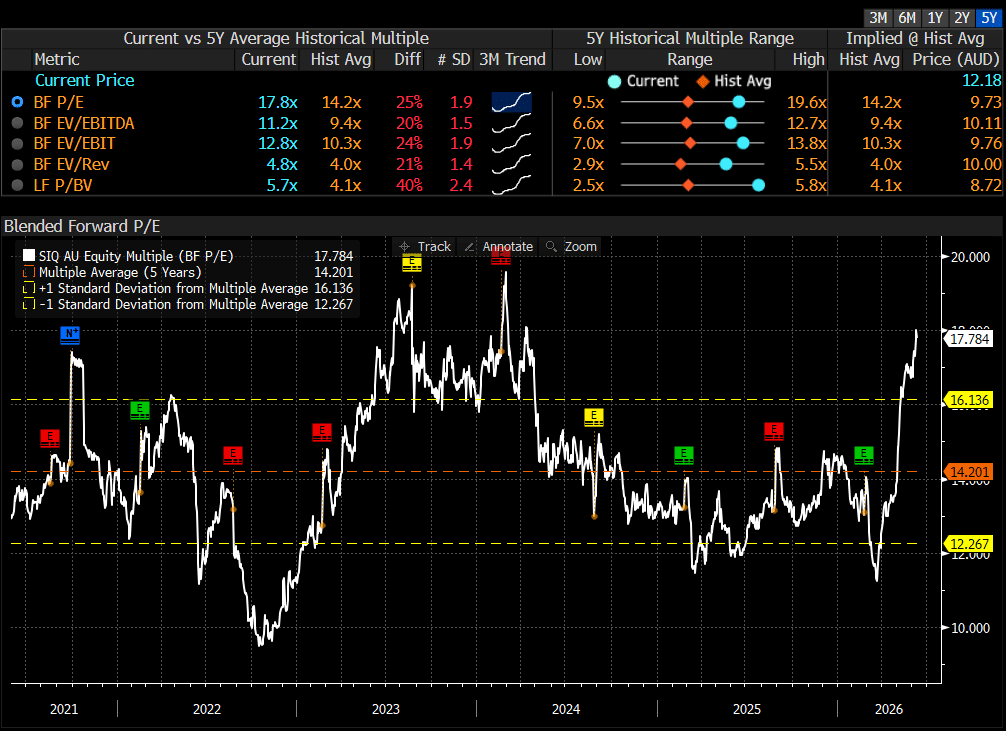
Interestingly just as the ASX200 tests the psychological 6200 area and the index is now trading above its historical average from a valuation perspective we see capital raisings back in vogue with Appen (APX) and Invocare (IVC) tap the market for $300m and ~$85m respectively. While the reasons behind both respective raises were slightly different – they make sense as we discussed in yesterdays Afternoon Report - the timing is clearly opportune / excellent by both companies and we expect more of these to come.
MM remains neutral the ASX200 after its +15% rally from late December lows but we are not afraid to buy selective stocks.
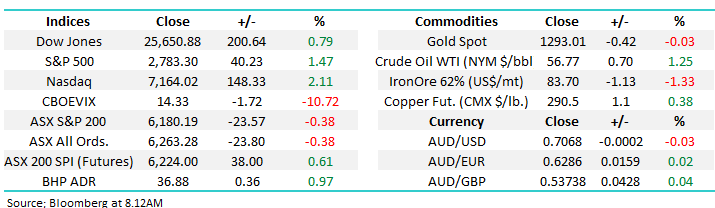
Overnight US markets were strong led by a surging Apple which gained almost +3.5%, BHP was up ~1% in the US and our SPI futures are pointing to a local open up ~ 0.7%.
Today we are going to briefly look at 6 major members of our Energy Sector as the $8bn seller hits town i.e. the Norwegian sovereign wealth fund, or Norges Bank as their central bank is called.
ASX200 March SPI Futures Chart
At MM we are bullish the $A although I admit much of the economic data implies we have switched to a bullish stance too early - but we remain comfortable with our view.
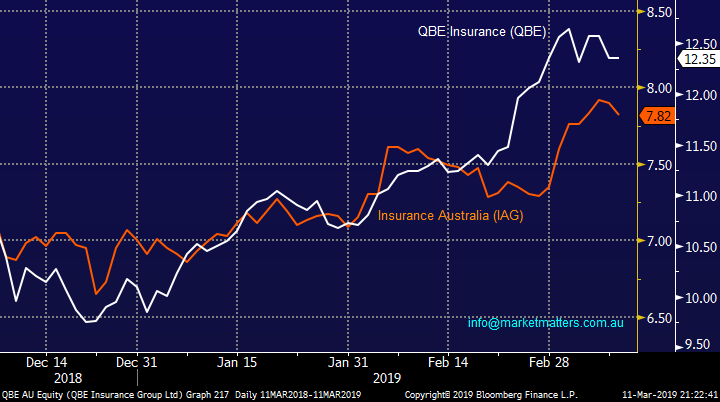
Importantly when we combine this outlook with a more dovish Fed the reasons to be holding QBE Insurance (QBE) after its ~30% rally in 2019 are dwindling rapidly hence our consideration to switch to Insurance Australia Group (IAG) which has only gained under 15% in 2019.
MM is considering switching from QBE into IAG.
QBE Insurance (QBE) v Insurance Australia Group (IAG) Chart
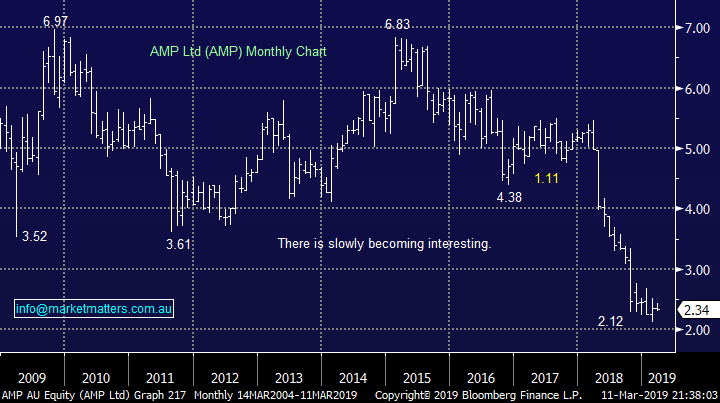
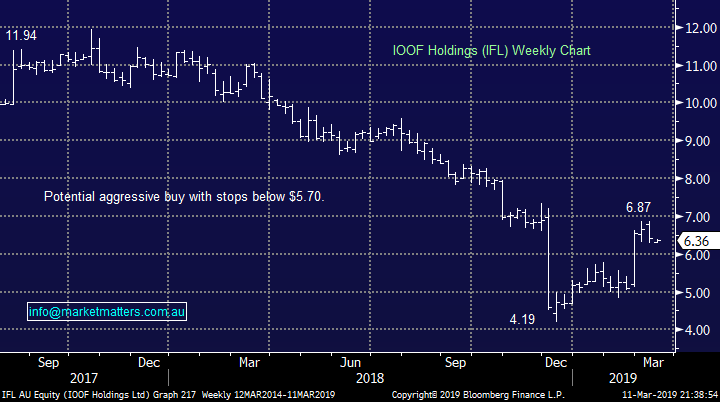
AMP has just been forced to hand over documents to ASIC around fees “for no service”, considering how hard they fought I assume its not pretty reading. However worth noting that everyone hated IOOF in December as regulatory issues hammered the company and top board members were forced to step down in response to court action brought on by APRA – things always look the worst at the bottom and IFL has subsequently rallied over 50% and still looks ok.
AMP will be very tempting into any weakness tomorrow.
NB This is a stock we have avoided for years but most businesses do carry some value.
AMP Ltd (AMP) Chart
IOOF Holdings (IFL) Chart
Global Indices
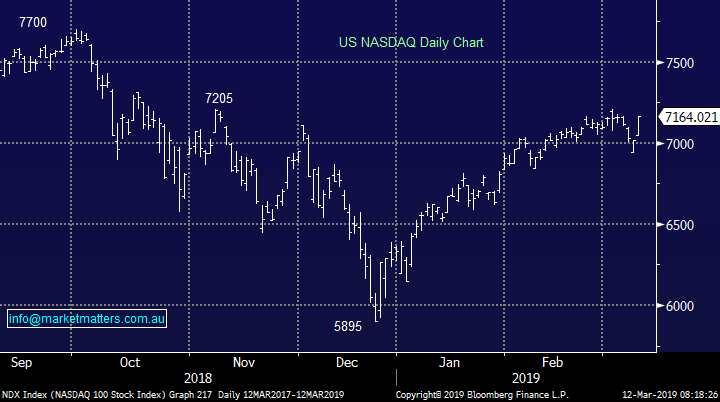
The tech based NASDAQ rallied over 2% last night and looks destined to make fresh highs for 2019 but I would not be chasing this strength as the overall momentum slowly wanes.
We would continue to avoid stocks that are highly correlated to the US at this point in time e.g. Macquarie Bank (MQG) & the growth sector – this call will probably look wrong this morning!
US NASDAQ Chart
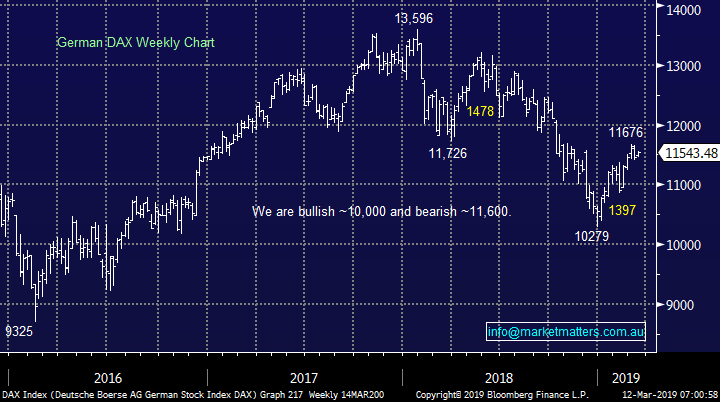
No change, European indices are encountering selling from our targeted sell zones, we remain cautious or even bearish the region at this stage.
Increasing our equities exposure moving forward may be accompanied by purchasing a negative facing ETF.
German DAX Chart
The Australian Energy Sector
Yesterday we saw local energy stocks came under pressure after Fridays news that the Norwegian sovereign wealth fund will divest $8 billion worth of oil and gas holdings, which potentially include stakes in Woodside (WPL), Santos (STO), Oil Search (OSH) and Beach Energy (BPT) i.e. WPL -1.7%, STO -2.2%, OSH -2% and BPT -2.4%. They said they would seek to phase out holdings classified as exploration and production companies from the portfolio in order to "reduce the aggregate oil price risk in the Norwegian economy". In short, Norway relies heavily on oil and gas and to then expose the sovereign wealth fund to more oil and gas doesn’t make sense. That said, it’s not completely new news, Norway's pension fund embarked on its fossil fuel divestment campaign five years ago.
At the end of 2018, they owned shares in around 300 oil producers and service companies including ~1% of WPL which turned over 2.7m shares on a volatile day yesterday which puts their stake around only ~1-weeks turnover, nothing too scary. Also, to give some context about the size of the world’s largest sovereign wealth fund, they have stakes in more than 9000 companies worldwide and on average, the fund holds 1.4% of all of the world's listed companies, while they have about 70% of its holdings are in shares – Norway has executed an impressive plan for its people of using the proceeds from oil & gas to benefit future generations.
1 Woodside Petroleum (WPL) $34.70
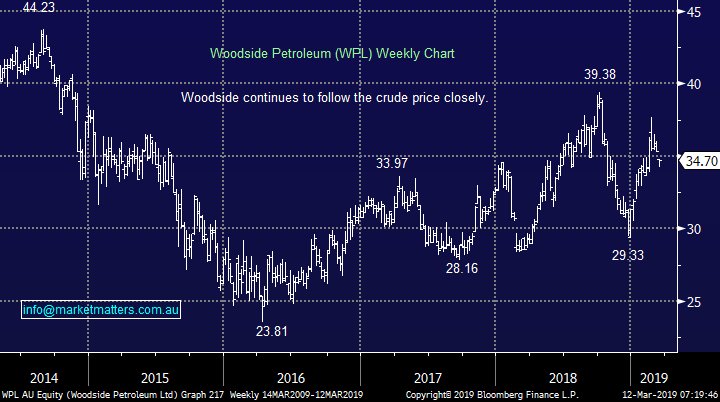
MM bought WPL into weakness yesterday for our Income Portfolio taking advantage of its recent 9% pullback – the stocks currently expected to yield 5.10% fully franked in the next 12 months which we believe is very attractive in todays low interest rate environment.
The companies most recent production update in January was solid showing revenue up to US1.4bn helped by higher prices and increased production. This is a solid Australian business whose current Est. P/E for 2019 of 14.2x is not scary however this is undoubtedly a play around energy prices, if they fall WPL is going to struggle hence we only purchased 4% for the Income Portfolio yesterday.
MM likes WPL from a business and yield perspective.
Woodside Petroleum (WPL) Chart
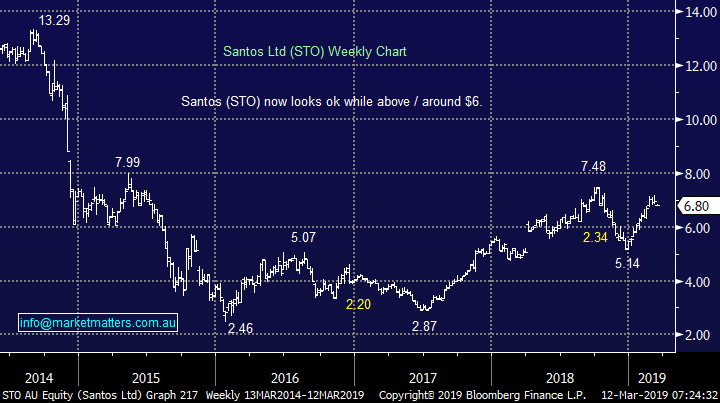
2 Santos (STO) $6.80
MM has been considering STO for a while “hoping” for an opportunity to get long closer to the $6 area and this still feels a very realistic possibility, just not today.
Like WPL, Santos recorded a solid report in February, they delivered a full year underlying profit of $US727m with free cash flow above $US1bn. Santos has now turned from survival mode into growth mode - perhaps we will see another takeover offer as suitors run out of time with the share price appreciation.
MM continues to like STO below $6.50.
Santos (STO) Chart
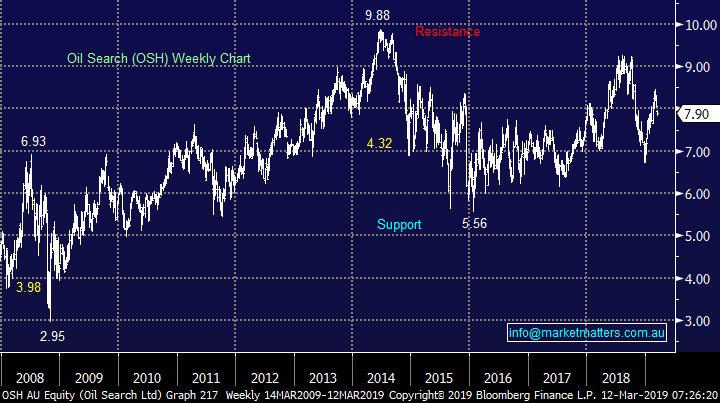
3 Oil Search (OSH) $7.90
OSH has been the “boring” member of the sector during both falls and rises, not a bad thing but with a low yield capital appreciation is required to make the stock attractive.
This is one member of the sector who struggled after releasing their latest report which showed a 6% increase in 4th quarter revenue to over $US500m but a 1% fall in production clearly caught investors eye.
MM is neutral OSH at current levels.
Oil Search (OSH) Chart
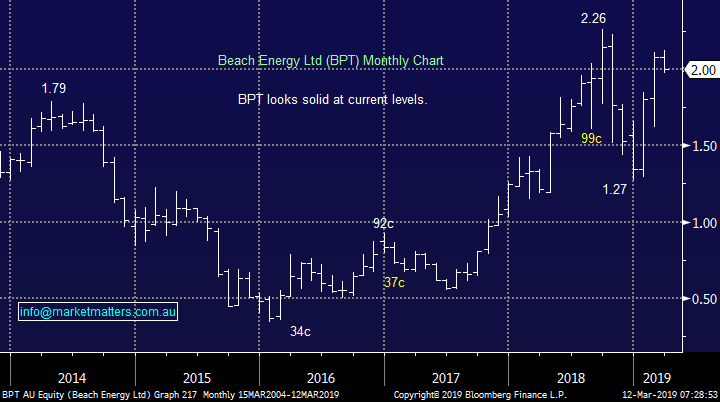
4 Beach Energy (BPT) $2
BPT has enjoyed an excellent start to the year helped by a doubling of its profit in the first half of 2019 to an underlying net profit of almost $280m. Technically and fundamentally we are bullish BPT initially targeting 15% upside.
MM is bullish BPT with ideal entry ~$1.90.
Beach Energy (BPT) Chart
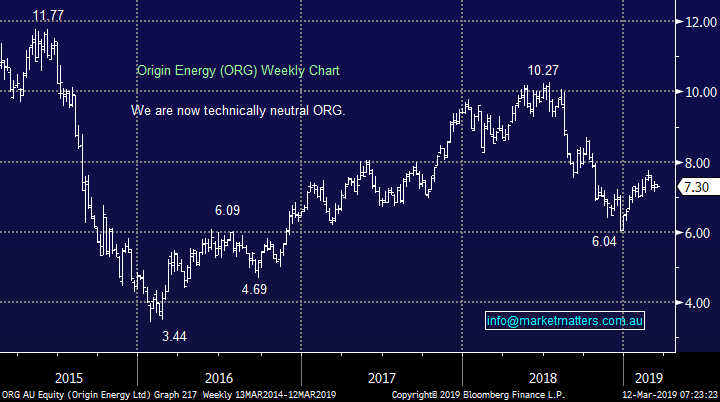
5 Origin Energy (ORG) $7.30
Shares in ORG have been underperforming the sector following the sale of its Ironbark coal seam gas project for $231m, realising a loss of around 65% after 10-years. However not all is bad news with the business back in the black after posting a net profit of almost $800m for the 6-months ending December 2018 allowing the company to pay its first dividend in 6-years.
ORG is Australia’s largest producer of coal seam gas and rumours continue around a potential bid for ORG, we are considering whether a combination of STO and ORG will reap rewards at least on one front from a takeover perspective.
MM likes ORG with ideal entry around $7 with a target around $8.50.
Origin Energy (ORG) Chart
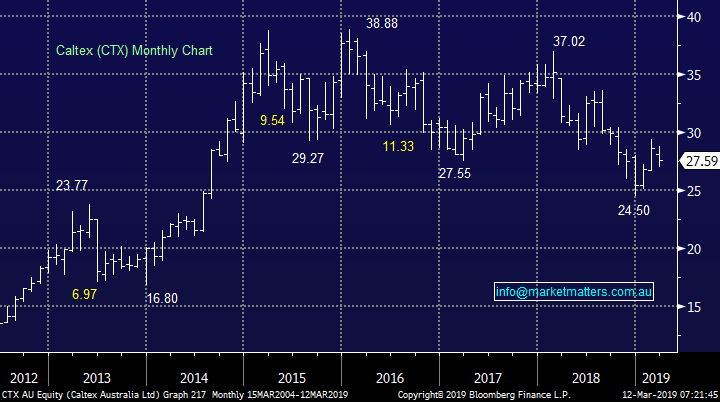
6 Caltex (CTX) $27.59
Fuel retailer CTX shares rallied towards $30 after their full year results which showed net profit after tax (NPAT) just shy of $560m which beat guidance but was still lower than last year. However the stock has drifted since even with the announcement of a $260m off market buyback.
Caltex now relies too heavily on retail to drive growth and for that reason we have limited interest in the stock for now.
We are short-term bearish CTX targeting a minimum test of $24.
Caltex (CTX) Chart
Conclusion
MM likes a few opportunities in the Energy Sector, especially a few % lower:
1 – Woodside (WPL) at current levels for yield.
2 – Santos (STO), Beach Petroleum (BPT) and Origin (ORG) a few % lower.
3 – Caltex (CTX), negative although 10% lower for yield and capital appreciation may appeal.
Overnight Market Matters Wrap
· The US majors started their week’s session in positive territory following positive retail sales data showing some confidence to investors that its economy still has some room for growth.
· Crude oil jumped 1.25% to US $56.77/bbl. as Saudi Arabia extended its bigger than agreed production cuts into its second month.
· BHP is expected to outperform the broader market after ending its US session up an equivalent of 0.97% from Australia’s previous close from its exposure to the energy sector.
· The March SPI Futures is indicating the ASX 200 to jump from the gates, up 45 points towards the 6225 level this morning.
Have a great day!
James & the Market Matters Team
Disclosure
Market Matters may hold stocks mentioned in this report. Subscribers can view a full list of holdings on the website by clicking here. Positions are updated each Friday, or after the session when positions are traded.
Disclaimer
All figures contained from sources believed to be accurate. Market Matters does not make any representation of warranty as to the accuracy of the figures and disclaims any liability resulting from any inaccuracy. Prices as at 12/03/2019
Reports and other documents published on this website and email (‘Reports’) are authored by Market Matters and the reports represent the views of Market Matters. The MarketMatters Report is based on technical analysis of companies, commodities and the market in general. Technical analysis focuses on interpreting charts and other data to determine what the market sentiment about a particular financial product is, or will be. Unlike fundamental analysis, it does not involve a detailed review of the company’s financial position.
The Reports contain general, as opposed to personal, advice. That means they are prepared for multiple distributions without consideration of your investment objectives, financial situation and needs (‘Personal Circumstances’). Accordingly, any advice given is not a recommendation that a particular course of action is suitable for you and the advice is therefore not to be acted on as investment advice. You must assess whether or not any advice is appropriate for your Personal Circumstances before making any investment decisions. You can either make this assessment yourself, or if you require a personal recommendation, you can seek the assistance of a financial advisor. Market Matters or its author(s) accepts no responsibility for any losses or damages resulting from decisions made from or because of information within this publication. Investing and trading in financial products are always risky, so you should do your own research before buying or selling a financial product.
The Reports are published by Market Matters in good faith based on the facts known to it at the time of their preparation and do not purport to contain all relevant information with respect to the financial products to which they relate. Although the Reports are based on information obtained from sources believed to be reliable, Market Matters does not make any representation or warranty that they are accurate, complete or up to date and Market Matters accepts no obligation to correct or update the information or opinions in the Reports. Market Matters may publish content sourced from external content providers.
If you rely on a Report, you do so at your own risk. Past performance is not an indication of future performance. Any projections are estimates only and may not be realised in the future. Except to the extent that liability under any law cannot be excluded, Market Matters disclaims liability for all loss or damage arising as a result of any opinion, advice, recommendation, representation or information expressly or impliedly published in or in relation to this report notwithstanding any error or omission including negligence.