MM’s mid-week look at overseas stocks on the move (EHL, SGR, BA US, NVDA US, COST US, 941 HK, AAPL US)
The ASX200 slipped -0.2% yesterday with mild weakness in most sectors with only 35% of the market managing to close up on the day. Under the hood stability has returned to the bourse after the chaos of reporting season with only 4 stocks rallying by over 4% while only one declined by greater than the same degree - Sigma Healthcare (SIG) which plunged over 12% following the boards rejection of a takeover bid by rival Australian Pharmaceuticals (API).
The Healthcare Sector now contributes 15 members to the ASX200 making up an important 8.5% of the index following its excellent performance over recent years. However what’s catching our eye is the takeover activity boiling away within the space, yesterday was all about SIG and API but we also have Healthscope (HSO) and Healius (HLS) in the sights of suitors. The question is will it all go cold or is it now or never for say Jangho with Healius (HLS), the stock remains over 20% below the takeover bid telling the market believes the bid will go the same way as SIG & API – MM believes it actually represents good risk / reward below $2.70.
We can see the market evolving in 2 ways from here in the short-term but either way our strategy remains consistent:
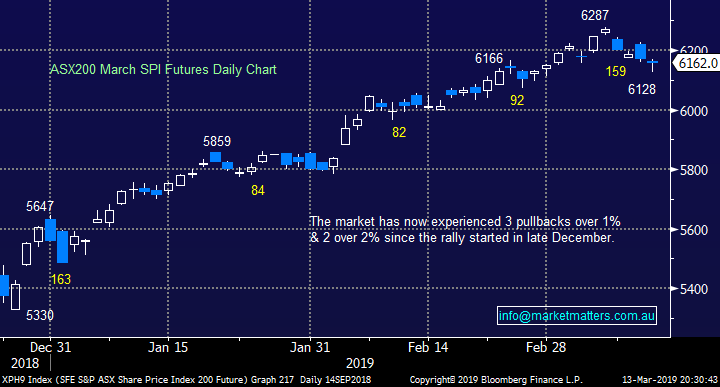
1 – The market will rally from yesterdays low to make another fresh high in March before again rotating back towards 6100.
2 – The recovery from yesterdays low will be relatively short lived and the 159-point fall over the last 5-days is only the first leg and a move back well over 6100 will unfold later this month.
Either way we are generally sellers of strength and buyers of weakness, a touch cliché but the appropriate strategy when a market starts rotating / consolidating.
MM remains neutral the ASX200 after its strong rally from late December lows and we are not afraid to buy selective stocks.
Overnight US markets made fresh highs for 2018 with the Dow closing up almost 150-points / 0.6% with the SPI futures calling the ASX200 to rally ~20-points on the opening this morning.
Today we are going to look at the 5 of the most volatile stocks on the global stage during the last 5 trading days.
ASX200 March SPI Futures Chart
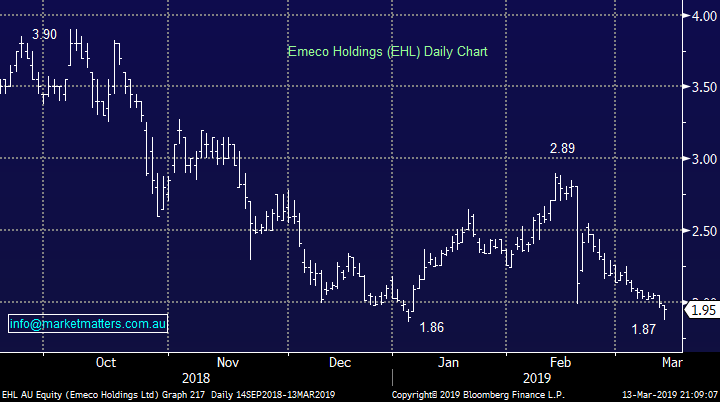
In yesterday’s morning report we discussed Emeco (EHL) the leasor of earthmoving equipment to the mining industry, pointing out our buy area was approaching in this relatively volatile stock. The company’s current Est P/E for 2019 of 9.1x remains undemanding while around our ideal $1.80 target area it will on paper represent solid value.
However by lunchtime the stock was down ~6% on reasonable volume as the selling was reaching a crescendo but EHL recovered all afternoon to close 4% above its low implying the selling was exhausted, at least on the day.
MM now likes EHL around current levels and especially the $1.80 area.
Emeco Holdings (EHL) Chart
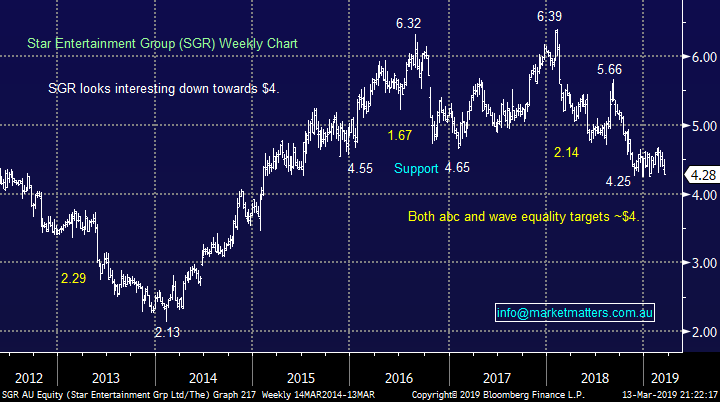
Also, Star Entertainment (SGR) closed down over 2% on the day and is now only ~5% away from our buy zone, it could even reach it this week if we see acceleration in the selling on a break of 2018’s $4.25 low. My pals who visited Star yesterday it seemed the same as a few years ago but it was impossible to miss the imposing Crown Barangaroo project looming on the horizon.
MM remains keen on SGR between $4 and $4.10.
Star Entertainment (SGR) Chart
Global Indices
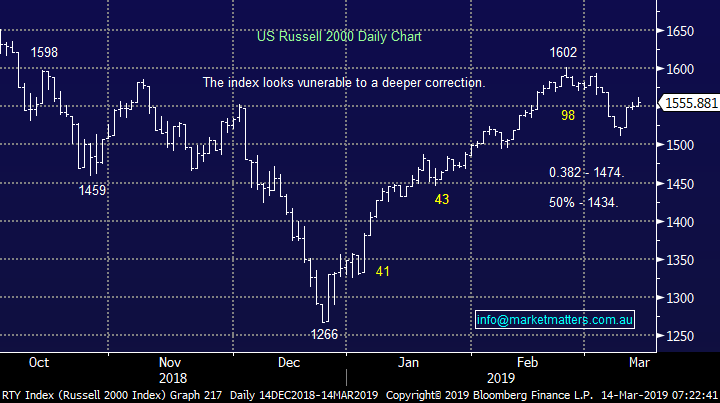
Interestingly, while the tech based NASDAQ rallied another +0.8% again last night, making fresh highs for 2019, the small cap Russell 200 remains 3% below the same milestone i.e. divergence with our favourite index as a leading indicator continuing to struggle.
We will continue to avoid stocks that are highly correlated to the US at this point in time e.g. Macquarie Bank (MQG) & the broad based growth sector.
US Russell 2000 Chart
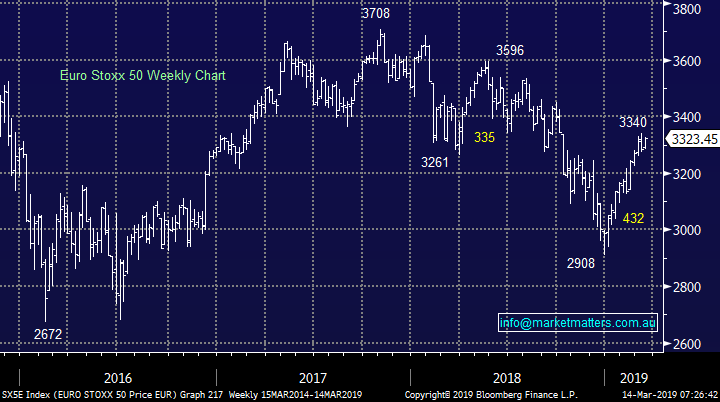
No change, European indices are encountering some selling from our targeted “sell zones”, we remain cautious or even bearish the region at this stage.
Any significant Increase in our equities exposure moving forward may be accompanied by purchasing a negative facing ETF.
EuroStoxx 50 Chart
5 big movers on the global stage
Global markets have enjoyed a relatively quiet few days with most US indexes grinding higher to make fresh highs for 2018, but under the hood there have been a few big movers.
Today I have selected 4 winners and 1 loser which is a fair reflection of a world equity market making slow but steady headway. The only 2 stocks that should have been included, if I was to purely select the largest 5 movers, were Reliance Industries (India) and United Health (US) but because they have been reviewed recently I have looked at influential APPLE and “newbie” to us, China Mobile.
1 Boeing (BA US) $US377.14
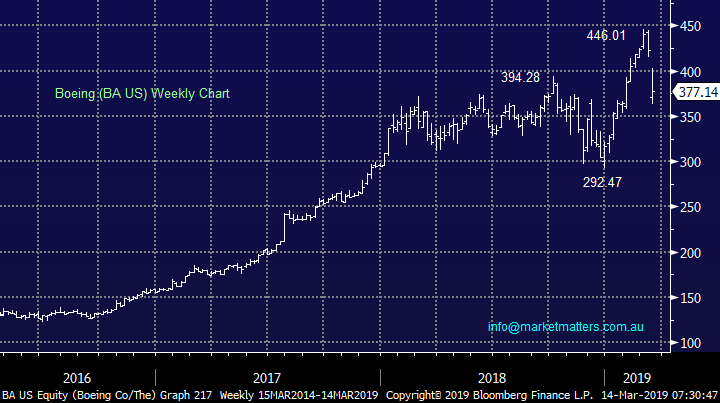
Unfortunately Being (BA US) has dominated the press over the last week following the crash of the Ethiopian Airlines 737 plane on Sunday. The disaster which killed 157 people has resulted in an almost total worldwide grounding of the Boeing 737 Max aircraft sending the shares of BA down over 11% during the last 5-days – the largest move of any stock either up, or down.
The markets should be concerned that some of the most respected regulatory & investigative boards have now called for the grounding of the plane. At MM we often look to take advantage of news driven “knee jerk reactions” in share prices but you have to question how these events will influence future orders of aircraft from the company i.e. who will want to sign off on a Boeing purchase and take the responsibility with viable alternatives always available.
MM is neutral / negative BA with a technical target closer to $US300.
Boeing (BA US) Chart
2 Nvidia (NVDA) $US168.62
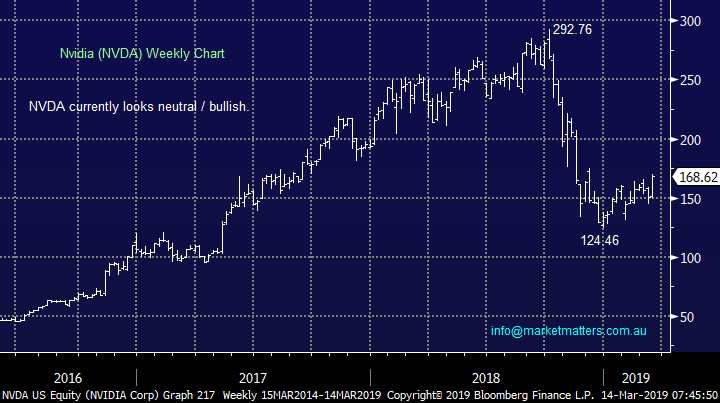
This Artificial Intelligence (AI) chip leader & interactive 3-D graphics company had a meteoric rise into 2018 before collapsing over 50% in October due to a combination of the rerating of high valuation stocks and fears around slowing demand for semi-conductors, with the US – China trade concerns a major contributor to the later.
The company may have delivered revenue growth of 21% in November for the 3rd quarter of 2018 but it was below both market expectations and company guidance. The question obviously being, is this an opportunity to enter a hot sector at a reasonable price, at least relatively.
NVDA has been the best performer over the last 5-days rallying over 10% but it remains over 40% below its 2018 high, technically we can be buyers with stops below $US160, less than 5% risk.
MM is neutral NVDA at current levels but likes the risk / reward available at current levels for believers in the story.
Nvidia (NVDA) Chart
3 Costco (COST US) $US236.38
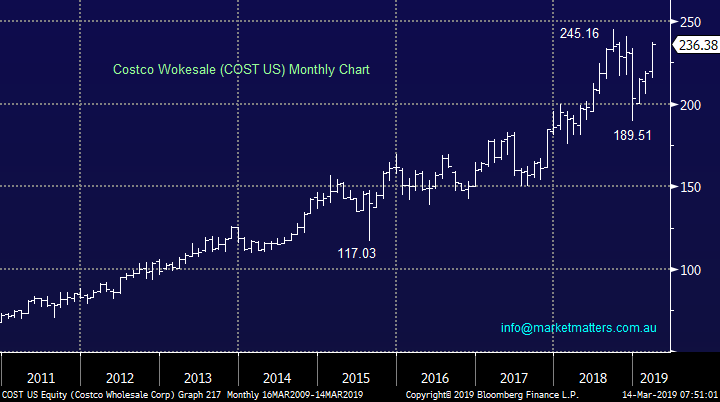
Wholesale membership warehouse store business continues to go from strength to strength with shares up almost 8% over the last 5-days alone. With market leaders like COST we must remain bullish US equities moving forward although we will be on alert once the likes of COST have broken their 2018 all-time highs.
In the bigger picture we would not be chasing COSTCO as their margins are under pressure which was illustrated in their latest earnings report which sent the stock down 9% on the day. Clearly the market is giving the business the benefit of the doubt but we are not convinced around the risk / reward especially into fresh highs.
MM is bullish COST initially targeting $US250.
Costco (COST US) Chart
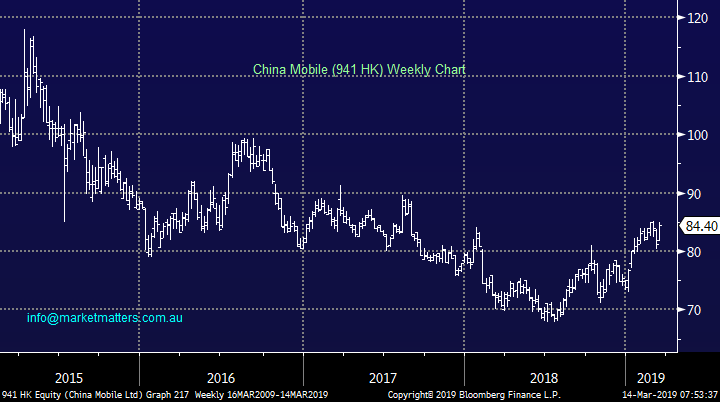
4 China Mobile (941 HK) HKD84.40
China Mobile is the largest global telco business with ~800 million customers, a healthy base for any business. The stock has rallied just over 4% during the last 5-days helped by a strong market across most of the region.
The company’s shares have been trading around 30% of their global peers from a valuation perspective with the business struggling as the Chinese Government pressures the carrier to reduce rates – that’s one big elephant in the room. Due to issues out of its control we put China Mobile in the trade bucket as opposed to regarding it as investment grade.
MM likes China Mobile as a trade with stops below HK81.50, or under 4% risk.
China Mobile (941 HK) Chart
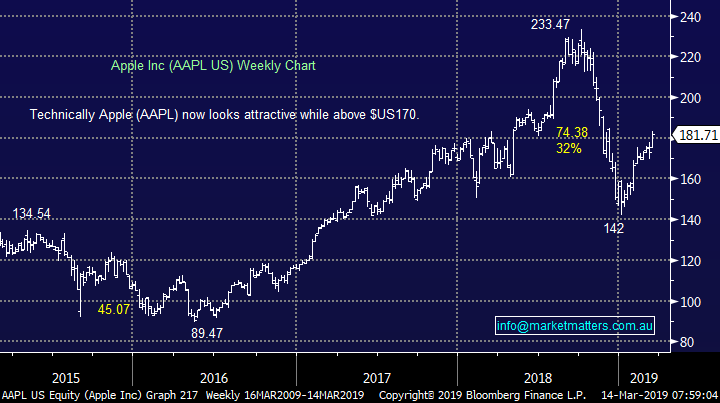
5 Apple Inc (AAPL US) $US181.71
Apple, like a few in todays list, is bouncing strongly after a tough few months, the tech goliath has gained just over 4% over the last 5 trading days.
APPLE as a business in huge need of a replacement to the iPhone / iPad to maintain its phenomenal growth of the last few decades, and obviously it’s always a big ask of a company to keep pulling rabbits out the hat. Hence at this stage we regard APPLE as a mature business, with huge cash stockpiles, which can almost be traded / invested accordingly.
MM expects APPLE to trade between $US210 and $US160 in 2019 / 2020.
APPLE (AAPL US) Chart
Conclusion
Of the 5 international stocks we looked at today we like China Mobile as a trade, the others unfortunately offer little in the way of risk / reward at current prices.
Overnight Market Matters Wrap
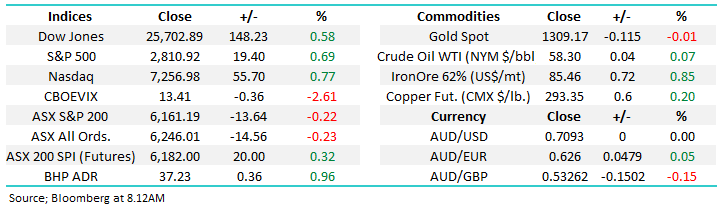
· The SPI is up 20 points as US equities rallied overnight. The Dow closed 0.6% in the black, while the S&P 500 and the NASDAQ rose 0.7%.
· British MP’s voted against leaving the European Union without a deal which allows them to delay Brexit, possibly for another two months. The pound rallied and the $US fell while US stocks hit a four month high.
· US producer prices barely moved in February, up 0.1%, missing analyst expectations. So, we have inflation in check, allowing the Fed to stay on hold for longer, while more data showed demand for US goods produced in factories rose.
· Metals on the LME advanced, with aluminium the stand-out. Iron ore fell while gold traded higher to $US1310/oz. Oil rallied to its highest level since November as US inventories fell.
Have a great day!
James & the Market Matters Team
Disclosure
Market Matters may hold stocks mentioned in this report. Subscribers can view a full list of holdings on the website by clicking here. Positions are updated each Friday, or after the session when positions are traded.
Disclaimer
All figures contained from sources believed to be accurate. Market Matters does not make any representation of warranty as to the accuracy of the figures and disclaims any liability resulting from any inaccuracy. Prices as at 14/03/2019
Reports and other documents published on this website and email (‘Reports’) are authored by Market Matters and the reports represent the views of Market Matters. The MarketMatters Report is based on technical analysis of companies, commodities and the market in general. Technical analysis focuses on interpreting charts and other data to determine what the market sentiment about a particular financial product is, or will be. Unlike fundamental analysis, it does not involve a detailed review of the company’s financial position.
The Reports contain general, as opposed to personal, advice. That means they are prepared for multiple distributions without consideration of your investment objectives, financial situation and needs (‘Personal Circumstances’). Accordingly, any advice given is not a recommendation that a particular course of action is suitable for you and the advice is therefore not to be acted on as investment advice. You must assess whether or not any advice is appropriate for your Personal Circumstances before making any investment decisions. You can either make this assessment yourself, or if you require a personal recommendation, you can seek the assistance of a financial advisor. Market Matters or its author(s) accepts no responsibility for any losses or damages resulting from decisions made from or because of information within this publication. Investing and trading in financial products are always risky, so you should do your own research before buying or selling a financial product.
The Reports are published by Market Matters in good faith based on the facts known to it at the time of their preparation and do not purport to contain all relevant information with respect to the financial products to which they relate. Although the Reports are based on information obtained from sources believed to be reliable, Market Matters does not make any representation or warranty that they are accurate, complete or up to date and Market Matters accepts no obligation to correct or update the information or opinions in the Reports. Market Matters may publish content sourced from external content providers.
If you rely on a Report, you do so at your own risk. Past performance is not an indication of future performance. Any projections are estimates only and may not be realised in the future. Except to the extent that liability under any law cannot be excluded, Market Matters disclaims liability for all loss or damage arising as a result of any opinion, advice, recommendation, representation or information expressly or impliedly published in or in relation to this report notwithstanding any error or omission including negligence.