What’s an inverted yield curve & why should I be concerned? (TLS)
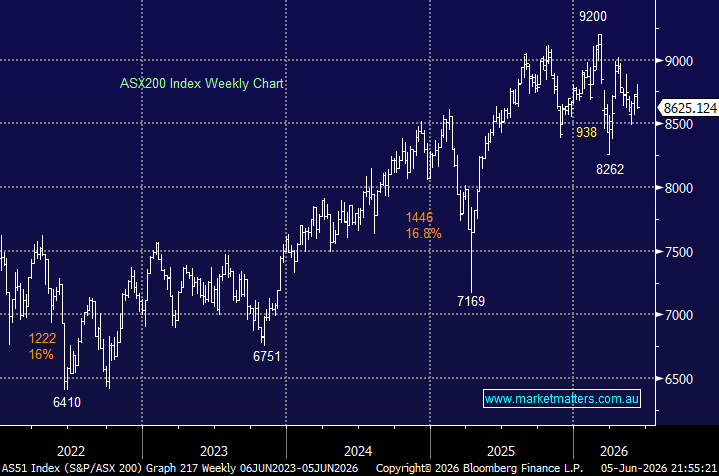
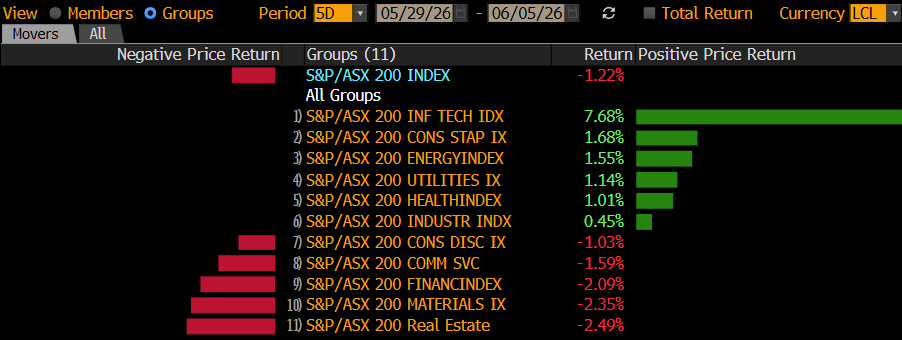
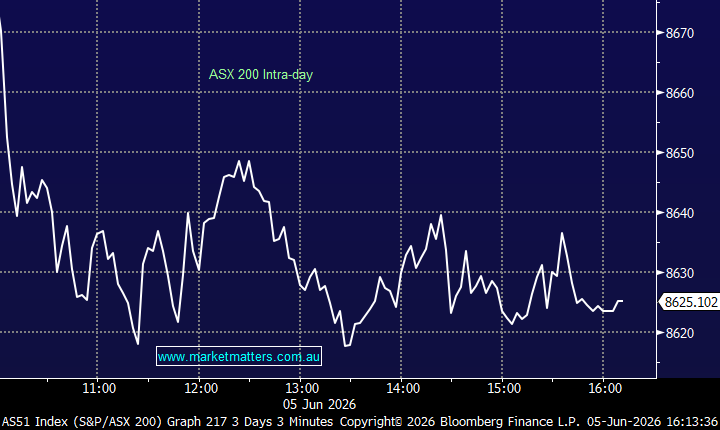
The ASX200 had a quiet Tuesday, especially when compared to Mondays dramatic 69 point drop courtesy of ongoing fears around a potential global recession. In many ways the market appears not to be positioned for a deep economic slowdown, and subsequent falling interest rates / bond yields, as we again saw the Utilities and Real Estate sectors perform strongly while the Energy complex fell -1.1% i.e. nobody appears to be trying to fade a potential recession at this stage.
Overall volumes are moderate as investors swing between optimism around further QE / loose monetary policy and pessimism when the big “r” word is mentioned as yield curves invert, plus of course there is also the headwind of equities trading above their historical average from a valuation perspective. Our mantra remains the same for 2019 / 2020 remain open-minded its likely to be a choppy period for markets but fun for investors who are happy to buy when things look bad as well as sell when things look great!
Overall yesterday’s performance by local stocks felt pretty lacklustre only just managing to close in the black following Mondays painful slump i.e. no quick buying of weakness that has characterized the rally since late December. The external influences were net positive with US future’s rallying ~+0.3% while Asia was mixed but more positive, at this stage the billions of dollars’ worth of dividends landing in investors pockets this week is clearly not seeing any bargains with Friday nights volatility perhaps clearly too fresh in investor minds.
MM expects at least another 1% downside in the ASX200 over the next few weeks.
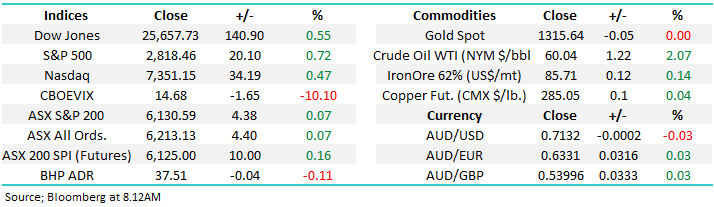
Overnight US markets rallied around +0.5% although the Dow closed 150-points below its intra-day high. The SPI futures are calling the ASX200 to open up around 10-points, nothing too inspiring at this stage.
Today we looked to explain the “yield curve” in a simple fashion while understandably maintaining a firm eye on the ramifications for equities.
ASX200 Chart

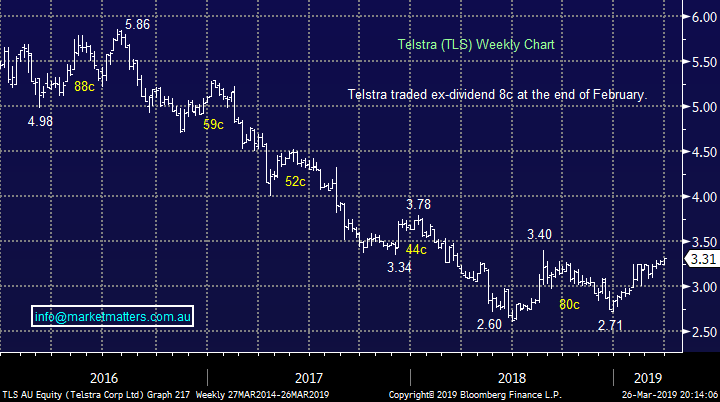
Yesterday we saw Telstra (TLS) reach levels not seen since last August, even before we take into account dividends – TLS currently yields 5.74% fully franked.
TLS is a position held in both our MM Platinum & Income Portfolios and one we’ve probably received the most flack around in our Monday morning reports, yet its currently showing us a ~13% paper profit, outperforming the market by about 2.5x.
However this is not about gloating, or saying phew for that matter, but thinking about what next. We have a theory evolving that “feels” like it might have some foundation:
MM has had a medium-term goal for TLS of $3.50 where we will at least reduce our position. However we now question if TLS may reach our target area as the flight to perceived “safe yield” tops out may coincide with an ideal time to switch funds back towards risk like the IT sector – watch this space!
Telstra (TLS) Chart
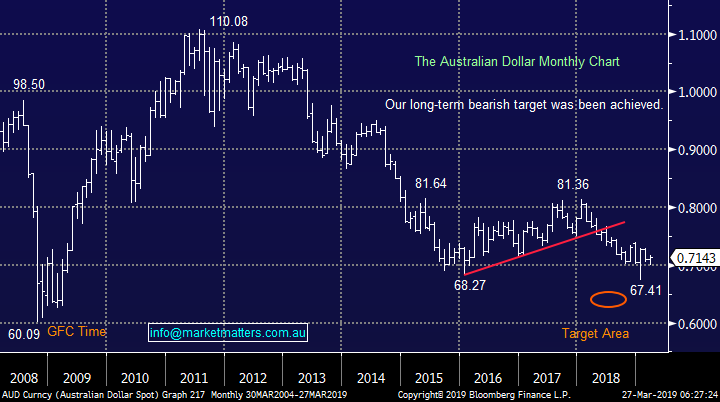
Interestingly over the last few weeks the little “Aussie Battler” has remained extremely resilient despite the concerns around a global recession – not the anticipated outcome for a resource backed currency.
However at MM we remain bullish the $A against the $US, targeting the 80c area over the coming 1-2 years, more because of anticipated weakness in the Greenback than strength in the Aussie.
Australian Dollar ($A) Chart
Understanding an inverted yield curve & its potential ramifications.
Today we have deliberately followed a Keep it Simple Stupid (KISS) attitude in attempting to explain the yield curve because there’s no reason to complicate this economic phenomenon. An inverted yield curve is easy to understand but at times trickier to profitably apply to stocks and other markets.
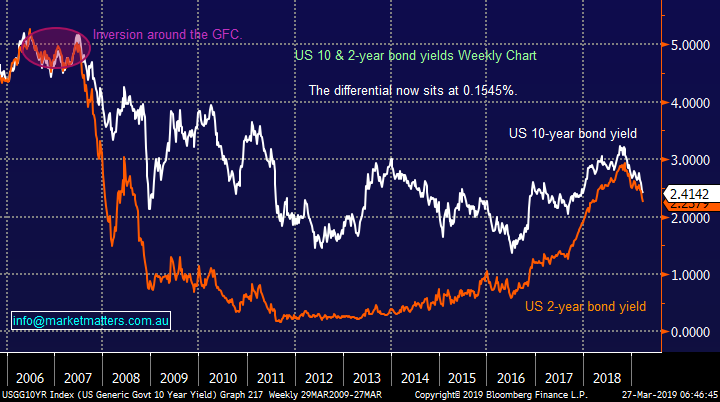
Yield curves are said to invert when short-term bond yields climb above longer-term ones. Fridays savage sell off by equities was largely triggered by US short-term bill rates climbing above US 10-year bond yields. However the more closely watched US 2 year bonds remain just below their “big brother” the 10-year bonds but the gap has narrowed significantly as can be seen by the comparison chart below.
I can hear many subscribers think “so what?” over their morning coffee.
The big issue / problem is the US yield curve has inverted just before the last 7 recession by the world’s largest economy – not good news for anyone.
An inverted yield curve is regarded as an abnormal situation where investors have very little confidence in the outlook for the economy. Lower interest rates generally coincide with tougher economic conditions or in simple terms, interest rates are telling us that economically, it gets harder from here.
US 2 & 10 year bond yields Chart
What does inversion mean?
The issue is historically bond yields inverting is commonly regarded as a leading indicator for a recession, however not every time the US yield curve inverts do they fall into recession – nothing’s that easy!
Again I can hear some of you think what does that mean for stocks, after all its been 27-years since Australia experienced a recession. It’s simple, when Australia experiences its next meaningful recession its likely to be bad news for many local stocks in the ASX200. The last time Australia experienced a recession under Paul Keating and Labor’s leadership back in 1990 - it’s often referred to as “The recession we had to have” to unwind the excesses of the 1980’s.
There are some scary similarities if we consider Australia’s growing household debt, even after the GFC, are we about to pay the price again? If so just remember during the last recession under Mr Keating shares in the likes of Westpac (WBC) halved. Remain open-minded not many people expected property to fall as hard / fast as it has over the last 12-months, but here we are.
Importantly at MM we are not calling such large declines but we will be keeping our “finger on the pulse” in case central banks new dovish stance fails to excite global stock markets – perhaps to send stocks meaningfully higher in 2019, from their already rich valuations, we need to see the likes of the US Fed become almost foolishly dovish to maintain growth – President Trump’s choice I’m sure with an election looming.
NB stocks are already pricing in a positive outcome from US – China trade talks and China stimulus, it feels like the markets looking for another sugar hit to propel it higher and the recent change to a dovish stance by the Fed is struggling to lift its energy levels, at least just yet.
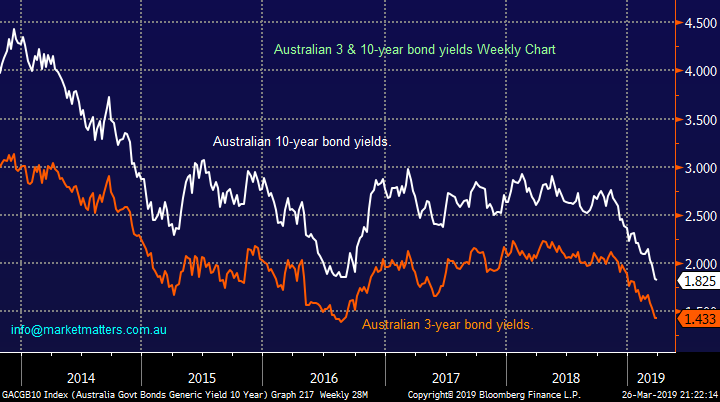
The Australian 3-year bonds are well above the longer dated 10-years but both are plunging to all-time lows implying strongly all’s not well with the Australian economy. This ties in with some of the rhetoric we are now hearing out of the US where recently Federal Reserve member Charles Evans stated "at the moment, the risks from the downside scenarios loom larger than those from the upside ones”. Markets are now pricing in a full 25bp rate cut by the Federal Reserve by the end of 2019. The US would not be considering cutting rates if their economy was healthy and growing.
Australian 3 & 10 year bond yields Chart
Lastly I hear some of you ask “ I thought lower interest rates were good for equities hence what’s all the fuss about the yield curve?”. Lower interest rates are usually good for equities, but typically after some pain has been felt (i.e. post GFC), however cutting rates from record lows to new record lows may be problematic – remember the plunge in December in contrast to the rally we enjoyed when Westpac’s economist called for 2 rate cuts in Australia in 2019 i.e. it’s a fine line.
There is clearly a degree of suspicion about why the US Fed is performing its biggest policy backflip in twenty years following its last FOMC meeting when it emphasized more caution and patience. Is the Fed seeing evidence of a slow-down / possible recession that is not yet evident in the data? Considering the future developments with interest rates the yield curve should be important for stock market investors but as we regularly say at MM allow price action to have the final say.
Conclusion
MM will let the market tell us if / when its going to reprice itself for a recession or rally to yet higher valuations through more “free money” its easier than forecasting politicians and central banks.
Global Indices
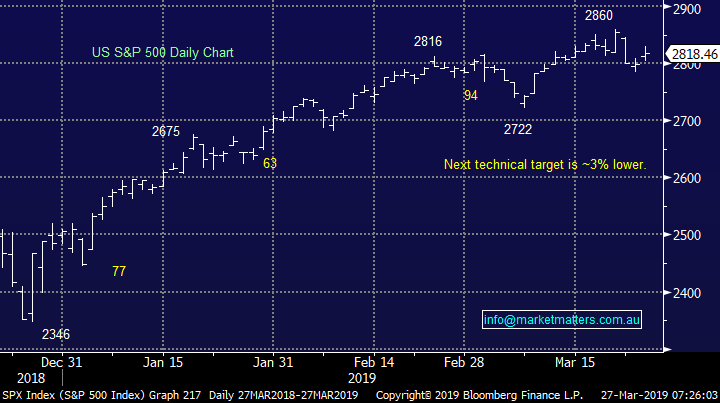
US stocks closed up around +0.5% last night after giving back strong earlier gains and while our preferred scenario remains for a few more weeks of weakness the ongoing outperformance last night by the small cap Russell 2000 Index suggests the next few days at least should still be ok.
US S&P500 Chart
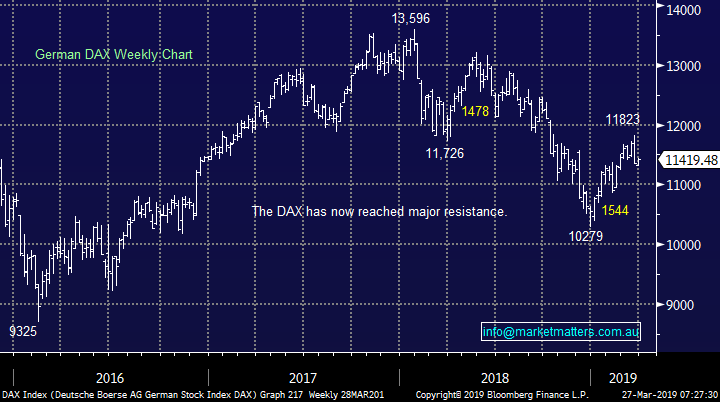
No change, European indices are encountering some selling from our targeted “sell zones”, we remain cautious or even bearish the region at this stage.
Any significant Increase in our equities exposure moving forward may be accompanied by purchasing a negative facing ETF at appropriate times.
German DAX Chart
Overnight Market Matters Wrap
· The US equities jumped higher overnight, however focus was primarily in the US bonds, with the 10-year yield rising slightly to 2.42% as residential construction dropped by 8.7%, along with lower than expected consumer confidence.
· On the commodities front, Nickel led metals higher on the LME, while oil rallied with reports that Russia is on track to meet output cuts. Crude oil rallied on the back of this, settling 2.07% higher.
· BHP is expected to underperform the broader market after ending its US session down an equivalent of -0.11% from Australia’s previous close.
· The March SPI Futures is indicating the ASX 200 to open 10 points higher, towards the 6140 level this morning.
Have a great day!
James & the Market Matters Team
Disclosure
Market Matters may hold stocks mentioned in this report. Subscribers can view a full list of holdings on the website by clicking here. Positions are updated each Friday, or after the session when positions are traded.
Disclaimer
All figures contained from sources believed to be accurate. Market Matters does not make any representation of warranty as to the accuracy of the figures and disclaims any liability resulting from any inaccuracy. Prices as at 27/03/2019
Reports and other documents published on this website and email (‘Reports’) are authored by Market Matters and the reports represent the views of Market Matters. The MarketMatters Report is based on technical analysis of companies, commodities and the market in general. Technical analysis focuses on interpreting charts and other data to determine what the market sentiment about a particular financial product is, or will be. Unlike fundamental analysis, it does not involve a detailed review of the company’s financial position.
The Reports contain general, as opposed to personal, advice. That means they are prepared for multiple distributions without consideration of your investment objectives, financial situation and needs (‘Personal Circumstances’). Accordingly, any advice given is not a recommendation that a particular course of action is suitable for you and the advice is therefore not to be acted on as investment advice. You must assess whether or not any advice is appropriate for your Personal Circumstances before making any investment decisions. You can either make this assessment yourself, or if you require a personal recommendation, you can seek the assistance of a financial advisor. Market Matters or its author(s) accepts no responsibility for any losses or damages resulting from decisions made from or because of information within this publication. Investing and trading in financial products are always risky, so you should do your own research before buying or selling a financial product.
The Reports are published by Market Matters in good faith based on the facts known to it at the time of their preparation and do not purport to contain all relevant information with respect to the financial products to which they relate. Although the Reports are based on information obtained from sources believed to be reliable, Market Matters does not make any representation or warranty that they are accurate, complete or up to date and Market Matters accepts no obligation to correct or update the information or opinions in the Reports. Market Matters may publish content sourced from external content providers.
If you rely on a Report, you do so at your own risk. Past performance is not an indication of future performance. Any projections are estimates only and may not be realised in the future. Except to the extent that liability under any law cannot be excluded, Market Matters disclaims liability for all loss or damage arising as a result of any opinion, advice, recommendation, representation or information expressly or impliedly published in or in relation to this report notwithstanding any error or omission including negligence.