The high flying IT sector keeps roaring higher (XRO, APX, TNS, ALU)
The market did an about turn yesterday, holding up well when it looked likely to drop around -0.5%, interestingly we again appeared to see SPI futures buying as the US S&P500 futures drifted lower which supported the ASX200 on what was a surprisingly quiet day. This time the banks and financials were firm while the energy sector struggled – the market continues to experience sector rotation almost daily with little evidence of net fresh monies entering / exiting the market at current levels.
The casino saga which has unfolded this week turned another page on Wednesday with Crown (CWN) falling -9.1% while Star Entertainment (SGR) performed better slipping less than -2%, at this stage we are comfortable bystanders but it feels like we will see further action in the sector this year, if not in the coming weeks. This morning the AFR has suggested 5 reasons why Wynn Resorts may come back and try and buy CWN, this is certainly a story likely to be in the press for a while. Our “Gut Feel” is CWN under $13 and SGR below $4.40 are starting to show decent risk / reward but if we are correct and the $A rallies it will devalue Wynn’s bid for CWN.
This morning Scott Morrison has called the Federal election for May 18th, no surprise there but will the market now start to focus on a Labor government?
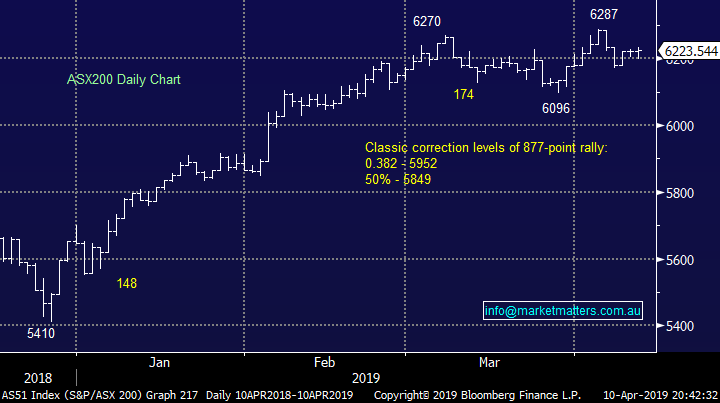
No change, we feel the market is positioning itself for a begrudging pullback towards 6000 and the recent few days of consolidation around the psychological 6200 area fits our negative picture but a close below 6180 is required technically for us to feel on the money.
The ASX200 has now achieved our upside target area switching us back to a neutral / bearish stance short-term.
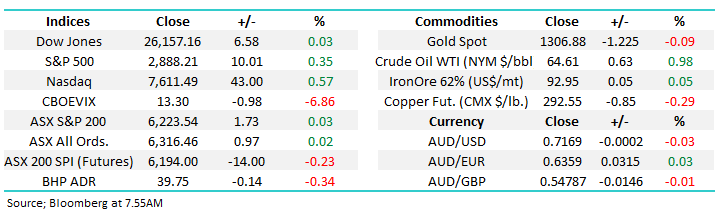
Overnight the US indices were firm led by the tech based NASDAQ which rallied +0.57% while the Dow was basically unchanged. However the SPI is calling the ASX200 down over 10-points with BHP slipping 15c in the US not helping.
Today we are again going to look closely at the Software & Services sector for any clues as to how to play this high flying, high valuation sector plus looking to see if its providing any clues to the health of the overall market.
ASX200 Chart
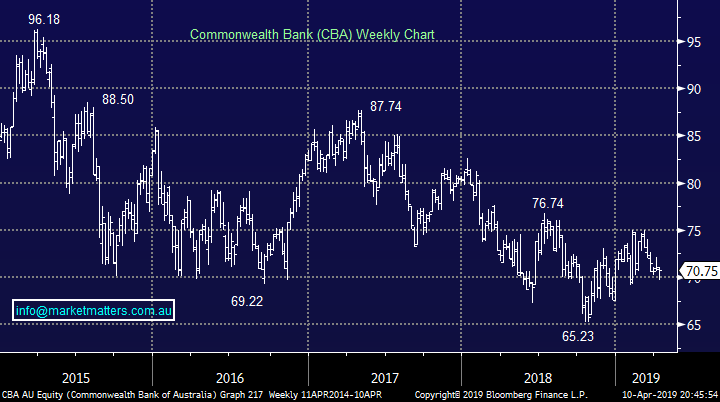
Commonwealth Bank (CBA) $70.75
Yesterday we took a small profit on 20% of our CBA position into a relatively strong day, always a nice time to be a seller. We now have a 24% exposure to the Australian banking sector in our Growth Portfolio, evenly spread across CBA, NAB and Westpac. The logic is we no longer want to be overweight the sector following its strong recovery from the December lows e.g. CBA has bounced 15%, a healthy recovery.
MM has simply gained some sector flexibility to buy weakness if it eventuates later in 2019.
Commonwealth Bank (CBA) Chart
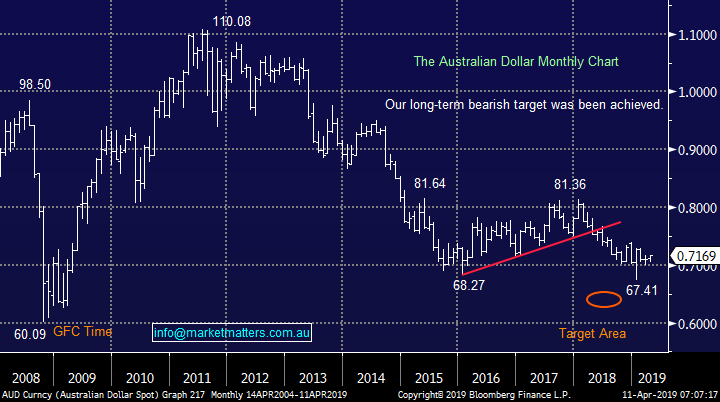
Australian Dollar $A 71.70c
Yesterday the Westpac’s consumer confidence index surprised on the upside, jumping back above the 100 point mark vs an expected print of 97. Westpac noted that those surveyed after the budget showed higher readings than those before. This helped the consumer discretionary names trade higher but it will take more than one number for Australians to forget falling housing prices although most people seem to be taking the situation in their stride, basically issues will only really unfold if we see forced sellers at these lower levels.
The focus yesterday was on a speech by deputy governor of the RBA Guy Debelle. He touched on a number of topics throughout the speech, but the main sticking point was the time he spent on the disconnect between unemployment and growth at the moment. “The strength of the market is at odds with the slow pace of GDP growth… the labour market could be a lagging indicator. But at the same time, businesses continued to invest through the end of 2018… forward looking indicators suggest future employment growth will remain solid.” This was enough to see the Aussie dollar jump higher and this morning its sitting above the highs of March as traders suddenly reconsider the imminent need / intention for the RBA to cut rates.
While we remain concerned with household debt levels in Australia and the potential for a recession moving forward we believe the “bad news” is already largely built into the $A which has declined over 35% since 2011.
MM remains bullish the $A initially targeting the 80c area – not a consensus view.
Australian Dollar ($A) Chart
Are the Software & Services stocks leading our market?
At different times markets dance to different tunes, over recent years it’s been concerns ranging from North Korea to interest rates, plus of course US – China trade. However within the indices themselves different sectors perform very differently e.g. back in 2015 everybody wanted banks while resources were “on the nose” a trend that has subsequently unwound dramatically.
Now within the Australian market investors are again aggressively chasing our IT sector in a manner that’s starting to remind us of late 2018 prior to the short sharp savage correction. It can be frustrating almost daily to see stocks like Appen Ltd (APX) and Xero (XRO) trading above where we took profit earlier in the year but “Fear of Missing out” (FOMO) has cost investors much hard earned money over the years.
Firstly when we compare the ASX200 with the IT based Software & Services Index the correlation over the last 6-months is almost perfect but unfortunately neither index clearly leads the other – shame!
ASX200 v Software & Services Index Chart
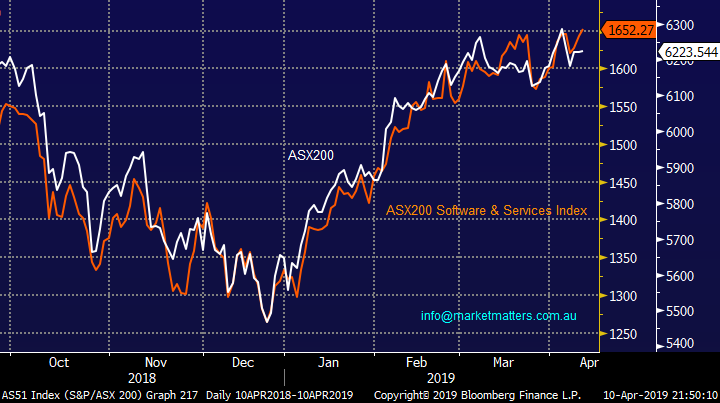
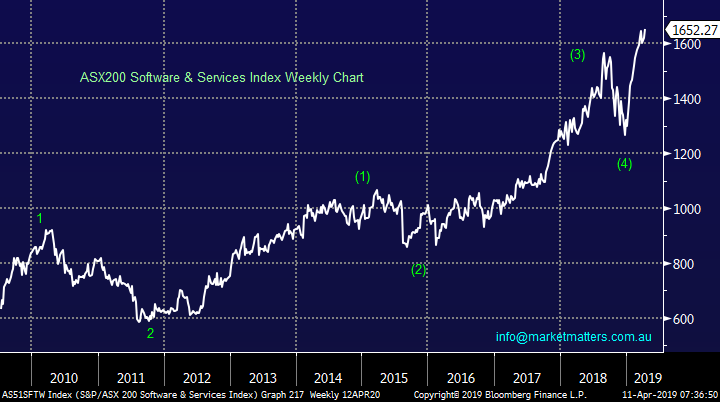
The IT Index has made the fresh all-time highs that we expected for most of 2019 but in a much faster manner than anticipated. However technically the picture is now far more clouded and a decent correction would not surprise, especially after the almost vertical buying of the sector since December. Our concern is many of these stocks are now priced for perfection while trading on valuations way above their US equivalents simply due to the lack of alternatives in the Australian market.
Consider the following 3 P/E’s based on estimated 2019 earnings, remember the saying we banded around in late 2018 – “GARP” i.e. growth at a realistic price not any price. Just a slight stumble in growth and any of these stocks could drop significantly:
Appen (APX) 51x, Wisetech Global (WTC) 119x and Altium (ALU) 55x.
ASX200 Software & Services Index Chart
Today we have taken a quick look at 4 stocks within the sector where we see decent potential risk / reward opportunities moving forward, remembering our general view that the sector is expensive and potentially close to a correction.
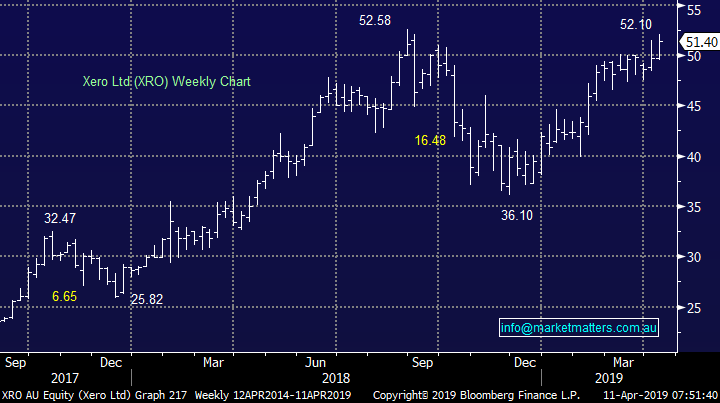
1 Xero (XRO) $51.40
Online accounting business XRO has enjoyed 2019 although not in as dramatic a fashion as some of the sector. In the first half of the year the company pleased the market by increasing revenue 37% supported by strong growth in subscribers. Our initial upside target is ~$55 but chasing around current levels is not exciting.
MM currently likes XRO around $47.50.
Xero (XRO) Chart
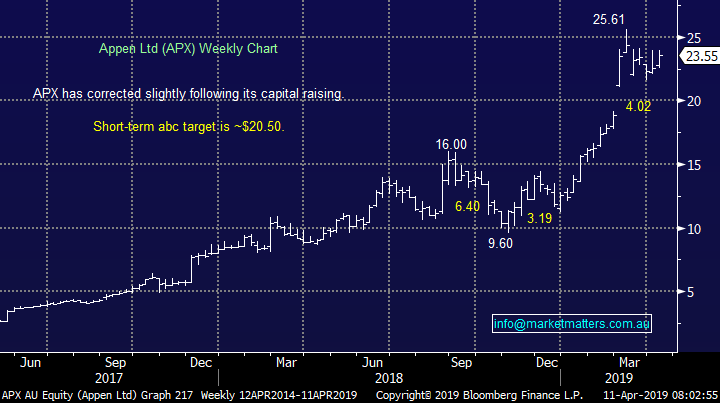
2 Appen Ltd (APX) $23.55.
Appen (APX) has been on our radar for a while after taking profits too early. However following the $US300m capital raising in March the risk / reward picture has become trickier especially as there are no guarantees around the fairly aggressive move with buying the unprofitable SaaS business. Previously other quality high performing businesses have come off the boil following a capital raise hence we will remain patient re-entering this artificial intelligence business.
MM currently likes APX below $21.
Appen Ltd (ASX) Chart
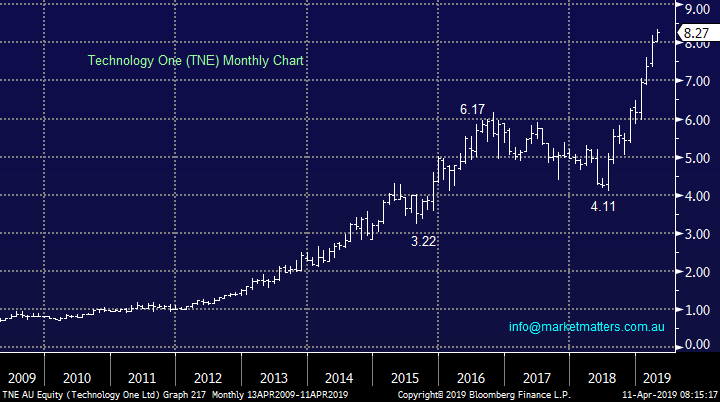
3 Technology One (TNE) $8.27
TNE has been a runaway train which unfortunately we never boarded, the financial management and software business has gone from strength to strength. The business announced strong full year results which showed a 9% increase in revenue to almost $300m and for good measure guided positively for 2019 earnings.
MM is now interested in TNE around the $7.50 area.
Technology One (TNE) Chart
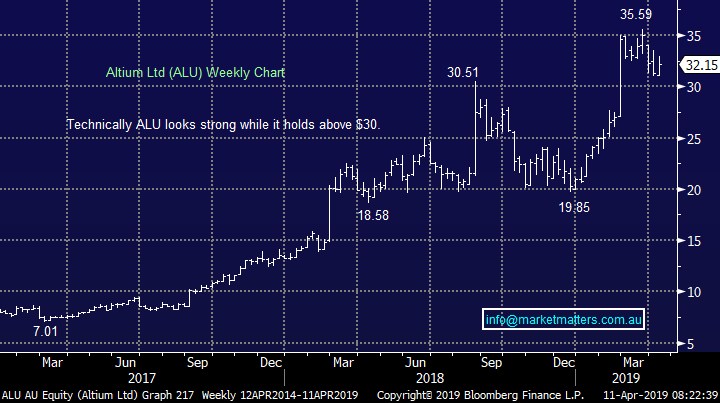
4 Altium (ALU) $32.15
ALU provides printed circuit board technology that finds its way into all sorts of electronic solutions - their shares exploded in February following an excellent half year profit report which showed 11% growth in earnings. However the stock is clearly not cheap although their management and strategy moving forward appears solid and exciting.
Bell Potter cut their rating on ALU to hold from buy at the end of March which has probably led to some of the profit taking over recent weeks – the stocks corrected ~10% from its highs.
MM likes ALU closer to $30 with stops below $29.
Altium (ALU) Chart
Conclusion
Of the 4 stocks we looked at today we like XRO around $47.50, Appen (APX) below $21 Technology One (TNE) around $7.50 and Altium (ALU) below $31.
Global Indices
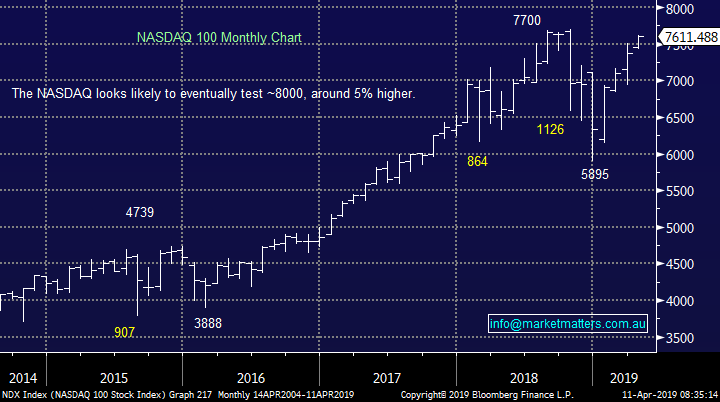
US stocks regained some of Tuesdays losses last night with the NASDAQ catching our eye rallying +0.57%.
Medium-term we still think the NASDAQ has another ~5% upside medium-term but the next few weeks look more questionable – importantly our 8000 target for the NASDAQ is only a good week in today’s market!
With both the S&P500 and tech based NASDAQ reaching fresh 2019 highs we have turned mildly neutral / negative US stocks.
US NASDAQ Chart
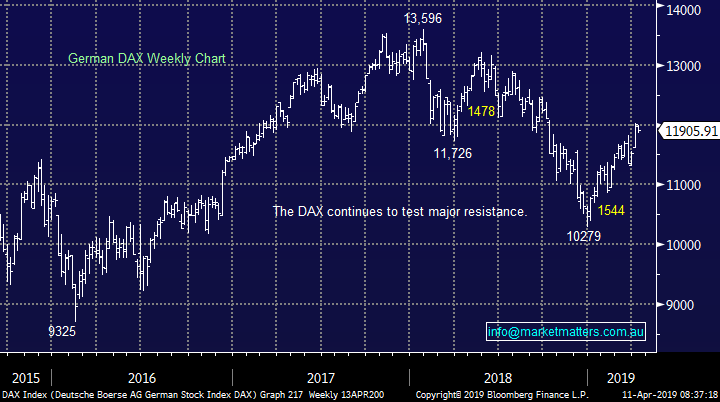
No change with European indices even as the BREXIT fiasco rolls on, markets are encountering some resistance from our targeted “sell zones”, we remain cautious or even bearish the region at this stage, especially into fresh 2019 highs.
German DAX Chart
Overnight Market Matters Wrap
· The US equity markets closed marginally higher, as investors digested the Fed Reserve official’s mixed thoughts on its current interest rates.
· Crude oil continues to climb after EIA data showed the biggest drop in gasoline stockpiles since 2017, offsetting a 7.03 million-barrel increase in crude, while Iron ore closed with little change.
· BHP is expected to underperform the broader market after ending its US session down and equivalent of 0.34% from Australia’s previous close.
· The June SPI Futures is indicating the ASX 200 to open 10 points lower, testing the 6215 level this morning.
Have a great day!
James & the Market Matters Team
Disclosure
Market Matters may hold stocks mentioned in this report. Subscribers can view a full list of holdings on the website by clicking here. Positions are updated each Friday, or after the session when positions are traded.
Disclaimer
All figures contained from sources believed to be accurate. Market Matters does not make any representation of warranty as to the accuracy of the figures and disclaims any liability resulting from any inaccuracy. Prices as at 11/04/2019
Reports and other documents published on this website and email (‘Reports’) are authored by Market Matters and the reports represent the views of Market Matters. The MarketMatters Report is based on technical analysis of companies, commodities and the market in general. Technical analysis focuses on interpreting charts and other data to determine what the market sentiment about a particular financial product is, or will be. Unlike fundamental analysis, it does not involve a detailed review of the company’s financial position.
The Reports contain general, as opposed to personal, advice. That means they are prepared for multiple distributions without consideration of your investment objectives, financial situation and needs (‘Personal Circumstances’). Accordingly, any advice given is not a recommendation that a particular course of action is suitable for you and the advice is therefore not to be acted on as investment advice. You must assess whether or not any advice is appropriate for your Personal Circumstances before making any investment decisions. You can either make this assessment yourself, or if you require a personal recommendation, you can seek the assistance of a financial advisor. Market Matters or its author(s) accepts no responsibility for any losses or damages resulting from decisions made from or because of information within this publication. Investing and trading in financial products are always risky, so you should do your own research before buying or selling a financial product.
The Reports are published by Market Matters in good faith based on the facts known to it at the time of their preparation and do not purport to contain all relevant information with respect to the financial products to which they relate. Although the Reports are based on information obtained from sources believed to be reliable, Market Matters does not make any representation or warranty that they are accurate, complete or up to date and Market Matters accepts no obligation to correct or update the information or opinions in the Reports. Market Matters may publish content sourced from external content providers.
If you rely on a Report, you do so at your own risk. Past performance is not an indication of future performance. Any projections are estimates only and may not be realised in the future. Except to the extent that liability under any law cannot be excluded, Market Matters disclaims liability for all loss or damage arising as a result of any opinion, advice, recommendation, representation or information expressly or impliedly published in or in relation to this report notwithstanding any error or omission including negligence.


