Considering the “second tier” iron ore stocks as the commodity surges (EVN, CGF, AWC, RIO, MGX, MIN, GRR)
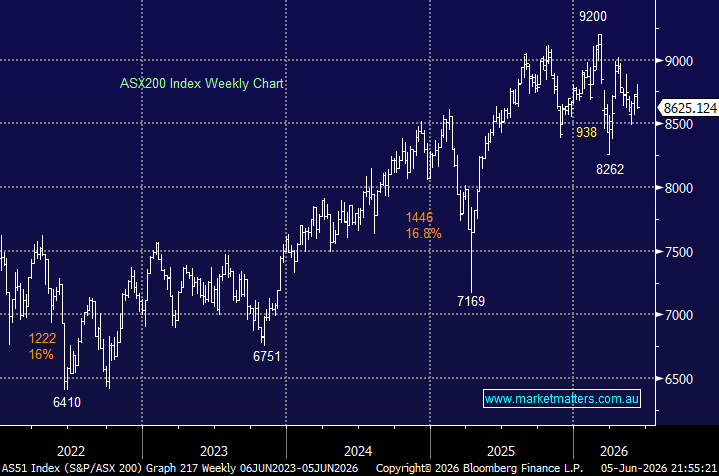
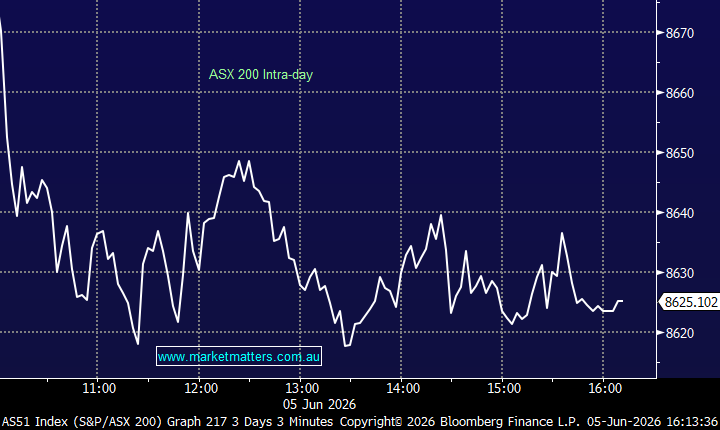
For the first time in 6-trading sessions the ASX200 failed to hold onto its early morning gains yesterday finally closing down albeit just 2-points but well below the early morning euphoria when the index threatened to break the psychological 6600 area. My observation from the mornings trade, primarily through the options markets, was we were seeing almost panic style covering of “short calls” with bearish bets exiting on mass – a classic characteristic of a short-term top in the making.
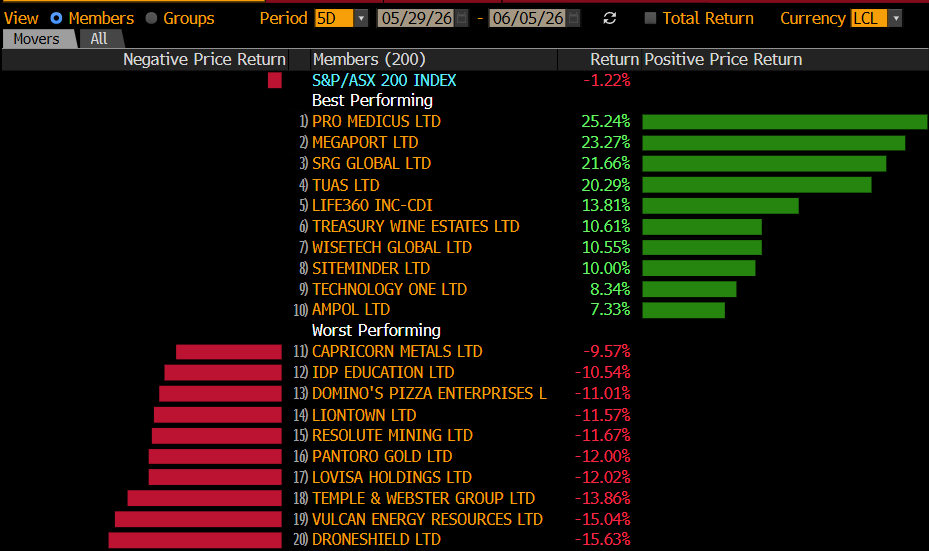
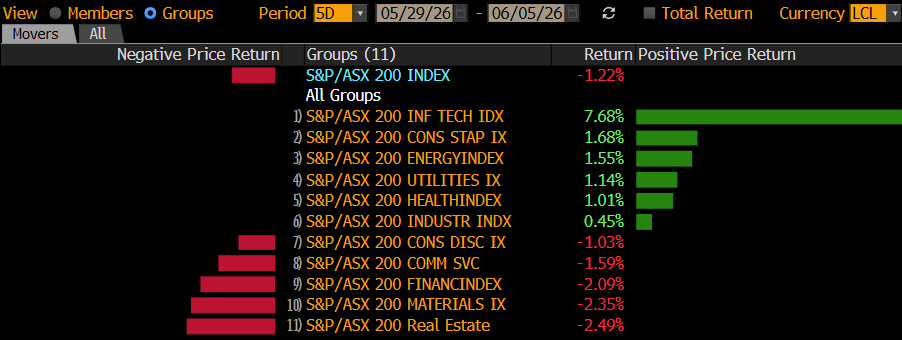
Under the hood yesterday we had a very mixed market with iron stocks surging while the Banks & Healthcare sectors struggled, overall there was still 8 stocks that closed up by more than 5% while the worst performer Challenger (CGF) was down only -3.8%. However with banks starting to feel tired its hard to imagine the market not taking a rest, it shouldn’t be a great surprise with Commonwealth Bank (CBA) already up over 9% during the last 3-months.
The desk was nervous early on yesterday after “Emeco Holdings (EHL) earnings guidance” came across our Bloomberg screens but they simply confirmed prior guidance which felt like a huge win with market expectations so low and it sent the stock up over 14% by the close having breached the +20% mark when the underlying index was at its euphoric best. EHL had been trading poorly into the update with a combination of concerns around the upcoming August report + tax loss selling clearly obvious.
With the stock trading on only on ~9x expected FY19 earnings with decent earnings growth potential the next few trading days will be fascinating, especially as we are long in the MM Growth Portfolio.
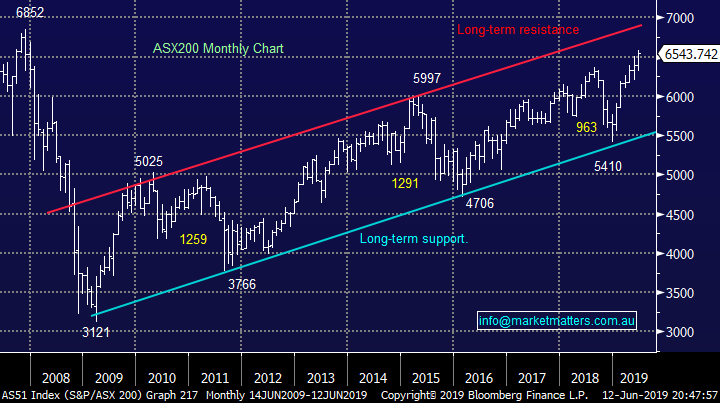
MM is now neutral the ASX200 following its test of the 6600-area but we remain bullish global equities for now.
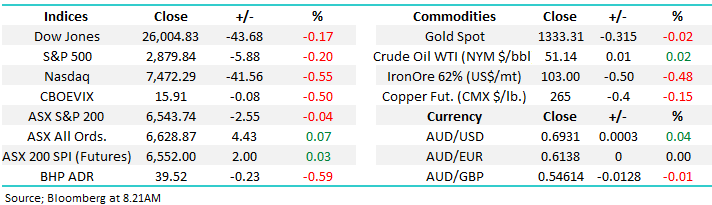
Overnight US stocks drifted lower with the Dow closing down just -0.17% while SPI futures are calling the ASX200 to open marginally higher, a slow start feels the go today.
In today’s report we have considered how long can Iron Ore prices stay high and what it means the second tier names?
ASX200 Chart
Yesterday we outlined our appetite for Australian gold stocks into weakness mentioning we were keen buyers of a correction in the precious metal sector e.g. NST under $8, RRL ~$4 and SAR ~$2.50 – all a fair bit lower.
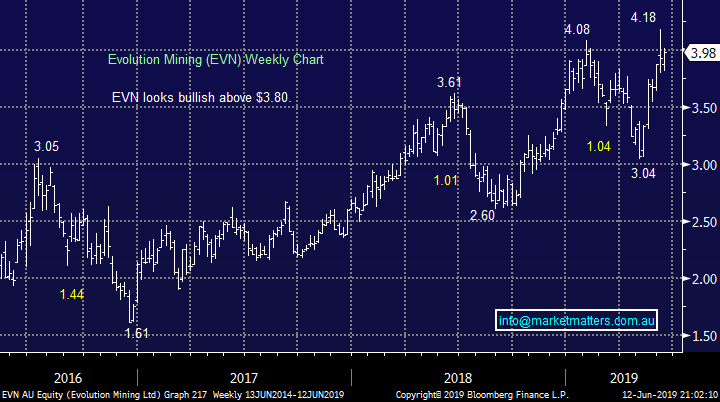
Hence overnight we were keen to read about the placement of 50m Evolution Mining (EVN) shares underwritten at $3.74 with selling derived from a swap / hedging arrangement by La Mancha Group.
The 6% discount to the close is relatively small and the outcome will certainly give us some solid clues around the markets current appetite for both EVN and the gold sector.
Evolution Mining (EVN) Chart
Funds management and annuities business Challenger (CGF) has endured an awful 18-months with its shares falling almost 50% while the ASX200 has surged to fresh decade highs – the stock was the ASX200’s worst performer yesterday.
However following poor performance from Australian and especially Japanese divisions the stocks still not particularly cheap trading on an Est P/E for 2019 of 14.2x compared to say Janus Henderson (JHG) on only 8.6x. I intend to cover local fund managers in a report over the coming weeks.
MM remains short-term bearish CGF looking for at least another 8% downside.
This is a great example for investors to remain open-minded to change as the stock was a market darling during much of the post GFC stock market rally. CGF is hosting an investor day today.
Challenger (CGF) Chart

Is it time to play the second tier iron ore names as the bulk commodity soars?
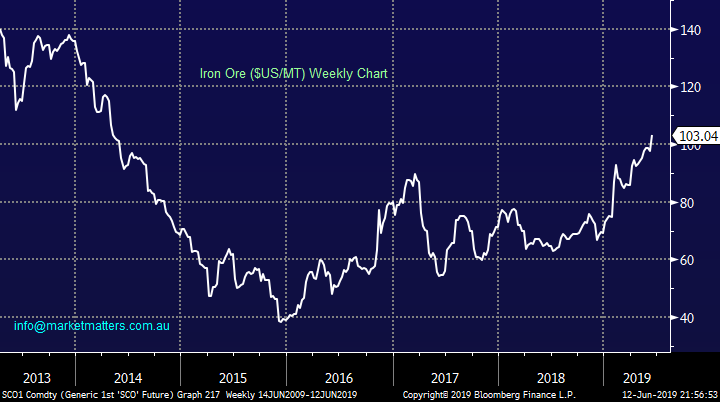
Iron ore has surged ~65% in 2019 primarily following the awful Vale disaster in late January which caused the death of well in excess of 200 people. As would be expected our major miners have followed suit with Fortescue (FMG) more than doubling in 2019 before we even consider its dividend bonanza. The first question we ask is how long can iron ore remain at these elevated levels because as we know spikes in commodity prices caused by major events virtually always reverse with a vengeance at some point in time.
At this stage we have a couple of major moving parts in the iron ore equation with supply constraints caused by Vale combined with strong demand from China which has seen their steel mills significantly rundown stockpiles. However as we see pundits now talking a potential bulk price of $US120/MT we are slowly getting the feeling that bullishness maybe getting ahead of itself. However the sectors already in “cum-upgrade” mode and every day that we see the price above $US100/M will add to this tailwind given analysts are still assuming a significantly lower average price for 2019 / 2020 i.e. $US90-95 in 2019 and $US80 in 2020.
To put things in perspective if todays price was used for 2020 earnings the major miners would see their profits surge ~60% and analysts are slowly capitulating to upgrade the sector – when Goldman’s joined the party in May we saw RIO make fresh decade highs although it has since corrected ~5%. Its these sorts of spikes that MM believes will make ideal selling opportunities in the sector
The bullish backdrop for the price of Iron Ore comes from growing scrutiny around the use of tailings dams, not just by Vale but the industry more generally. More scrutiny = slower production growth particularly for the 40mtpa that Vale has lost, plus of course the potential for further China stimulus. On the flipside, Brazil do have a vested interest in getting production back up so that could play into the regulatory environment becoming ‘more accommodative’ in that part of the world, but that’s unlikely in our view.
Given the ‘noise’ in the sector, technicals are now more important than ever.
At MM we feel that iron ore will likely hold between $US100 and $US110 over the coming weeks, and perhaps even months.
Iron Ore Chart
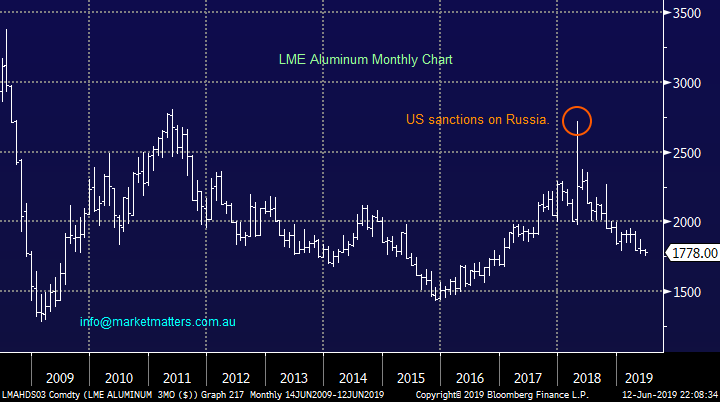
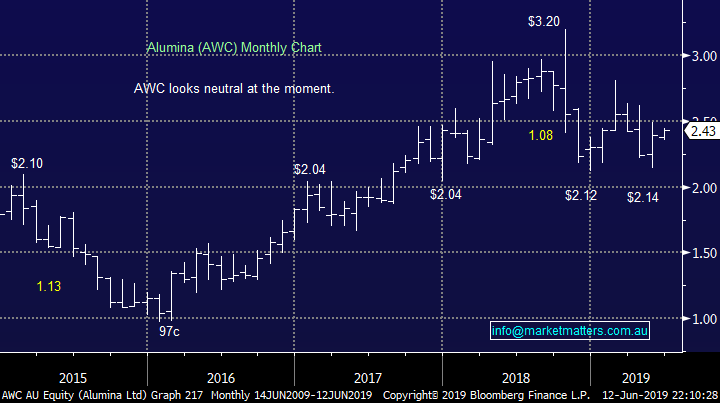
However, I do want to stress that it’s important for investors to remember that all good things come to an end and the following charts of Aluminium and Alumina (AWC) show the classic market reaction / movement to events. In this case the US imposed sanctions on Russia in the aluminium market back in mid-2018 sending the AWC price up ~30% but today the underlying commodity is making fresh multi month lows and AWC is 24% below its “blow-off” top.
Aluminium Chart
Alumina (AWC) Chart
The major iron ore names
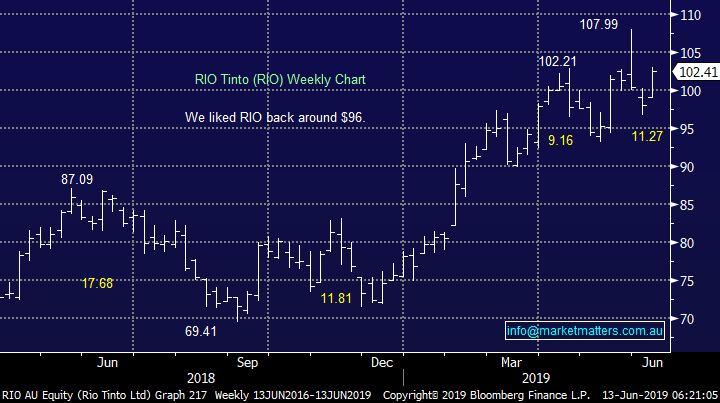
The “Big Three” iron ore names have enjoyed an awesome 2019 which has helped the ASX200 make fresh decade highs almost at will, over the last 6-months: Fortescue (FMG) +123%, RIO Tinto (RIO) +40% and BHP Group (BHP) +26% all before dividends. However importantly our targets on the upside are coming into view and as subscribers you know we wont be scarred to take some money from the table:
BHP ~$41 or 3% higher, RIO $108 or 5% higher and FMG above $9 or 5% higher – all 3 are not expected to pay dividends until August / September.
Assuming iron ore remains firm the anticipation of attractive fully franked dividends in only a few months should certainly help these stocks.
MM remains bullish the “Big Three” iron ore names for now.
RIO Tinto (RIO) Chart
The “second tier” iron ore names
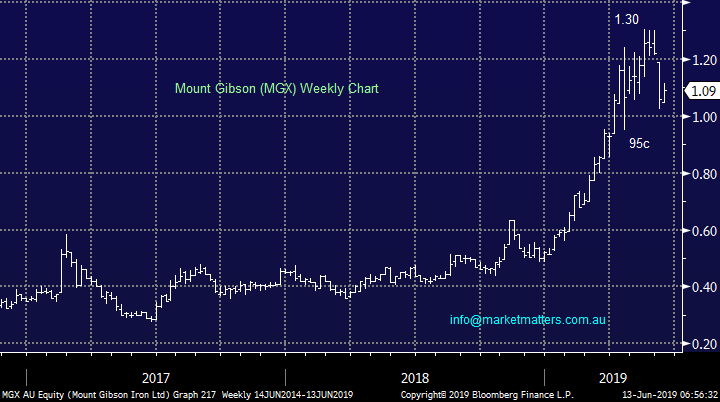
Today we have looked at 3 Australian iron ore stocks that are substantially smaller than the big end of town considered above i.e. Grange Resources (GRR), Mineral Resources (MIN) and Mount Gibson (MGX). Simply looking at their combined market cap of $4.3bn illustrates their relative size compared to say FMG which is now worth over $26bn. However as we can see from the chart below of MGX the smaller end of town can deliver the best results when timed correctly but of course the opposite is usually true when the music stops playing.
Mount Gibson (MGX) $1.09
Iron ore and production company MGX has soared over the last 12-months but very interestingly has corrected ~20% in recent weeks – this may be a sign that the iron ore rally is maturing fast as the slightly more “speccy” end of town disembarks the train.
The stock has become profitable over the last 3-years turning the share price on its head and directors (insiders) buying in 2018 proved a positive sign. In its first half results delivered earlier in the year we saw operating profits almost triple enjoying the tailwind of strong iron ore prices.
The stocks trading on an Est. P/E of 11x for 2019 compared to FMG at 7.4x making the larger business more attractive to us on both a valuation, risk and yield basis.
We believe this is one ship that’s sailed and would not be chasing MGX at current levels.
Mount Gibson (MGX) Chart
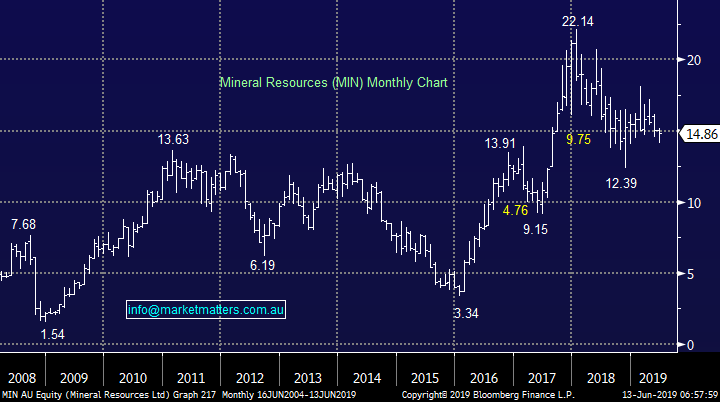
Mineral Resources (MIN) $14.86
MIN is a iron ore and lithium miner making it a hard play for the iron ore sector, especially considering the roller-coaster ride that lithium stocks have endured over the last 12-months – MIN has plunged ~30% over the last year with falling lithium prices more than trumping rising those of iron ore.
Last month the business upgraded guidance for EBITDA for fiscal 2019 of between $360-$390m but the share price continues to stay in the doldrums, never a good sign.
MM has no interest in MIN and would rather play both iron ore and lithium through purer stocks.
Mineral Resources (MIN) Chart
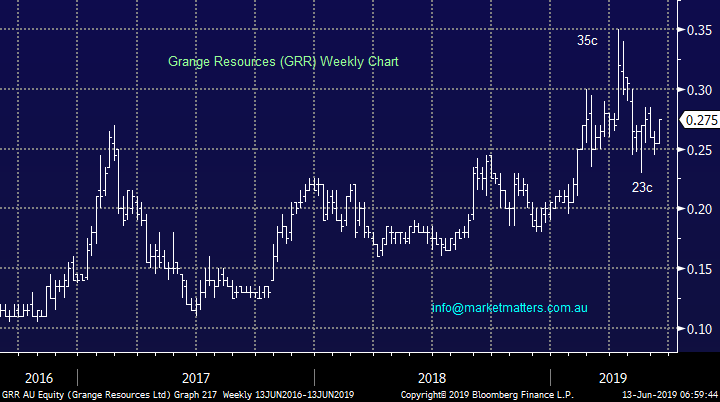
Grange Resources (GRR) 27.5c
Lastly “speccy” GRR which explores for iron ore in Australia and Malaysia plus gold on our fare shores, while mining iron ore pellets and magnetite. The business has a massive following of “Retail punters” due to its low valuation and even a decent yield of above 7% fully franked.
Last calendar year the business made almost $113m on revenue close to $370m so its not a true “speccy” as such, there is foundation in the business. This stock is too much like trading for us but I do like the risk / reward for aggressive players of buying around 28c using stops at 24c.
MM has no interest in GRR at this point in time but can see why others like it.
Grange Resources (GRR) Chart
Conclusion (s)
At this stage of the iron ore cycle we believe its time to stay with the big, high yielding names i.e. BHP, FMG and RIO.
Global Indices
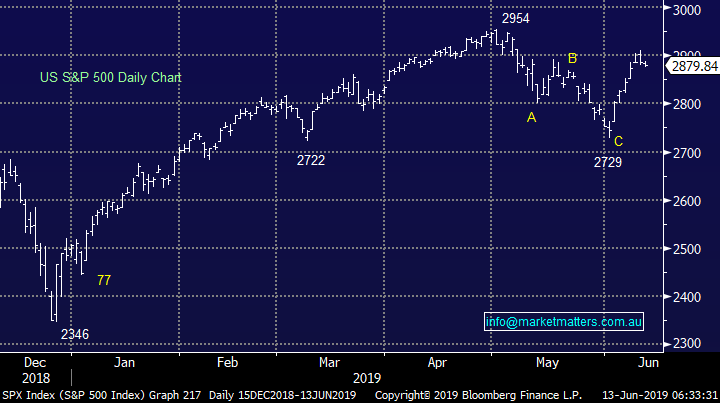
Nothing new with our preferred scenario the recent pullback was a buying opportunity although we are initially only looking for a test of / slight new 2019 highs from US indices.
The fresh dovish stance by the Fed has helped the S&P500 get within 2% of its all-time high, perhaps some positive news from this month’s G20 meeting between the US & China on trade will create the market optimism for a test of the large psychological 3000 area.
US S&P500 Index Chart
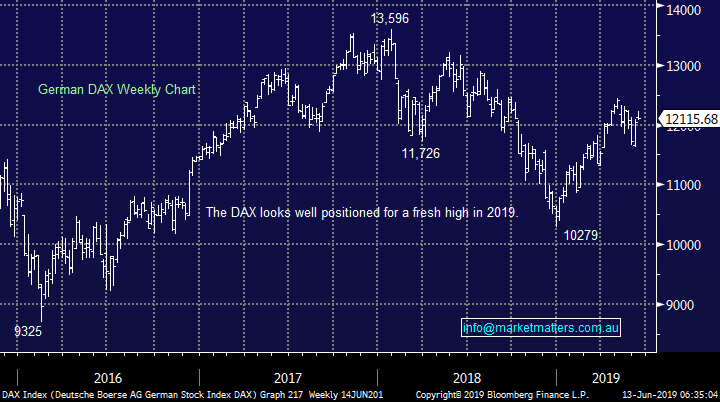
No change again with European indices, we remain cautious European stocks but the tone has improved recently and fresh highs in 2019 look a strong possibility.
German DAX Chart
Overnight Market Matters Wrap
· The US remained on standby overnight, giving back little of its recent gains as investors remain cautious on the Fed rate decision next week and US-China tensions.
· The oil sector sold off overnight after the oil price slumped further, with the price of crude at its lowest level since January, back towards US$51/bbl., following an unexpected surge in US oil inventories of 2.2m bbl. vs expectations of a fall of 480,000 bbl.
· BHP is expected to underperform the broader market after ending its US session down 0.59% from Australia’s previous close.
· The June SPI Futures is indicating the ASX 200 to open marginally higher this morning, testing the 6550 level.
Have a great day!
James & the Market Matters Team
Disclosure
Market Matters may hold stocks mentioned in this report. Subscribers can view a full list of holdings on the website by clicking here. Positions are updated each Friday, or after the session when positions are traded.
Disclaimer
All figures contained from sources believed to be accurate. Market Matters does not make any representation of warranty as to the accuracy of the figures and disclaims any liability resulting from any inaccuracy. Prices as at 13/06/2019
Reports and other documents published on this website and email (‘Reports’) are authored by Market Matters and the reports represent the views of Market Matters. The MarketMatters Report is based on technical analysis of companies, commodities and the market in general. Technical analysis focuses on interpreting charts and other data to determine what the market sentiment about a particular financial product is, or will be. Unlike fundamental analysis, it does not involve a detailed review of the company’s financial position.
The Reports contain general, as opposed to personal, advice. That means they are prepared for multiple distributions without consideration of your investment objectives, financial situation and needs (‘Personal Circumstances’). Accordingly, any advice given is not a recommendation that a particular course of action is suitable for you and the advice is therefore not to be acted on as investment advice. You must assess whether or not any advice is appropriate for your Personal Circumstances before making any investment decisions. You can either make this assessment yourself, or if you require a personal recommendation, you can seek the assistance of a financial advisor. Market Matters or its author(s) accepts no responsibility for any losses or damages resulting from decisions made from or because of information within this publication. Investing and trading in financial products are always risky, so you should do your own research before buying or selling a financial product.
The Reports are published by Market Matters in good faith based on the facts known to it at the time of their preparation and do not purport to contain all relevant information with respect to the financial products to which they relate. Although the Reports are based on information obtained from sources believed to be reliable, Market Matters does not make any representation or warranty that they are accurate, complete or up to date and Market Matters accepts no obligation to correct or update the information or opinions in the Reports. Market Matters may publish content sourced from external content providers.
If you rely on a Report, you do so at your own risk. Past performance is not an indication of future performance. Any projections are estimates only and may not be realised in the future. Except to the extent that liability under any law cannot be excluded, Market Matters disclaims liability for all loss or damage arising as a result of any opinion, advice, recommendation, representation or information expressly or impliedly published in or in relation to this report not withstanding any error or omission including negligence.