Do we see any value in any of the out of favour base metal stocks? (ASL, OZL, SFR, WSA, AWC)
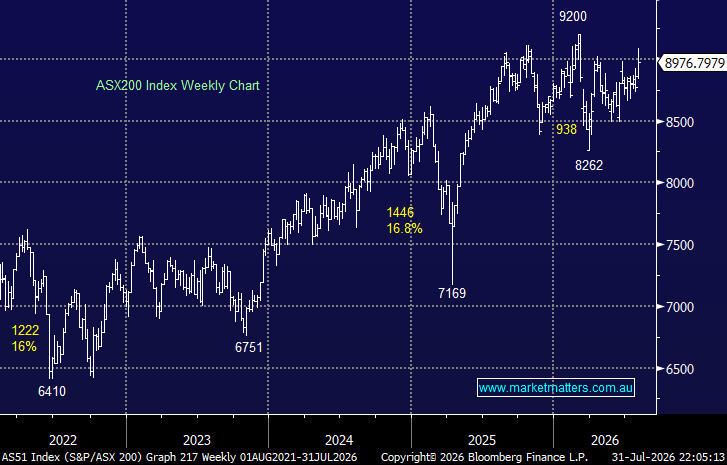
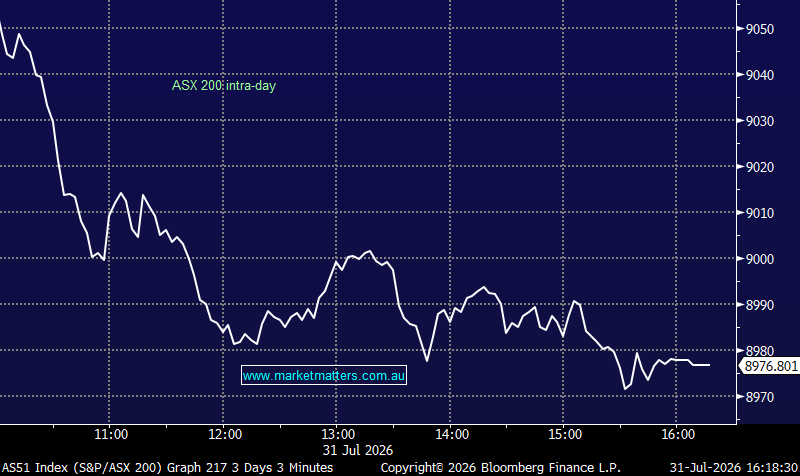
The ASX200 recovered exceptionally well from early losses yesterday to close up +0.2% but more importantly almost 50-points from the day’s low as we again saw buyers step up to accumulate into any weakness. In a relatively quiet day on the sector level it shouldn’t come as a surprise that when all of the “Big 4” banks close in the black that the index remains resilient, yet again the beneficiaries of lower bond yields enjoyed solid buying with only 1 of the 20 members of the Real Estate Sector falling, and that was property developer Aveo Group (AOG) which hit the market with a downgrade.
The EOFY is now only 4 trading days away and assuming no negative macro influences are lurking around the corner the current market strength feels likely to propel us to fresh 2019 highs this week. At MM we remain in “sell mode” looking to increase our cash position and / or move the portfolio (s) to a more defensive stance and while price action / momentum has continually told us to remain patient, we are getting closer to “tweaking” our current positioning - NB: we do anticipate pressing some sell & switch button (s) in the coming 1-2 weeks.
The local market has continued to shrug off downgrades / poor results with only 1-day into this week Metcash (MTS) falling almost 10% following the release of its full year result while Aveo Group (AOG) closed down over 5% following the release of a disappointing trading update, although it was down over 11% earlier in the day. Usually we say that a market that rallies on bad news is strong but my “Gut Feeling” is we may get one downgrade or bad result too many in the weeks / months ahead that will at least make the current bull market pause for some thought.
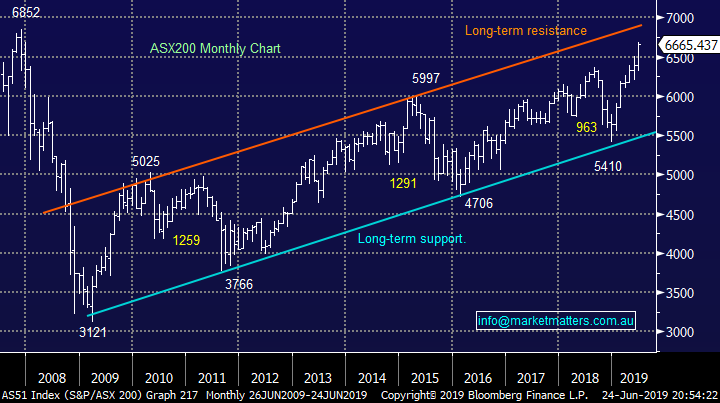
MM is bullish the ASX200 while it holds above 6580 especially as we remain short-term bullish global equities for now, our target for the US still ~3% higher.
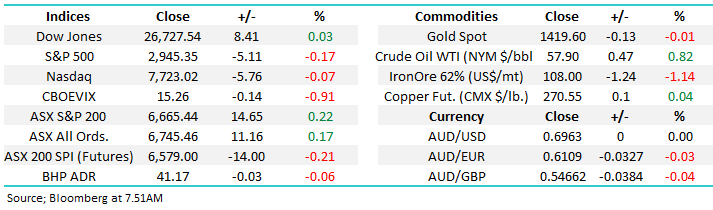
Overnight US stocks closed basically unchanged, giving back small early gains, as President Trump continues to beat a provocative drum towards Iran. The SPI futures are calling our market to open down around 11 points this morning.
In today’s report we have looked at a few base metal stocks that continue to struggle while both iron ore and gold booms.
ASX200 Chart
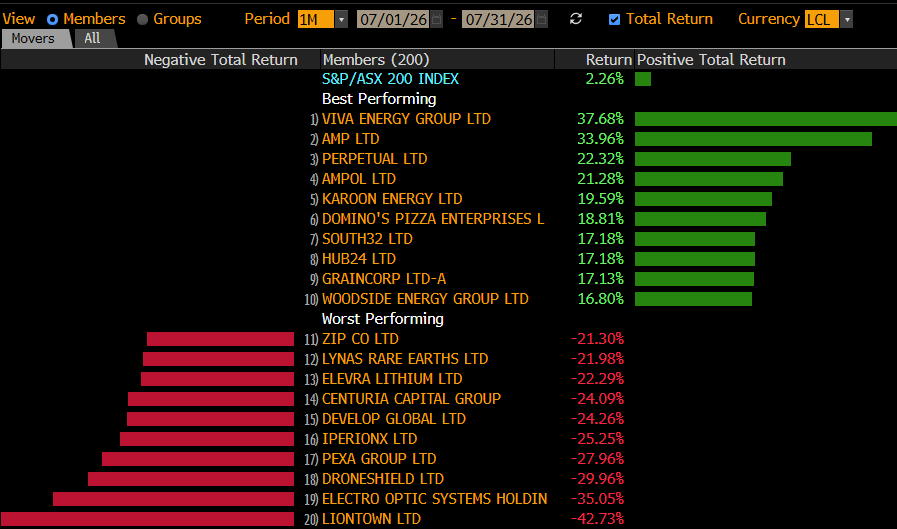
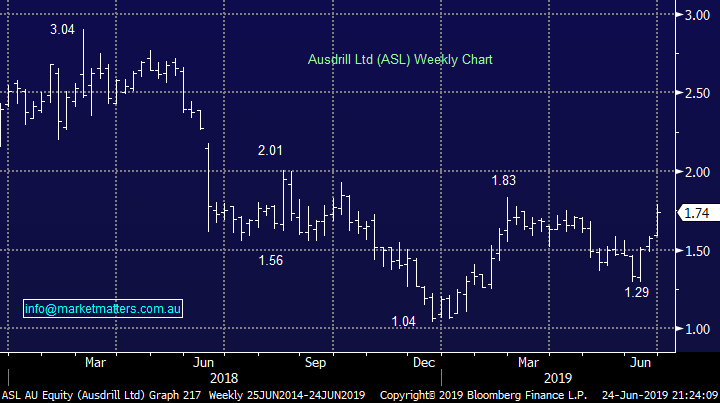
We were extremely happy to see our Growth Portfolio holding ASL surge over 10% yesterday to take out line honours for the ASX200 following the announcement of a 5-year~$800m mining services contract in Botswana. We had been becoming frustrated with the WA based mining services business after we didn’t take profit around $1.80 earlier in the year but finally the stock looks on track to test our +$2 target area – hopefully we haven’t just jinxed this holding!
MM remains bullish ASL targeting a break above $2.
Ausdrill (ASL) Chart
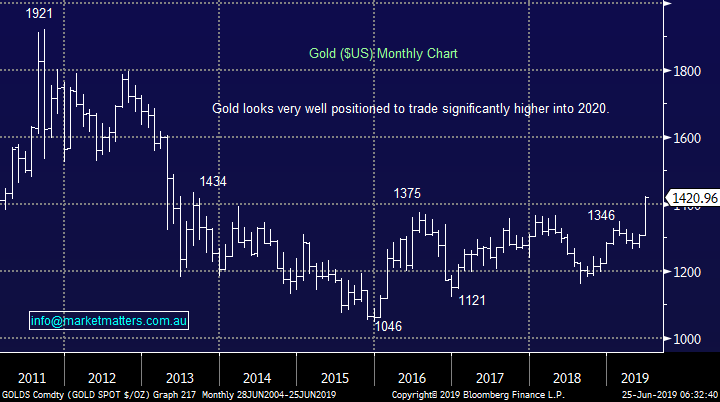
Gold again exploded out of the blocks yesterday rallying over $US10/oz early on helped by ongoing weakness in the $US, continued tensions around Iran sent the precious metal higher throughout the session and it finally closed up $US22/oz, or 1.6%.
The precious metal is trading at its highest level in almost 6-years with the Chinese buying gold & selling US Treasury bonds a key factor – makes sense not to chase bonds that pay ever diminishing returns, especially if you feel the $US is fully priced. The markets now anticipating an economic backdrop of both lower growth and bond yields in an already low-rate global environment which is understandably pushing scarred investors towards the safe haven of gold.
The World Gold Council has reported that global central banks have bought close to 150 tonnes of gold in Q1 of 2019 with China responsible for almost 50% of the purchases, MM believes this buying tailwind will not vanish in a hurry.
MM remains bullish the gold sector, now preferring it over iron ore.
Gold ($US/oz) Chart
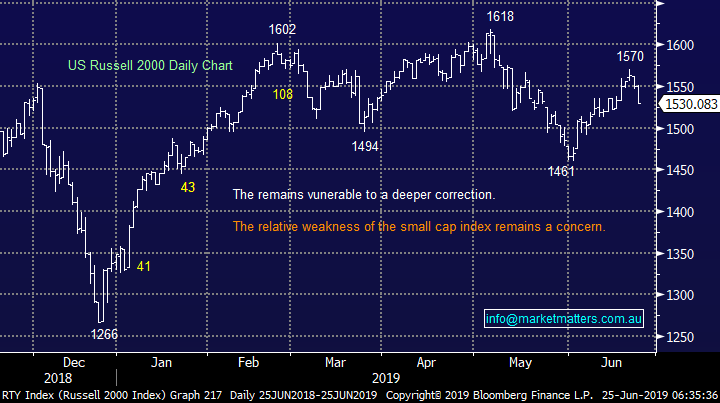
For the first time in 2019 we are receiving some warning signals from the US indices with the small cap Russell 2000 underperforming, this morning it closed over 5% below its all-time high while the larger cap S&P500 is less than 1% below its equivalent milestone which was achieved last Friday.
MM believes US stocks are losing upside momentum and internal strength.
Russell 2000 Chart
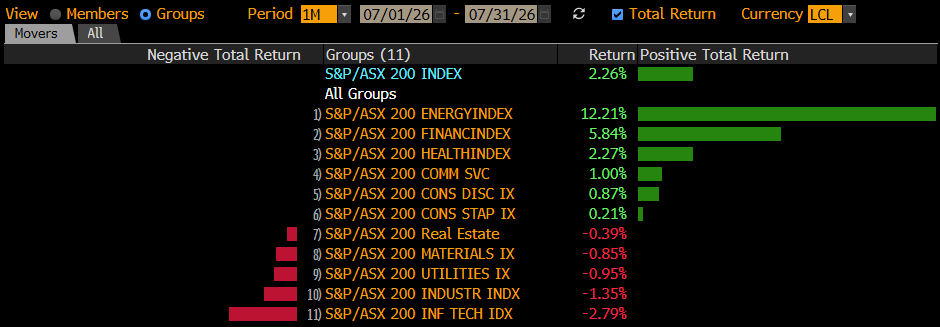
Assessing the base metal stocks
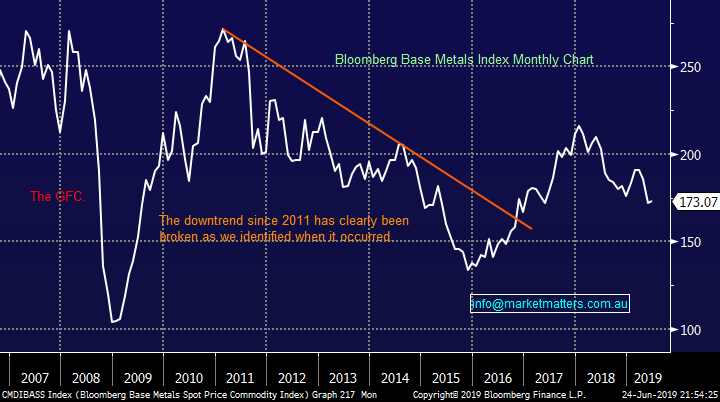
We have seen major performance differences across the resource stocks over the last 3-months with the iron ore and gold complex soaring while copper, aluminium and nickel stocks have all struggled. Today we have considered whether it’s time to fade the recent relative strength / weakness now we’ve seen a ~20% correction in base metal prices, no great surprise fundamentally as investors have become increasingly concerned around economic growth and US – China trade over the next few years. If the recent small pullback in the $US follows through its likely to help the industrial metals across the curve.
It’s important for investors to understand any buying within these stocks implies a contrarian / positive outlook on global activity – or in other words, lower interest rates / stimulus will ultimately work.
Bloomberg Base Metals Index Chart
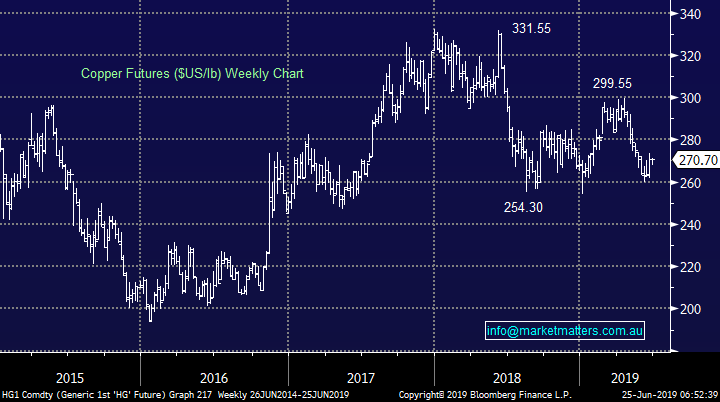
1 Copper ($US/lb).
Copper has corrected ~10% in 2019 although its closer to 20% below its 2018 highs. A positive resolution on US – China trade should act as at least a short-term positive tailwind for the copper price. Today we have KISS (keep it simple stupid) and focused on 2 of Australia’s main copper stocks Oz Minerals (OZL) and Sandfire Resources (SFR) who have experienced a very different few years.
MM is now neutral on copper.
Copper Chart
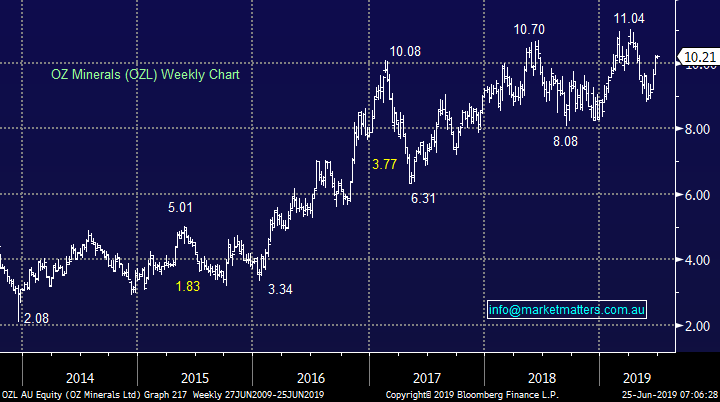
Oz Minerals (OZL) has been performing well operationally managing to shrug off the falling copper price although some gold exposure has certainly helped in more recent times. The business has been particularly successful in lowering its cost of production which is often a major issue across the resources space and while investors may not see any meaningful production increase this year its Carrapateena mine is expected to start ramping up moving forward. OZL has a long-term valuation tail that we believe the market hasn’t yet fully grasped or valued – top line growth could hit ~150 % over the period to 5 year 2024.
In the near term copper price tribulations will influence the share price but long term we feel the company valuation will grow and assuming we don’t slip into a recession many feel the copper market is expected to tighten in 2020. Also it’s a bonus that over the last year we’ve seen a little insider buying in the stock and more importantly no selling.
MM likes OZ Minerals (OZL).
OZ Minerals (OZL) Chart
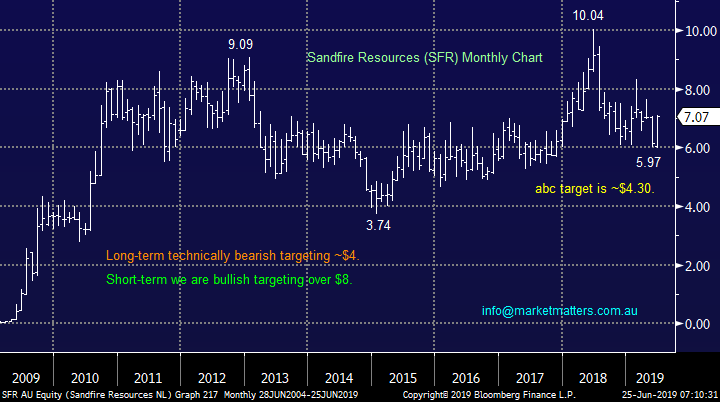
Sandfire Resources (SFR) has underperformed OZL as its been far more of a mirror of the copper price than its larger rival. Although the stock arguably hasn’t performed as poorly as the shares performance implies the combination of fears around US-China trade and a preference for OZL looks to have kept buyers on the sidelines.
Technically SFR is positive short-term but bearish medium/longer term.
MM is neutral SFR.
Sandfire Resources (SFR) Chart
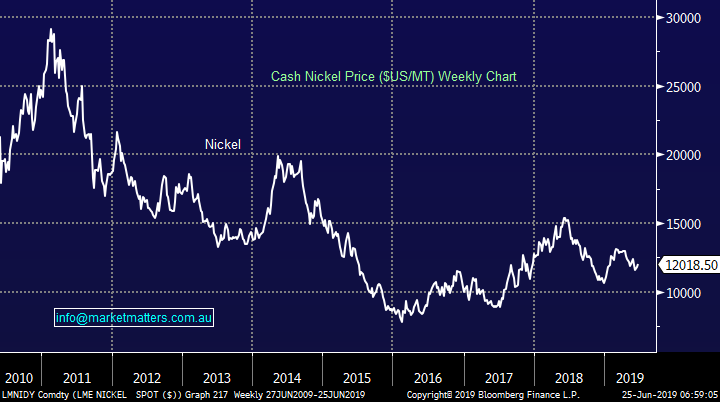
2 Nickel ($US/MT)
The nickel price has been in a bear market for almost 10-years with the price more than halving in that time. The net speculative short position on the LME has expanded above 7% of open interest back to levels not seen since October 2018, with US – China concerns likely encouraging the sellers while the long lead time associated with Electric Vehicles (EVs) has failed to ignite buying.
However, it’s not all demand concerns playing out here, stronger production than expected from Indonesia plus an announcement by the Philippine government that it is giving a number of suspended mines the opportunity to recommence production once they address environmental concerns has brought the supply side into focus, and we’ve all seen the impact that supply has on prices (Iron Ore).
MM is neutral nickel at present.
Nickel ($US/MT) Chart
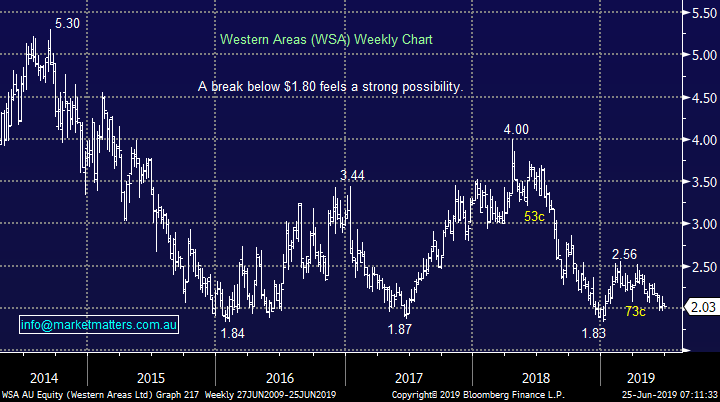
Western Areas (WSA) has been on the MM radar for months and we see no reason to alter our view of becoming aggressive buyers on a dip to fresh multi-year lows below $1.80, or on a failed spike down i.e. we have no interest at today’s levels.
MM likes WSA ~10% lower.
Westerns Areas (WSA) Chart
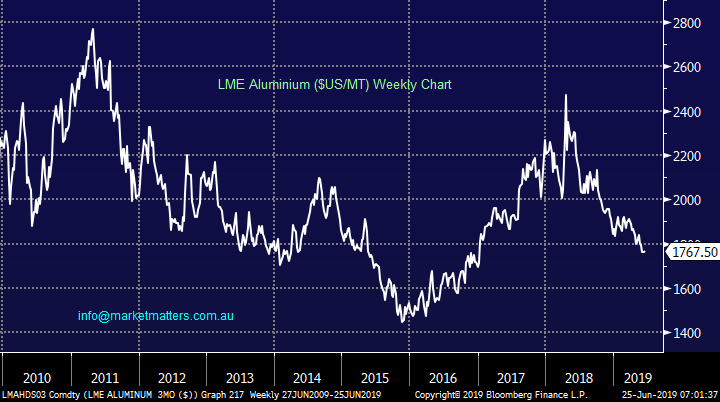
3 Aluminium
Similar to nickel the aluminium price has been in a bear market for almost a decade with the base metal down ~35% over that period. Like the whole industrial metal space concerns around US – China trade continue to weigh in recent times with spikes on the upside whenever the market gets a whiff of a potential resolution, but ultimately the downtrend has remained intact.
MM is neutral aluminium at present.
Aluminium ($US/MT) Chart
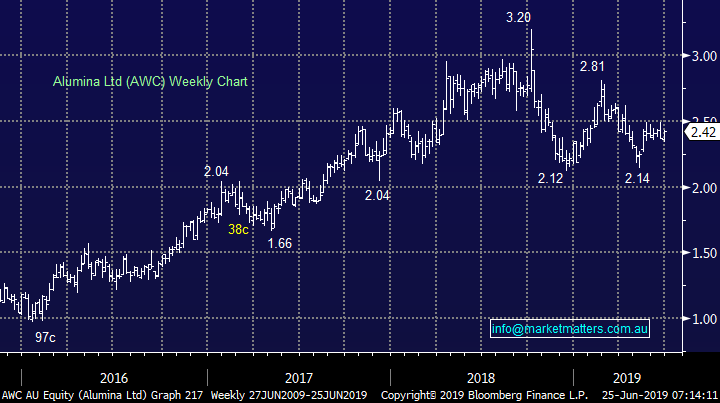
Shares in Alumina (AWC) have fallen ~20% since its panic rally in 2018 when Norwegian aluminium company Norsk Hydro ASA announced that it was preparing to shut down production from its alumina refinery Alunorte in Brazil.
In todays tumbling bond yield environment AWC may become an exciting after thought for the yield hungry Australian investor with its double digit fully franked yield attractive on all matrices.
MM is bullish AWC with stops below $2.30 – only 5% lower.
Alumina (AWC) Chart
Conclusion (s)
Of the base metal stocks we looked at today MM likes OZ Minerals (OZL) medium-long term and Alumina (AWC) more short-term.
Global Indices
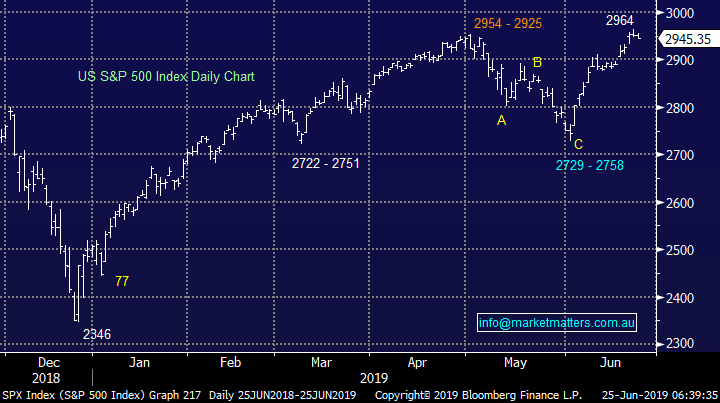
Again nothing new with our preferred scenario - the recent pullback was a buying opportunity with our ideal target the 3000 area, now only a few % higher.
The current dovish stance by the Fed has helped the S&P500 to test its all-time high, perhaps some positive news from this week’s G20 meeting between on trade between the US & China will create the market optimism for a test of the large psychological 3000 area.
US S&P500 Index Chart
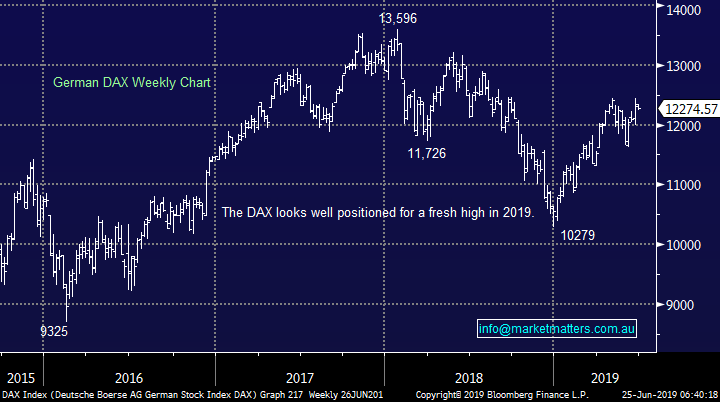
No change again with European indices, we remain cautious European stocks but the tone has improved recently and fresh highs in 2019 look a strong possibility.
German DAX Chart
Overnight Market Matters Wrap
· The US equity markets closed mixed overnight as investors focus on the next steps with expectations for monetary policy easing due to concerns of a slowing global economy.
· With tensions between US and Iran escalating (again), oil and gas producers slumped and were the worst performer against its peers, while crude oil continued to rise.
· With the stars slowly aligning for investors to sway back towards ‘safe haven’ assets, gold has hit six year highs along with US treasuries.
· The September SPI Futures is indicating the ASX 200 to open marginally lower, still hovering around the 6650 level this morning.
Have a great day!
James & the Market Matters Team
Disclosure
Market Matters may hold stocks mentioned in this report. Subscribers can view a full list of holdings on the website by clicking here. Positions are updated each Friday, or after the session when positions are traded.
Disclaimer
All figures contained from sources believed to be accurate. Market Matters does not make any representation of warranty as to the accuracy of the figures and disclaims any liability resulting from any inaccuracy. Prices as at 25/06/2019
Reports and other documents published on this website and email (‘Reports’) are authored by Market Matters and the reports represent the views of Market Matters. The MarketMatters Report is based on technical analysis of companies, commodities and the market in general. Technical analysis focuses on interpreting charts and other data to determine what the market sentiment about a particular financial product is, or will be. Unlike fundamental analysis, it does not involve a detailed review of the company’s financial position.
The Reports contain general, as opposed to personal, advice. That means they are prepared for multiple distributions without consideration of your investment objectives, financial situation and needs (‘Personal Circumstances’). Accordingly, any advice given is not a recommendation that a particular course of action is suitable for you and the advice is therefore not to be acted on as investment advice. You must assess whether or not any advice is appropriate for your Personal Circumstances before making any investment decisions. You can either make this assessment yourself, or if you require a personal recommendation, you can seek the assistance of a financial advisor. Market Matters or its author(s) accepts no responsibility for any losses or damages resulting from decisions made from or because of information within this publication. Investing and trading in financial products are always risky, so you should do your own research before buying or selling a financial product.
The Reports are published by Market Matters in good faith based on the facts known to it at the time of their preparation and do not purport to contain all relevant information with respect to the financial products to which they relate. Although the Reports are based on information obtained from sources believed to be reliable, Market Matters does not make any representation or warranty that they are accurate, complete or up to date and Market Matters accepts no obligation to correct or update the information or opinions in the Reports. Market Matters may publish content sourced from external content providers.
If you rely on a Report, you do so at your own risk. Past performance is not an indication of future performance. Any projections are estimates only and may not be realised in the future. Except to the extent that liability under any law cannot be excluded, Market Matters disclaims liability for all loss or damage arising as a result of any opinion, advice, recommendation, representation or information expressly or impliedly published in or in relation to this report not withstanding any error or omission including negligence.