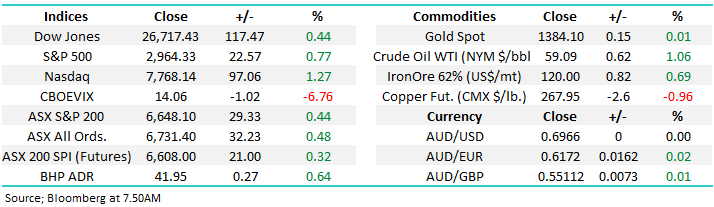
Is the current rally in IT stocks a breakout or blow-off? (NST, RIO, BHP, APX, XRO)
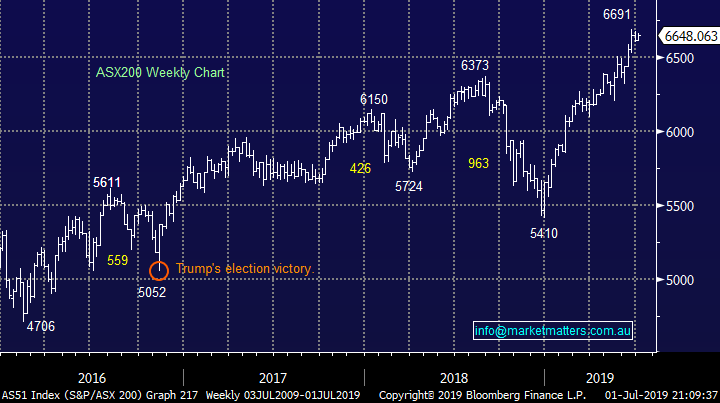
The ASX200 rallied 29-points yesterday to start July on a positive footing as the “Trump Bump” continues to roll on – the local market has now rallied 1600-points / over 31% since that fateful day in November 2016 when Donald Trump shocked most of the world to become President of the US. Markets were incredibly confused during that volatile day, when the counting started to forecast Trump was indeed going to win the ASX200 initially plunged before regaining much of the early losses, the Australian market ended up having a huge intra-day range of 5%. The late market optimism as investors started to focus on the incoming Presidents policies has proved well founded as our market has rallied an average of over 50-points per month ever since.
Ironically we felt yesterday was a pretty average performance by the local market with local gains relatively muted as we flagged was a risk on Monday, US futures were up ~1% making fresh all-time highs when our market packed up for the day but we remained 0.6% below the high for 2019. The standout yesterday was the lack of buying into early strength as opposed to particularly aggressive selling. The broad market was strong with over 70% of the ASX200 closing up on the day but with the heavyweight banks taking a breather its was hard for our index to make any meaningful headway. Also, our region was far less bullish than the US futures with both Hong Kong and New Zealand actually closing down on the day.
MM is now in “sell mode” looking to adopt a more conservative stance than over the previous 6-months.
Overnight US stocks gave back a little of their early enthusiasm with the Dow closing up 117-points, over 170-points below its intra-day high. Technically the failure to hold early gains by US stocks is a little disconcerting. The SPI futures are calling the ASX200 to open up around 20-points with BHP likely to lead the way after rallying almost 30c in the US as iron ore continues to surge.
In today’s report we are going to look at IT sector on its own merits and as a potential leader for the underlying ASX200.
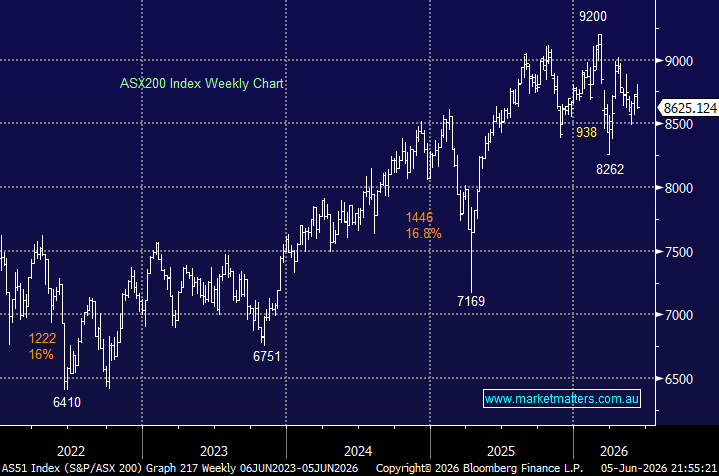
ASX200 Chart
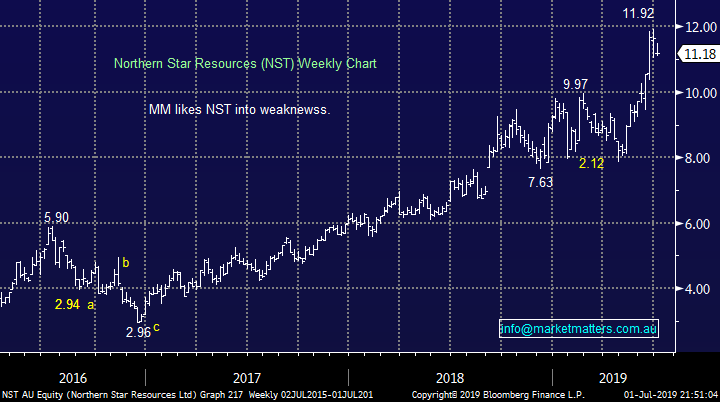
The gold sector has suffered some profit taking over recent sessions as initially US bond yields bounced, taking the $US higher with them, and then yesterday we saw the market breathe a sigh of relief on US – China trade leading to further outflows from perceived safe havens. We will be monitoring the pullback closely for an opportunity to increase our gold exposure either through increasing our Newcrest (NCM) holding or via another player like one of the sectors top performers Northern Star (NST).
MM still likes the gold sector into weakness with Northern Star (NST) one of our favourite stocks in the sector.
Northern Star Resources (NST) Chart
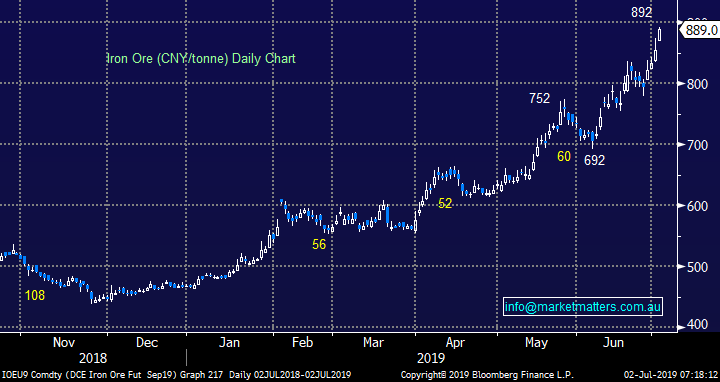
During the first trading session for July we’ve seen iron ore rally to fresh 5-year highs, up close to 100% since last December. The strength in the bulk commodity has continued as stock levels of iron ore at Chinese ports extend their decline still further.
I don’t for a minute want to compare bitcoin with a widely used industrial commodity like iron ore but the price action is feeling similar, and bitcoin has fallen 25% over the last few days after soaring over the last 3-months – my point is to be careful / open-minded when prices of anything rally unabated.
MM feels iron ore is getting very “frothy” but it’s a brave man who says sells.
Iron Ore Chart
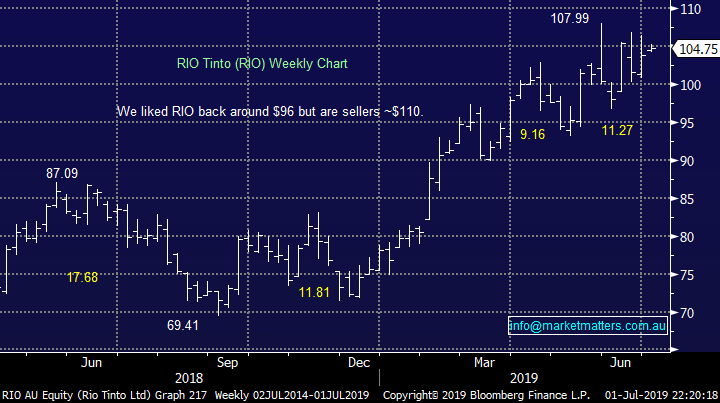
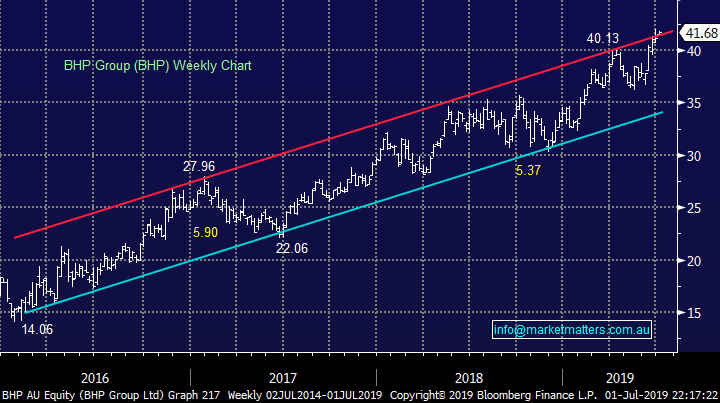
Major iron ore producers BHP Group (BHP) and RIO Tinto (RIO) have both rallied strongly following the iron ore price but interestingly both are feeling a little “toppy”:
1 – MM’s technical target for RIO is now only ~3.5% higher.
2 – BHP having tripled since its 2016 low is now testing its overhead resistance – it feels like the Big Australian is as popular today as it was unpopular 3-years ago.
RIO Tinto (RIO) Chart
BHP Group (BHP) Chart
Is the IT sector giving us any clues for this financial year?
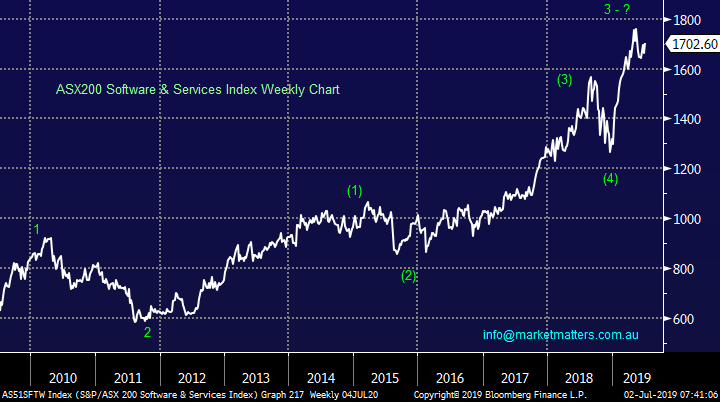
The ASX200 IT, or Software & Services Index, has been an excellent performer in 2019, totally outstripping our expectations. The index has many people describing it as “way too expensive”, especially when compared to its overseas counterparts but it’s not stopped the sectors advance. At MM we’ve actually been on this particular bandwagon and currently hold no IT stocks after going aggressively long in late 2018 but taking $$ too early. We now have to ponder if too many investors have already jumped on this bandwagon view leaving few “weak sellers” at current levels.
Interestingly “under the hood” we’ve had hiccups by 3 of the 11 socks in the ASX200’s sector – Link (LNK), Bravura (BVS) and Afterpay(APT). The fact that the index is being hauled higher by just 3 heavyweights which are up over 20% over the last 3-months is negative internal characteristic.
We are not planning on chasing any stocks in the sector at this point in time but new highs would not surprise – the Australian WAAAX’s area as hot the US FANG’s!
MM feels short-term the IT index can still make fresh 2019 highs.
NB The WAAAX stocks are Wisetech, Appen, Altium, Afterpay and Xero.
ASX200 Software & Services Index Chart
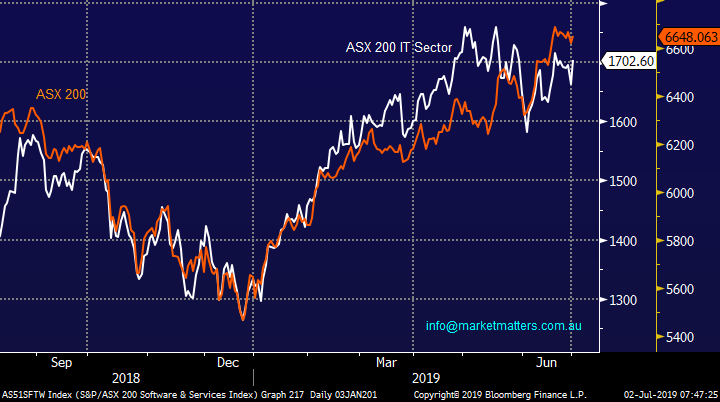
The IT sector has not particularly led the ASX200 although it has often magnified its performance. Unfortunately no correlation here to help us tweak portfolio weightings / exposure.
ASX200 Software & Services & ASX200 Index Chart
Today we are going to focus on the 3 stocks which have continued to rally strongly within the sector as others have failed. Over the last 3-months as both the ASX200 and IT sector have remained firm while over 70% of the group are in the red or up a relatively small amount. However, as we said previously 3 names have soared an average of almost 25% in Q2 of 2019, if / when these struggle the sector may come back to the pack at the very least.
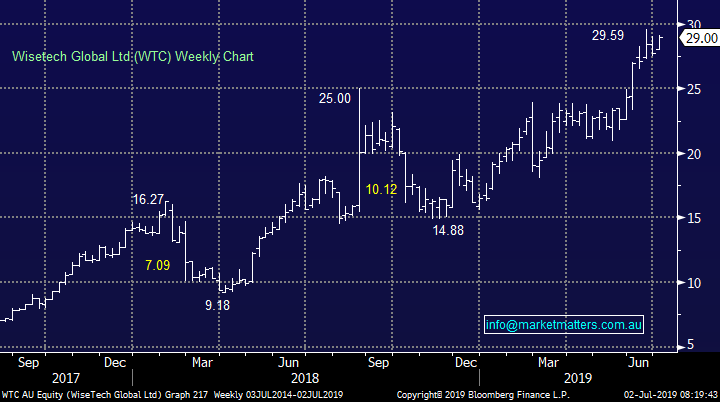
1 Wisetech (WTC) $29.
Wisetech Global (WTC) is up +25.4% over the last 3-months and its clearly hot right now but the obvious question is do we believe its good value at current levels. The designer / developer of cloud based logistics software is trading on an enormous valuation, like most of the sector, but its hard to forecast exactly when they will come back to the pack but when they do its usually aggressive as the momentum players depart in droves as we saw in Q4 of 2018 i.e. down 40% in just a few months.
Hence at MM when we evaluate these stocks it’s largely a combination of simple risk / reward plus technicals because even if we like the business the share price valuation brings with it an enormous degree of optimism on future corporate performance. Our “best guess” at this stage is WTC is poised to consolidate between $26.50 and $30.50 leaving us technically neutral.
MM has no interest in WTC at current levels.
Wisetech Global (WTC) Chart
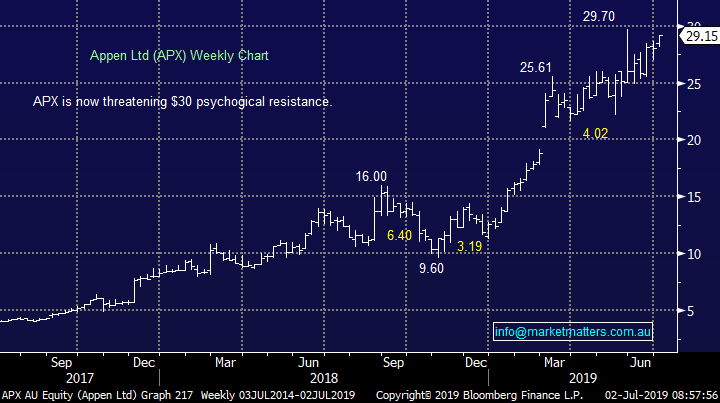
2 Appen (APX) $29.15.
Global leader in the development of human annotated datasets for machine learning and artificial intelligence (AI) Appen (APX) has rallied +27.8% over the last 3-months. In FY 2018 Appen posted a greater than 150% increase in underlying EBITDA to $71.3 million due to the combination of increasing demand for quality training data from the accelerating AI market plus its acquisition of the Leapforce business. We like this business but the issue is again the valuation, the technical / risk reward is far more attractive around $23 – not out of the question, its shares also plunged over 40% in Q4 of 2018.
The valuation issue for Appen is illustrated by the stock trading on around 4x that of its nearest rival, US-based Lionbridge, which was purchased two years ago by Private Equity when its customers included Microsoft and Google ilustrating the massive degree of optimism built into APX’s share price
MM has interest in APX but almost 20% lower – technically this feels a strong possibility.
Appen Ltd (APX) Chart
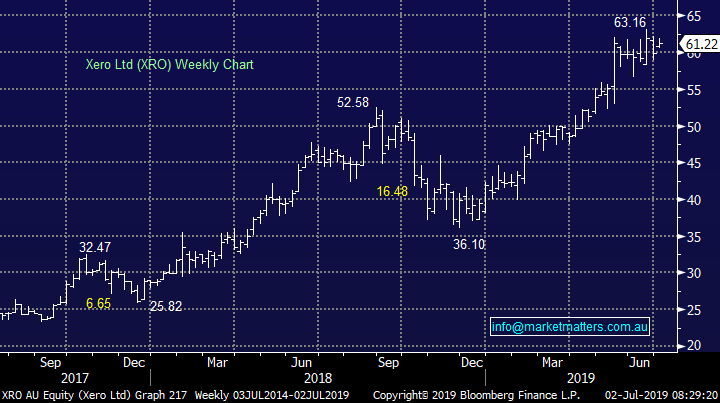
3 Xero (XRO) $61.22.
Xero (XRO) has rallied +20.9% over the last 3-months courtesy of the business recording a 37% increase in operating revenue to over NZ$255 million in the first half of the last financial year. The company has enjoyed strong growth in subscriber numbers during 2018 with the board reporting in May 2018 1.386 million subscribers, an impressive 25% of these joined in FY18.
We like the direction the company is taking the business and similar to Appen it’s a question of what’s a good entry level. Technically this is currently a tricky picture and we would give it a little more time to unfold assuming we don’t see a sharp pullback in the meantime.
MM will consider XRO ~10% lower.
Xero (XRO) Chart
Conclusion (s)
Of the 3 stocks looked at today we like Xero (XRO) at least 10% lower and Appen (APX) 20% lower, in other words we are not keen buyers of current strength.
Global Indices
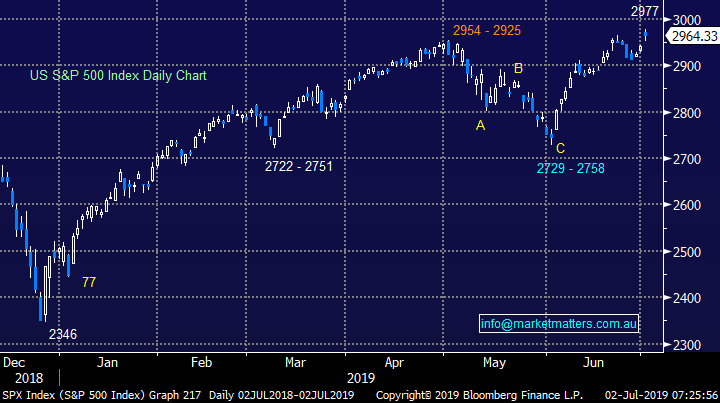
The widely followed S&P500 index struggled last night after making fresh all-time highs, no sell signals have been generated of yet but the technical picture is clouding rapidly.
The technical target for the NASDAQ is ~2% higher but other indices are feeling “toppy” definitely time to be openminded.
US S&P 500 Index Chart
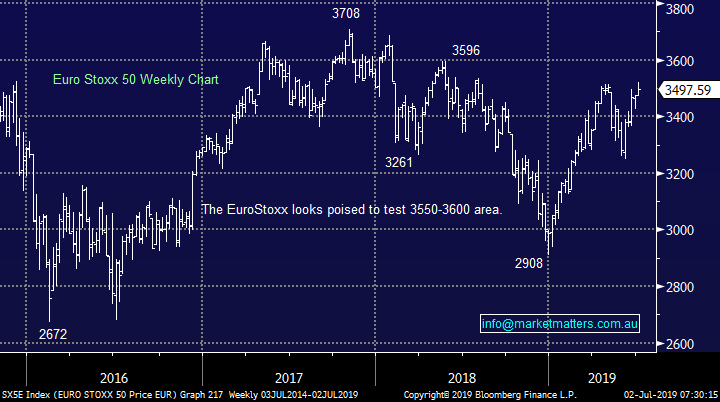
No change again with European indices, we remain cautious European stocks but the tone has improved recently and fresh highs in 2019 remain strong possibility.
EuroStoxx Chart
Overnight Market Matters Wrap
· Investors welcomed the recent meet between US and China Presidents, Trump and Xi over the weekend at the G20 summit, helping the US equity indices hit an all-time high overnight.
· Stocks however gave back its early gains as the focus shifted to their local data, overnight it was weak manufacturing and declining May construction spending.
· Most metals on the LME fell with nickel the worst performer, down ~2.8%. Iron ore rose on the back of supply concerns, falling inventories and strong steel prices. The ‘safe haven’ gold fell after the thaw in US-China trade relations.
· This afternoon at 2.30pm, the RBA meets for their interest rate decision, with the majority of the surveyed economists expecting a rate cut towards 1%, if a rate cut is announced, this will be the first in 7 years since the RBA has cut its rate for the second time, consecutively.
· The September SPI Futures is indicating the ASX 200 to open 25 points higher towards the 6675 level this morning.
Have a great day!
James & the Market Matters Team
Disclosure
Market Matters may hold stocks mentioned in this report. Subscribers can view a full list of holdings on the website by clicking here. Positions are updated each Friday, or after the session when positions are traded.
Disclaimer
All figures contained from sources believed to be accurate. Market Matters does not make any representation of warranty as to the accuracy of the figures and disclaims any liability resulting from any inaccuracy. Prices as at 02/07/2019
Reports and other documents published on this website and email (‘Reports’) are authored by Market Matters and the reports represent the views of Market Matters. The MarketMatters Report is based on technical analysis of companies, commodities and the market in general. Technical analysis focuses on interpreting charts and other data to determine what the market sentiment about a particular financial product is, or will be. Unlike fundamental analysis, it does not involve a detailed review of the company’s financial position.
The Reports contain general, as opposed to personal, advice. That means they are prepared for multiple distributions without consideration of your investment objectives, financial situation and needs (‘Personal Circumstances’). Accordingly, any advice given is not a recommendation that a particular course of action is suitable for you and the advice is therefore not to be acted on as investment advice. You must assess whether or not any advice is appropriate for your Personal Circumstances before making any investment decisions. You can either make this assessment yourself, or if you require a personal recommendation, you can seek the assistance of a financial advisor. Market Matters or its author(s) accepts no responsibility for any losses or damages resulting from decisions made from or because of information within this publication. Investing and trading in financial products are always risky, so you should do your own research before buying or selling a financial product.
The Reports are published by Market Matters in good faith based on the facts known to it at the time of their preparation and do not purport to contain all relevant information with respect to the financial products to which they relate. Although the Reports are based on information obtained from sources believed to be reliable, Market Matters does not make any representation or warranty that they are accurate, complete or up to date and Market Matters accepts no obligation to correct or update the information or opinions in the Reports. Market Matters may publish content sourced from external content providers.
If you rely on a Report, you do so at your own risk. Past performance is not an indication of future performance. Any projections are estimates only and may not be realised in the future. Except to the extent that liability under any law cannot be excluded, Market Matters disclaims liability for all loss or damage arising as a result of any opinion, advice, recommendation, representation or information expressly or impliedly published in or in relation to this report not withstanding any error or omission including negligence.