MM feels it’s time to change tack with Gold investing (CIM, ASL, GDX AU)
The ASX200 felt like it was hit hard yesterday but by 4pm we were only down -0.4%, outperforming both the US and Asia in the process. The backbone of our markets was again the banks with the “Big Four” showing no real interest in falling too far while the gold stocks remained strong as most of the big names again made multi-year highs. On the downside the Financials / Energy sectors were heavy while the iron ore names struggled – we continue to look to buy a correction in these names starting with Fortescue ~$8, this would equate to a 15% correction from this month’s high for this volatile beast.
Following on from yesterday’s pm report we will again look at CIMIC (CIM) later in today’s report but there were 2 key takeout’s for MM from the previously named Leighton Holdings 19% plunge:
1 - Another miss / downgrade by an ASX200 company leading to a savage reaction with the stock hitting a 2-year low. We again question how much bad news can the local market absorb before it makes a meaningful dent in the 25% rally from its December low i.e. will we see a classic straw that breaks the camel’s back situation?
2 – Whether we were bullish or bearish at today’s market level / valuation a large cash position feels on the money moving into reporting season as volatility continues to rise “under the hood”, this time of year is renowned for presenting opportunities for the nimble and prepared.
The market has pulled back 2.1% over the last 3-weeks - the move has been characterised by a distinct lack of conviction, it feels more like a market taking a breather as opposed to one commencing a major correction. Interestingly 2 of the 3 stocks we looked at yesterday to support this short-term bullish view Commonwealth Bank (CBA) and NIB Holdings (NHF) both basically closed unchanged and they still look destined to make fresh 2019 highs in the weeks / months ahead.
MM remains comfortable to adopt a more conservative stance over the next 6-months.
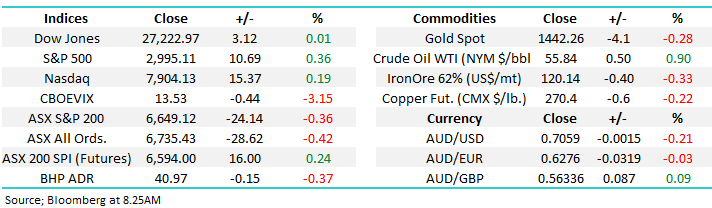
Overnight US stocks were firm with the S&P500 rallying +0.4% as their reporting season unfolds with IBM a strong winner gaining 4.6%. Investors remain optimistic interest rates are headed lower with bond yields falling along with $US. Gold surged $US25 whereas crude oil struggled, usually we would expect these to move up in tandem when the greenback retreats.
Today we are going to revisit gold and show how MM feels is the best way to gain exposure to the in vogue precious metal.
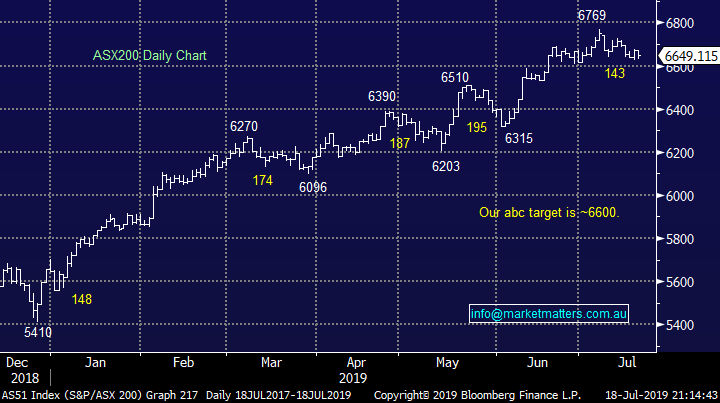
ASX200 Chart
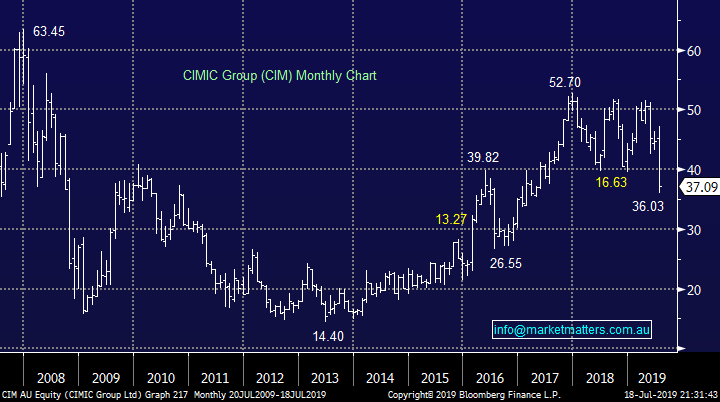
Yesterday CIMIC (CIM) shares tumbled to 2-year low following a soft first half result leaving the company needing a large second half skew to meet its reiterated guidance of $790m-$840m. We covered the update in the PM Report yesterday – CLICK HERE
One happy camper on the day would probably have been Hong Kong-based research group GMT who claimed only in May this year that CIMIC had been "dressing up" its financial statements since it was acquired by Spanish construction group ACS in 2014. At the time GMT argued the stock is worth just $23 per share, claiming in a report that CIMIC's accounting shared many of the features of Carillon, the British construction group that collapsed in January last year. This very bearish report by GMT is likely to be dusted off by a few fund managers in the coming days and its definitely a major contribution to why MM is unlikely to press the buy button in the short-term.
At yesterday’s close the stock is now yielding 4.2% fully franked which is not irrelevant in today’s environment.
MM is neutral / CIM at current levels.
CIMIC Group (CIM) Chart
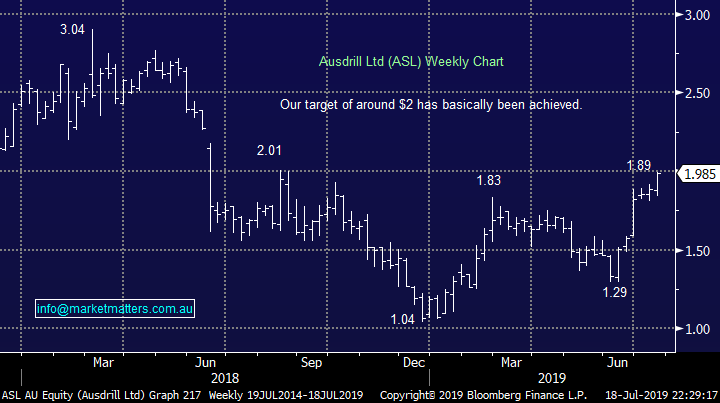
On bright spot was CIM’s mining division which saw profits rise more than 25% - a positive read through for our current holding is Ausdrill (ASL) which rallied by 3.12% to close just shy of our +$2 target. When I started writing this report I was tempted to switch ASL straight over to CIM but the GMT report + some feedback from a knowledgeable client in the sector, we’ll sit this one out for now.
No change, MM is looking to take a 30% profit on our ASL position above $2.
Ausdrill (ASL) Chart
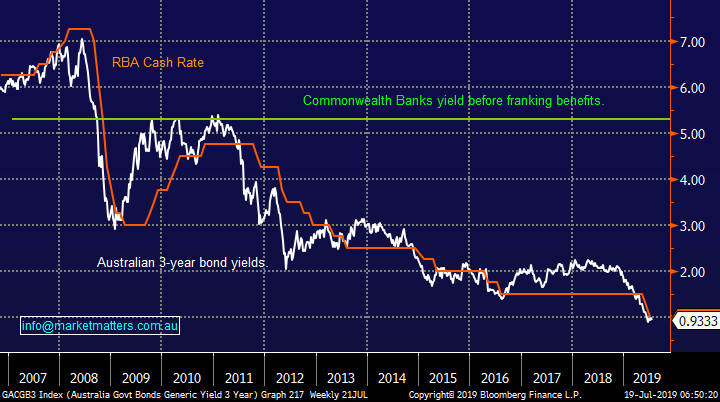
For virtually all of 2019, MM has remained long the ASX200 while numerous people kept telling me the markets expensive but with interest rates at never seen before levels equities continue to offer solid relative value assuming a major economic downturn can be avoided e.g. the chart below shows CBA yielding over 5x bond yields / the RBA cash rate, even before we consider franking.
Over the last few weeks, we have started skewing our portfolio’s to a more conservative stance with more than one eye on sustainable yield. Our cash levels are now elevated and a few of our existing positions like Ausdrill (ASL) are approaching our target areas but this doesn’t mean we intend to sit on cash for months to come.
Long-term cash has been proven to be a shocking investment but after a great first half as “active investors” we are comfortable with the flexibility that cash affords moving into reporting season.
CBA & interest rate comparisons Chart
MM’s favourite way to play the rally in gold - KISS
I’m currently reading a book from the famous investor Ray Dalio called Principles – a good book and I intend to buy a copy for each member of the team. Overnight I also read an interesting article in the AFR written about Dalio’s thoughts on investing in the years ahead, he feels gold may be the key, especially when we see a reflation environment combined with more than a few economic headaches that will need controlling.
"I believe that it would be both risk-reducing and return-enhancing to consider adding gold to one's portfolio," – Ray Dalio, Bridgewater & Associates.
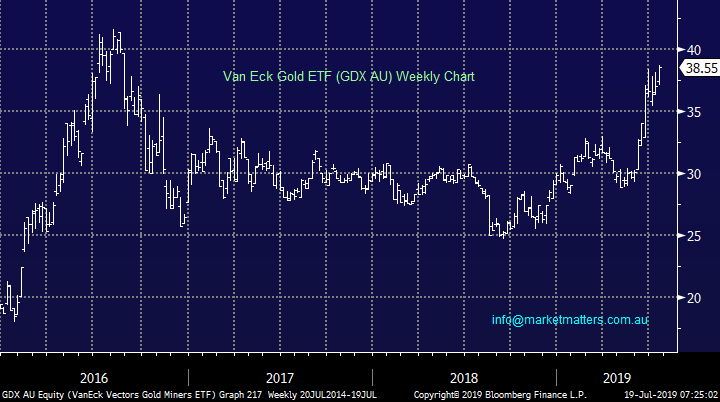
We agree with the famous US investor on this one and MM has been bullish gold throughout 2019, arguably my favourite position across our 4 MM Portfolios is the Van Eck GDX ETF which resides in our new ETF Portfolio: https://www.marketmatters.com.au/new-global-portfolio/
If we are correct this ETF is very bullish, initially targeting at least 20% upside while importantly not being meaningfully exposed to any resurgence in the $A. The ETF tracks the NYSE (New York Stock Exchange) Arca Gold Miners Index hence gaining exposure to gold miners across the globe with the largest weighting to those in north America, principally Canada.
GDX ETF description https://www.vaneck.com.au/funds/gdx/snapshot/
MM remains very bullish the GDX ETF initially targeting ~20% upside.
Market Vectors (GDX) Chart
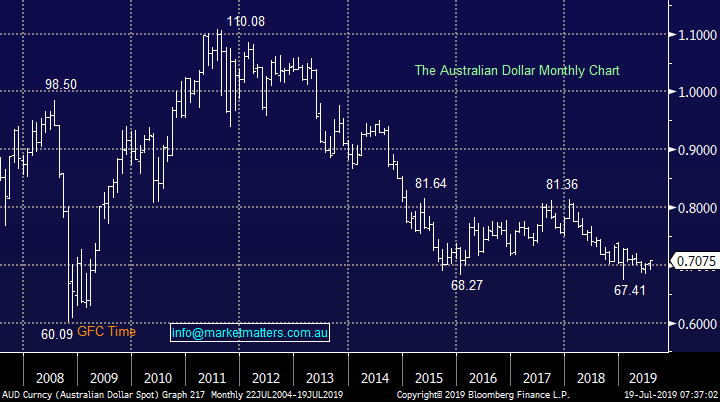
At MM one of our core macro views is that the “little Aussie battler” either has, or is looking for, a major low with the next meaningful move a rally towards 80c i.e. a contrarian view that we are also positioned for in our ETF portfolio.
We feel this FX view has a very important impact on how Australians should consider investing in the rising gold price as we move towards 2020.
Australian Dollar ($A) Chart
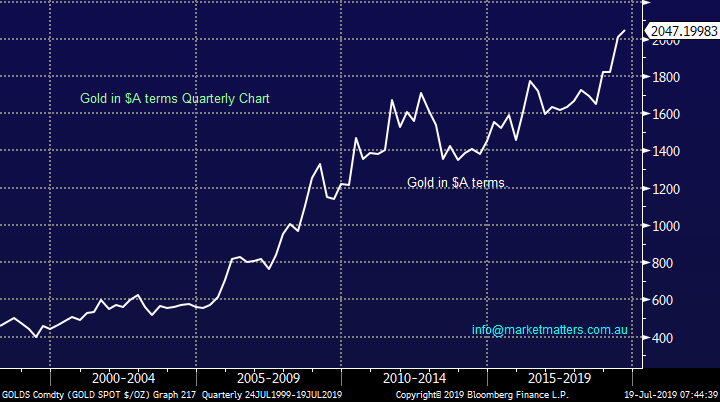
The combination of a rampaging gold price over the last 15-years and a $A which has fallen ~30% over the last 8-years has seen the gold price surge in $A terms which has been a huge win for the Australian gold miners who are effectively $US earners i.e. they benefit from a weak $A.
However our opinion is this period of massive outperformance by the domestic gold producers has probably topped out and we prefer gaining an exposure to international gold producers at today’s prices.
Hence MM currently prefers buying the GDX as opposed to adding to our Newcrest (NCM) position, or chasing other in favour local stocks like Regis Resources (RRL) and Northern Star (NST).
Gold in $A terms Chart
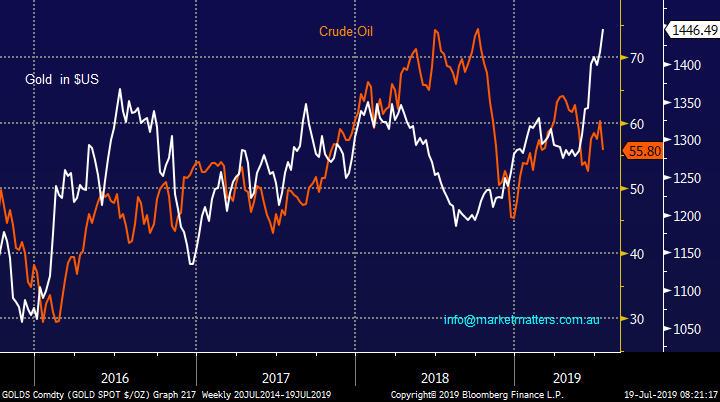
Crude Oil is not enjoying a drifting $US
Overnight we saw gold rally 1.6% making fresh 6-year highs while crude oil fell making a new one month low on demand concerns, in other words the $US effect is being overridden by economic concerns.
This is a common theme of 2019, economic concerns are driving bond yields lower and markets are reacting accordingly but equities are not pricing in any risk of a recession, they currently have faith with central banks.
Gold & Crude Oil Chart
Conclusion (s)
MM is considering switching our ASL position to the GDX Australian ETF for our Growth Portfolio.
*Watch for alerts.
Global Indices
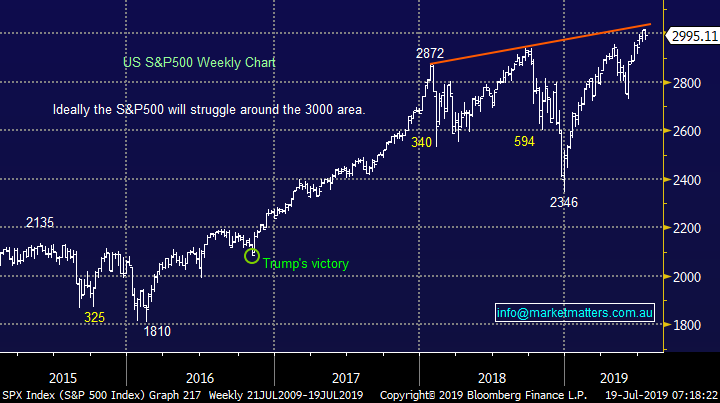
US stocks look extremely vulnerable to us at this stage although we need to see a break back below 2950 by the S&P500 to become seriously concerned with the markets health i.e. just around 1.5% lower.
We reiterate that while US stocks have reached our target area they have not yet generated any technical sell signals.
US S&P500 Index Chart
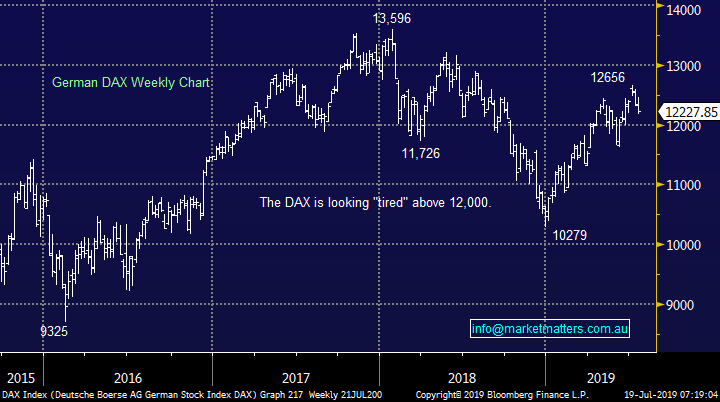
No change again with European indices, we remain cautious European stocks and their tone has become more bearish over the last few weeks.
German DAX Chart
Overnight Market Matters Wrap
· The US equity markets recovered all of its session’s losses overnight following the Federal Reserve Bank of New York President John Williams’s speech highlighting the need for swift action should policy makers conclude the economy is in trouble.
· Consumer and financial stocks led gains in the S&P 500 Index, while Treasury 10-year yields dropped. A positive outlook from Apple Inc. supplier’s Taiwan Semiconductor Manufacturing Co.’s lifted chipmakers. The NYSE ‘FANG’ Index slid on Netflix Inc.’s surprise loss of U.S. customers. In after-hours trading however, Microsoft Corp. rallied after sales topped estimates.
· A report that Iran made a “substantial” offer on its nuclear program in return for fewer sanctions gave a lift to equities that was later tempered by news that the U.S. shot down an Iranian drone. Iron ore was up 1.1% to $119.90, Gold was up 1.65%, and Crude Oil continued to slide, off nearly 2%
· The September SPI Futures is indicating the ASX 200 to open 15 points higher, testing the 6665 level this morning.
Have a great day!
James & the Market Matters Team
Disclosure
Market Matters may hold stocks mentioned in this report. Subscribers can view a full list of holdings on the website by clicking here. Positions are updated each Friday, or after the session when positions are traded.
Disclaimer
All figures contained from sources believed to be accurate. Market Matters does not make any representation of warranty as to the accuracy of the figures and disclaims any liability resulting from any inaccuracy. Prices as at 19/07/2019
Reports and other documents published on this website and email (‘Reports’) are authored by Market Matters and the reports represent the views of Market Matters. The MarketMatters Report is based on technical analysis of companies, commodities and the market in general. Technical analysis focuses on interpreting charts and other data to determine what the market sentiment about a particular financial product is, or will be. Unlike fundamental analysis, it does not involve a detailed review of the company’s financial position.
The Reports contain general, as opposed to personal, advice. That means they are prepared for multiple distributions without consideration of your investment objectives, financial situation and needs (‘Personal Circumstances’). Accordingly, any advice given is not a recommendation that a particular course of action is suitable for you and the advice is therefore not to be acted on as investment advice. You must assess whether or not any advice is appropriate for your Personal Circumstances before making any investment decisions. You can either make this assessment yourself, or if you require a personal recommendation, you can seek the assistance of a financial advisor. Market Matters or its author(s) accepts no responsibility for any losses or damages resulting from decisions made from or because of information within this publication. Investing and trading in financial products are always risky, so you should do your own research before buying or selling a financial product.
The Reports are published by Market Matters in good faith based on the facts known to it at the time of their preparation and do not purport to contain all relevant information with respect to the financial products to which they relate. Although the Reports are based on information obtained from sources believed to be reliable, Market Matters does not make any representation or warranty that they are accurate, complete or up to date and Market Matters accepts no obligation to correct or update the information or opinions in the Reports. Market Matters may publish content sourced from external content providers.
If you rely on a Report, you do so at your own risk. Past performance is not an indication of future performance. Any projections are estimates only and may not be realised in the future. Except to the extent that liability under any law cannot be excluded, Market Matters disclaims liability for all loss or damage arising as a result of any opinion, advice, recommendation, representation or information expressly or impliedly published in or in relation to this report not withstanding any error or omission including negligence.


