Subscribers questions (GDX AU, RED, ABC, THC, WHC, NFLX US, IBM US)
Over the weekend the news was light on the ground although we did see Sydney auction clearance rates hit a 2-year high with confidence continuing to return to the Australian residential property market. Friday night saw a rough day on Wall Street with the S&P500 falling -0.6% as the Fed sent out signals that their next rate cut would only be 0.25%, as opposed to the keenly sought 0.5% i.e. on Thursday the market was pricing in a greater than 70% chance of a 0.5% cut whereas by Fridays close the optimism had fallen to almost 20%. A great example of how quickly interpretations can change around central banks policies / intentions, with equity markets soaring on the hope of yet lower interest rates the obvious risk exists that the RBA and Fed might adopt a wait and see approach faster than many anticipated – remember stocks are currently all about interest rates.
After going aggressively long equities into the market panic sell-off last December MM has been advocating a more conservative stance over recent weeks, paying special attention to avoiding the risks in the high valuation growth sector which have been pushed ever higher by the momentum traders / investors – a dangerous game of musical chairs in our opinion, potentially similar to that witnessed in Q4 of 2018 when the ASX200 Software & Services index was smacked 20% in quick fashion. Last night I read an article on Bloomberg which summed up our concerns perfectly, a shortened version tells the tale:
“There’s an old saying that Fund Managers never get fired buying IBM, but the crowd like / momentum following mentality has blown out to scary levels, stocks which have rallied with the greatest momentum over the last 12-months are trading on valuations close to 25% above the norm.”
This reiterates why we are now generally avoiding both the high flying valuation stocks and the commonly favoured “yield plays” as we feel these respective elastic bands have stretched too far making the risk / reward no longer attractive. Hence at MM we remain in “sell / defensive mode” for our Growth Portfolio as we continue to consider a few stock “switches” that should make the portfolio more defensive in nature.
We reiterate no sell signals have been generated but our “Gut Feel” remains the next 5% swing is more likely down than up. However investors should not forget the relative value supporting equities into weakness with term deposits paying below 2% compared to the ASX200 yielding over double this rate of return, often fully franked - unless of course we are indeed headed for a recession in which case its likely to be all bets are off time.
Thanks as always for the questions which were a touch down on the usual volume with school holidays wrapping up this weekend. The kids back to school tomorrow!!
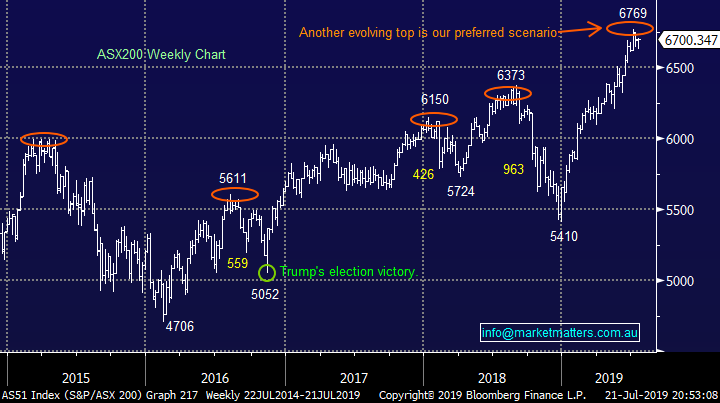
ASX200 Index Chart
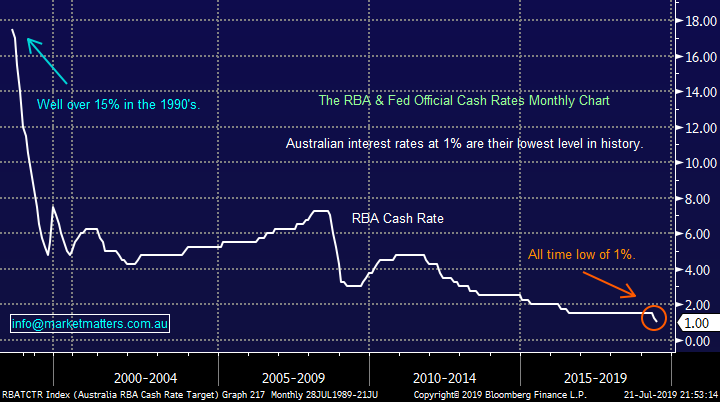
The chart below illustrates the RBA Cash Rate over the last 30-years, not a long time from a historical perspective but wow how things have changed for interest rates, they’ve tumbled from 16% to 1% with more cuts actually anticipated in 2019/2020. I ask myself almost daily, what’s next, sure we can have bond yields below zero but in the larger scheme of things I, unlike the market, question how can central banks avoid the next economic downturn. The obvious answer is fiscal stimulus, or QE (quantitative easing), as the government for example ramps up infrastructure spending or cuts taxes – I feel we are starting this part of the cycle in earnest right now.
Hence we believe any stocks / sectors that benefit from such government actions should outperform over the next few years, perhaps taking the baton from the interest rate plays who theoretically cannot get it much better.
However we must remember equities in general remain cheap while interest rates remain at these all-time lows.
RBA Cash Rate Chart
Question 1
“Dear James, I notice you are interested in Gold stocks but are waiting for a pullback which may or may not come at this juncture but from a higher level when market is in FOMO on gold and Gold stocks. I am very heavily invested in Gold stocks and I will like to point out that Aurelia minerals AMI and Decian Gold DCN have either not participated and have corrected heavily. Can you comment on these two stocks? Other stocks to watch out will be GOR gold road, RSG Resolute mining, and WGX which are performing well along with SAR and EVN and other high flyers like NST,RRL,NCM. I will also like your opinion on two low cost speculative plays doing well lately namely RED5 and ERM in which EVN has a stake.” - Girish
Morning Girish,
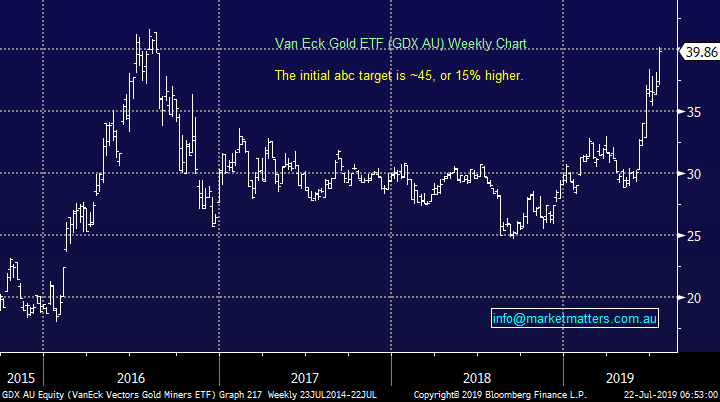
We are certainly keen on gold and currently have 10% of the Growth Portfolio exposed to the precious metal via Newcrest (NCM) and the VanEck Gold ETF (GDX AU), this is a significant overweight position compared to the sectors ~2% index weighting. Our second exposure via the ETF was implemented for 2 simple reasons:
1 – Our macro-economic view is the next 10% move for the $A is up, a contrarian opinion which if correct means the huge outperformance by the Australian gold miners compared to the rest of the world is likely to be coming to an end, hence we like this ETF as its more Canadian focused.
2 – We are approaching reporting season where individual stock volatility becomes extremely elevated, hence we are more comfortable with a second allocation to the sector as opposed to being more stock specific.
MM remains bullish the gold sector at today’s prices.
VanEck Gold Miners ETF (GDX AU) Chart
You have asked about a number of stocks in your question including Aurelia Metals (AMI), Dacian Gold (DCN), RED 5 and REM. A quick summary of our technical thoughts on these 4 relatively small cap stocks is as follows:
1 – Aurelia Metals (AMI) - we see no reason to catch this falling knife when other members of the sector look so strong.
2 – Dacian Gold (DCN) – a stock which tumbles almost 90% in a bull market is a concern, it may be showing value around 50c but too hard for us.
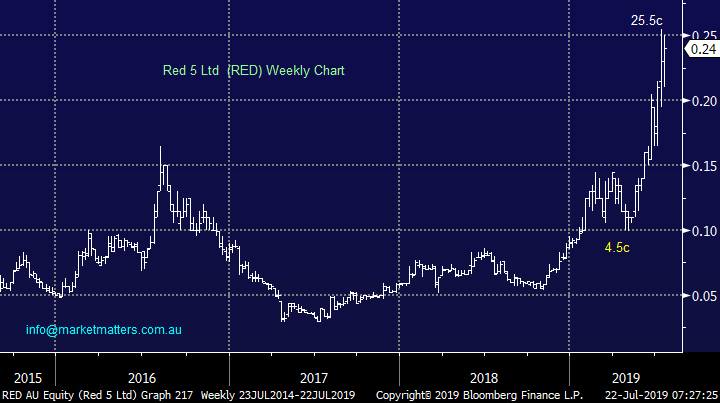
3 – Red 5 ltd (RED) - This $300m business is showing signs of life and looks a good technical buy around 22c but stops need to be below 14c – a large almost 40% risk.
4 – Emmerson Resources (ERM) – This $53m business is showing signs of life and looks a good very aggressive buy around 11-12c but stops need to be below 8c – a huge 50% risk.
Red 5 Ltd (RED) Chart
Question 2
“Hi James, for years, I’ve been calling for the government to re-issue Infrastructure Bonds as they did in the past. We don’t need an ATO opinion or guideline as the provision has been legislated years ago. Super funds, including SMSFs, are sitting on Billions in cash which would love to fund infrastructure. After all, it a very low cost exercise for the government. Perhaps they are waiting for even lower interest rates before they pull the trigger. I think a problem highlighted in the past is the likes of Macquarie soaked up as many of the bonds they could and then repackaged them into a highly geared packet of $500k lots. Highly negatively geared and highly profitable to both the bank and High Net Worth investors – if you could get your hands on them!” – Cheers Peter M.
Hi Peter,
I understand you’re frustration but considering our thoughts on likely fiscal stimulus in the years ahead there may well be more opportunities on the horizon. At MM we are considering a couple of stocks who are exposed to such government spending including the 3 below:
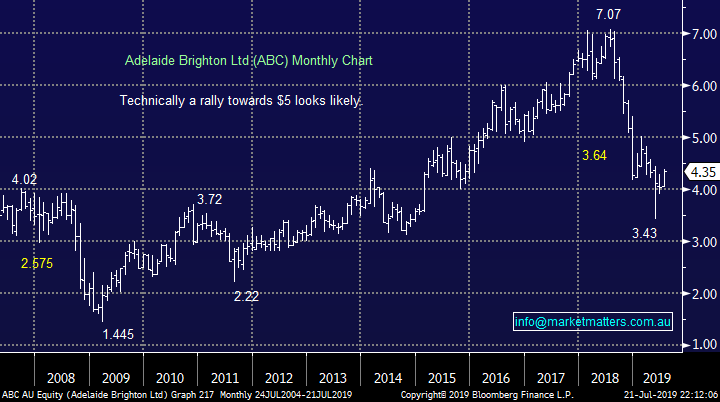
1 – Adelaide Brighton (ABC) $4.35 – Australia’s largest cement maker would be well placed to benefit from an even greater ramp up in infrastructure spend. We like ABC at current prices.
2 – Boral (BLD) $5.57 – This building products heavyweight has endured a tough few years with the stock tumbling over 45% from its 2018 high, another disappointing result leading to a spike down towards $4 and MM will probably go long assuming the news is not structural.
3 – Brickworks (BKW) $17.19 – A significant part of the BKW business is building products which should enjoy a government throwing around the cash, our initial target of $18 is now not too exciting unless we see pullback by the stock.
Adelaide Brighton Ltd (ABC) Chart
Question 3
“Afternoon James, I’ve noticed over the last week THC has risen about 15 cents. I know you are going to cover the cannabis sector one day soon but was wondering what your thoughts are about this company and the risk/reward etc? I look forward to hearing your thoughts.” - Many thanks, Ryan F.
Hi Ryan,
As I said, this sector is interesting however I need to spend some more time looking at it before commenting more comprehensively – it’ not an area that I have a lot of insight in at this stage.
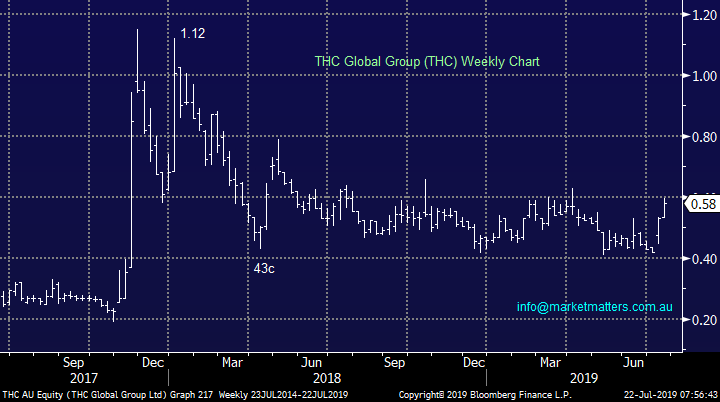
From a technical standpoint, THC has enjoyed a decent rally over the last few weeks but it remains around 50% below its Christmas high illustrating the dangers lurking in this sector.
The stock has recently surged above 50c after announcing its subsidiary has been granted a manufacturing licence from the Australian Office of Drug Control, a likely major step in the companies evolution from growers to drug producers. Technically aggressive players can buy THC around current levels with stops below 50c, ok risk reward in this volatile beast.
MM likes THC technically with stops below 50c.
THC Global Group (THC) Chart
Question 4
“Gday guys..... What are your thoughts on Whitehaven Coal? Is their dividend sustainable? I guess they would suffer in a downturn, but given the current valuation, do you see any “insurance” against a global sell-off ?” - Rob B.
Hi Rob,
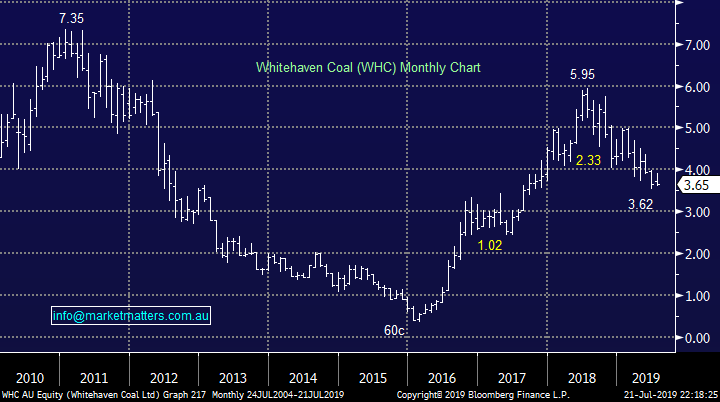
The market is still anticipating WHC will maintain its dividend yield at ~6% with the company expecting to trade ex a 14cps dividend in early August which is clearly attractive and why we hold the stock in the MM Income Portfolio. The big dividends in WHC are more a function of higher free cash flow due to reduced capital expenditure, however weakening Coal prices have offset the benefit of this to some degree.
Earlier this month Whitehaven Coal (WHC) released its June quarter production numbers which we liked as did the market on the day pushing up the stock 5% but since then the stock has continued to drift lower following Coal prices, always a concern. We like WHC as an income play but we would need to see a decent turn in Coal prices before considering as a growth play.
MM still likes WHC as an income play.
Whitehaven Coal (WHC) Chart
Question 5
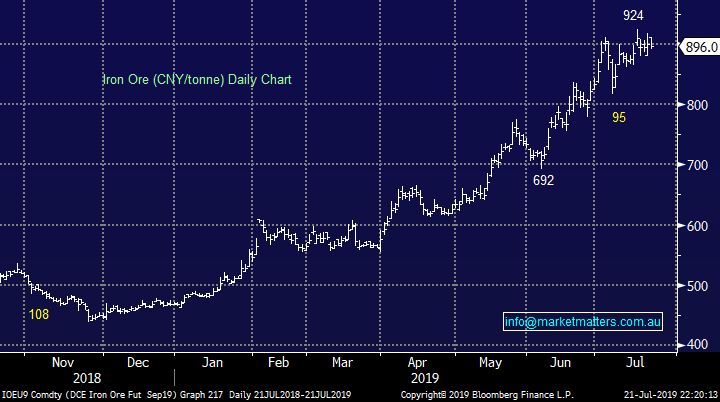
“Hi James, thanks for providing valuable insights on how the market works, and how big players invest. Is there a reliable website which provide live iron ore price? Gold, Crude price is easy to find on CNBC, Bloomberg.” - Regards Sanjay Sarode.
Hi Sanjay,
Iron Ore is unfortunately a tricky one, the feed used to be free but now we have to pay for it on our Bloomberg terminal – unfortunately not many things are free these days!
You can see iron ore charts on the trading economics website but I’m not sure how often they are updated: https://tradingeconomics.com/commodity/iron-ore
Iron Ore (CNY/tonne) Chart
Question 6
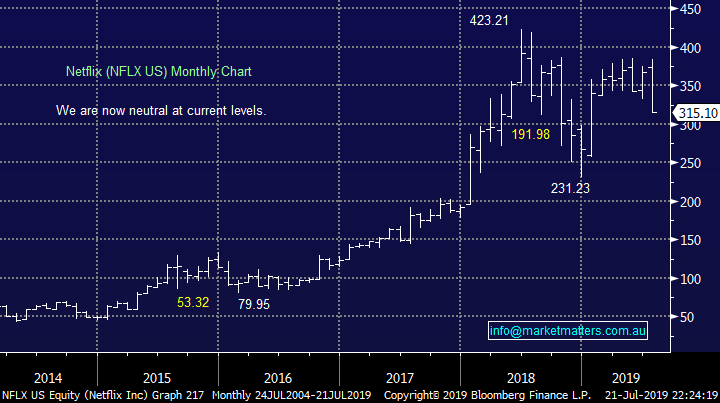
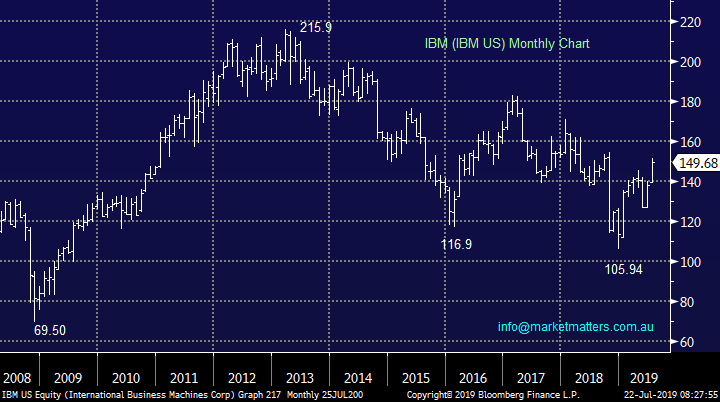
“James, you indirectly answered my question of last week on Netflix by saying you are considering selling and possibly switching into IBM. I would not recommend IBM after working for 10 years in their software business. Despite all the acquisitions they’ve made their revenue growth is negligible and most large deals are a consequence of license reviews. Earnings have only grown through cutting staff numbers dramatically and other expense reduction initiatives, that lemon has been squeezed dry. Their services business is less than world class, invariably any business won usually turned out to lose money (certainly true in Australia). Watson is a breakthrough product but it has a long sales cycle. They were unable to parlay the Softlayer Cloud acquisition into a competitor to AWS and were very late into cloud licensing for software. Lots of other problems around execution and bringing the different parts of the company together successfully. Their household name status was true years ago but highly questionable now. I think Microsoft is a better company to buy, I bought in February after deciding to reduce my original Adobe holding (bought 7 years ago this month for $31, now $307). I also bought Nividia at the same time on the basis that the US/China trade dispute would settle but that doesn’t look to be so certain. That’s the holding I was contemplating to switch to Netflix, I’m now looking at alternatives.” – Regards David H.
Morning David,
I think we are on the same page with NFLX, a disappointing result especially for a stock on a high multiple / valuation.
At this stage of the market cycle as you know we are looking for stocks on a low Beta, or in layman’s terms a stock that doesn’t hug the index closely. IBM certainly ticks that box, the stocks currently trading on an Est. P/E for 2019 of 10.8x while yielding over 4.3%, both very attractive numbers for the US market.
While we acknowledge IBM has some challenging internal issues its these that provide the value in our opinion, we still like the risk / reward of buying below $US150 with stops below $US140, less than 7% risk compared to our target ~20% higher – remember the higher the US market rallies and the bull market matures, the tougher it becomes to find “cheap” stocks.
MM is bullish IBM with stops under $US140.
Netflix (NFLX US) Chart
International Business Machines (IBM US) Chart
Overnight Market Matters Wrap
· The US gave some of its gains last Friday as investors digested a report that the Fed Reserve plans to cut interest rates by only 0.25% at the end of the month.
· The USD gained against its peers following the report, while tensions in the Middle East helped Crude Oil rally following reports that the Iranian Revolutionary Guard had seized a British oil tanker.
· BHP is expected to outperform the broader market after ending its US session up an equivalent of 0.79% from Australia’s previous close.
· The September SPI Futures is indicating the ASX 200 to open 14 points lower, testing the 6685 level this morning.
Have a great day!
James & Market Matters Team
Disclosure
Market Matters may hold stocks mentioned in this report. Subscribers can view a full list of holdings on the website by clicking here. Positions are updated each Friday, or after the session when positions are traded.
Disclaimer
All figures contained from sources believed to be accurate. Market Matters does not make any representation of warranty as to the accuracy of the figures and disclaims any liability resulting from any inaccuracy. Prices as at 22/07/2019
Reports and other documents published on this website and email (‘Reports’) are authored by Market Matters and the reports represent the views of Market Matters. The MarketMatters Report is based on technical analysis of companies, commodities and the market in general. Technical analysis focuses on interpreting charts and other data to determine what the market sentiment about a particular financial product is, or will be. Unlike fundamental analysis, it does not involve a detailed review of the company’s financial position.
The Reports contain general, as opposed to personal, advice. That means they are prepared for multiple distributions without consideration of your investment objectives, financial situation and needs (‘Personal Circumstances’). Accordingly, any advice given is not a recommendation that a particular course of action is suitable for you and the advice is therefore not to be acted on as investment advice. You must assess whether or not any advice is appropriate for your Personal Circumstances before making any investment decisions. You can either make this assessment yourself, or if you require a personal recommendation, you can seek the assistance of a financial advisor. Market Matters or its author(s) accepts no responsibility for any losses or damages resulting from decisions made from or because of information within this publication. Investing and trading in financial products are always risky, so you should do your own research before buying or selling a financial product.
The Reports are published by Market Matters in good faith based on the facts known to it at the time of their preparation and do not purport to contain all relevant information with respect to the financial products to which they relate. Although the Reports are based on information obtained from sources believed to be reliable, Market Matters does not make any representation or warranty that they are accurate, complete or up to date and Market Matters accepts no obligation to correct or update the information or opinions in the Reports. Market Matters may publish content sourced from external content providers.
If you rely on a Report, you do so at your own risk. Past performance is not an indication of future performance. Any projections are estimates only and may not be realised in the future. Except to the extent that liability under any law cannot be excluded, Market Matters disclaims liability for all loss or damage arising as a result of any opinion, advice, recommendation, representation or information expressly or impliedly published in or in relation to this report not withstanding any error or omission including negligence.


