How to play the “Cyclical v Defensive” elastic band (BHP, TCL, JBH, GMA)
The ASX200 encountered some fairly aggressive selling early on Wednesday morning only to recover throughout the afternoon to finish down just 20-points / 0.3%, overall a solid performance regaining more than 50% of the intra-day’s losses. The selling was fairly broad-based with losers dominating winners by 2:1 while on the sector front we saw some buying coming into the cyclical space at the expense of the defensives, a potential major market switch / unwind we touched on yesterday and will explore deeper today.
Cyclical stocks – companies that are highly correlated to economic activity i.e. they should struggle in a recession. Classic stocks in this group are those impacted by discretionary spending e.g. automobiles, clothing, consumer services, media and retailing.
Defensive stocks – companies that are relatively insulated to an economic downturn e.g. people must eat/drink, keep warm until they eventually die, making stocks with this sort of earnings exposure relatively insulated from a recession e.g. Healthcare, Utilities and Telcos.
MM has been very concerned by the average Australians debt levels but I’m always wary of being onboard a crowded trade and there’s not many pundits / economists considering anything but a recession in 2020, what if they are all wrong! We saw in Q4 of 2018 what can happen when the markets all positioned in the same direction and the music stops playing. As somebody who watches the market extremely closely it’s hard not be concerned by investors insatiable, but understandable, search for yield. Nobody appears to be considering how much central banks may be prepared to stimulate their economies to avoid a recession, eventually it will probably lead to inflation and higher interest rates at some point.
Yesterday we again saw local economic data come in better than many feared, not good but not a disaster. Australian GDP slid to its lowest in 10-years but the RBA Cash rate is at an all-time low of 1% today compared to 3% at its lowest point in 2009, there may be many moving parts when we measure economic strength but it feels like on most matrices we are fully pricing in a deep recession…….what if BREXIT and the US–China trade issues were to be sorted overnight, it feels to us like most fund managers are positioned without great consideration to this outcome – remain open-minded, you never know!
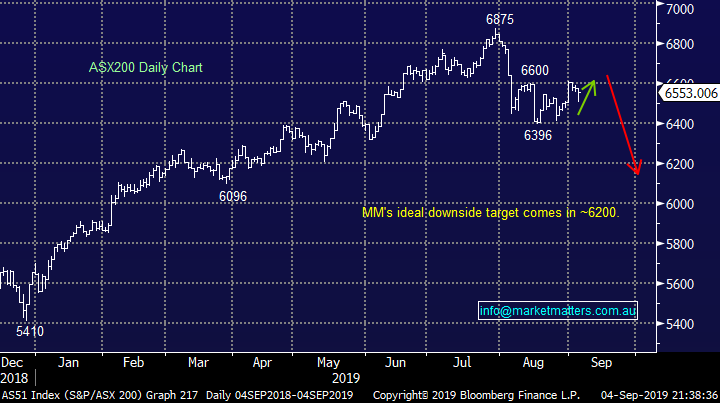
Short-term MM remains comfortable adopting a conservative stance towards equities, especially around the 6600 area.
Overnight US stocks held onto the positive lead from their futures in our time zone with the S&P500 gaining just over 1% with strength in all sectors except healthcare which actually fell overnight – a defensive sector. The SPI futures are pointing to an open up around 20-points locally led by the resources.
Today MM is going delve deeper into the cyclical or defensive debate as our concerns around the crowded “yield trade” increases – remember markets look 6 - 12 months in advance.
ASX200 Chart
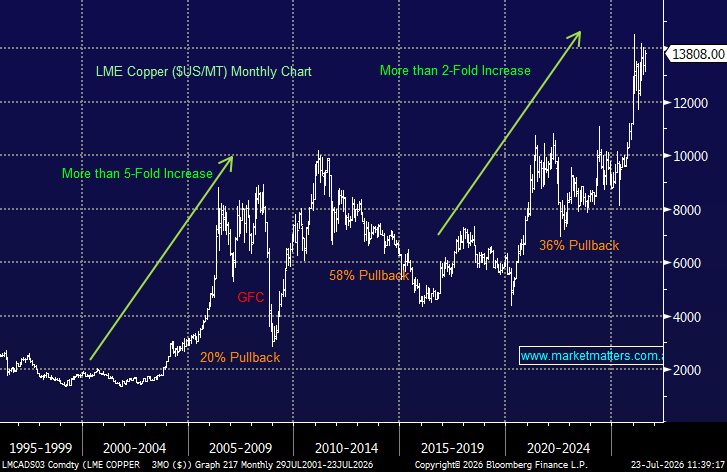
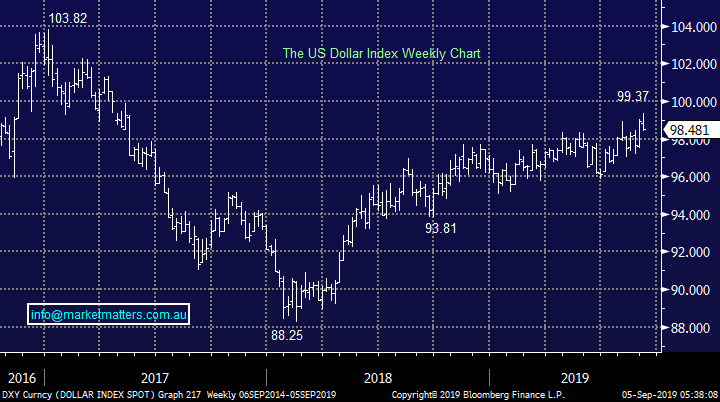
Overnight the $US pulled back over 0.5% leading to a sharp rally by commodities which are priced in the currency e.g. copper +2.5% and Crude oil +4.3%. MM believes the $US index is not far away from a ~5% correction which is highly likely to ignite an already firm resources sector e.g. this morning BHP is set to open up well over 2%.
When markets look for a top its usually a far more drawn out process than a low as the bulls fight to hold onto the trend, in other words there is usually a few false dawns. If we are correct and equities are due another decent leg lower the likelihood is scarred investors will run to the perceived safety of the $US, such a rally in our opinion will be the time to fade the move and increase MM’s $A exposure in our ETF Portfolio.
MM believes the $US is “looking for a top”.
The $US Dollar Index Chart
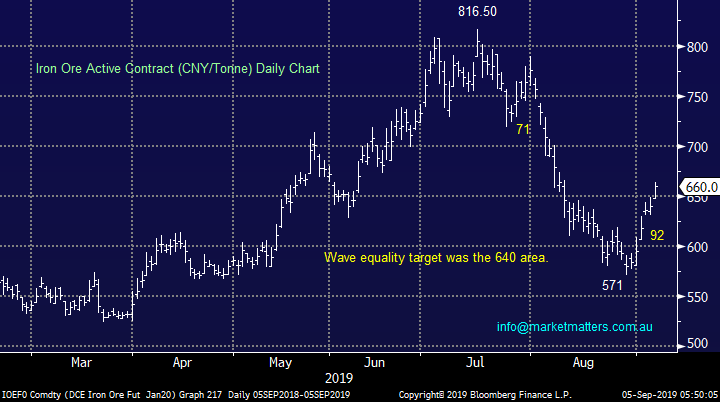
Iron ore has rapidly bounced over 16% as China has delivered far stronger economic data than many anticipated – their non-democratic leadership structure allows them to press the stimulus button in a far more aggressive and timely manner than most.
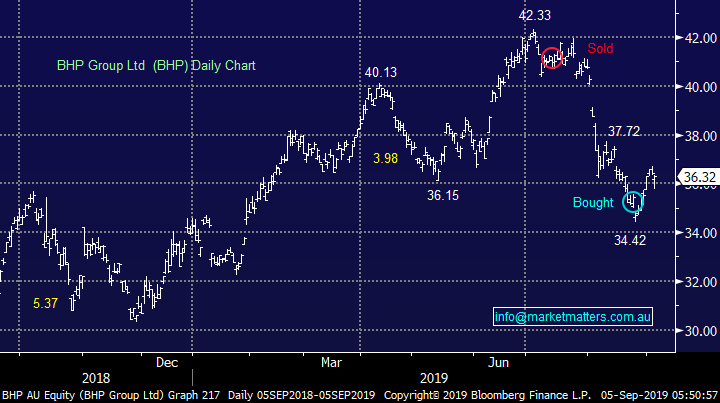
BHP is set to open up ~80c this morning basis the ADR’s close in the US but the stock trades ex-dividend 78c fully franked this morning hence an unchanged opening is anticipated i.e. it should hold its dividend. BHP should be a beneficiary if we are correct and the $US is close to an inflection point.
MM believes BHP will outperform over the next 3-6 months.
Iron Ore Active Contract (CNY/Tonne) Chart
BHP Group (BHP) Chart
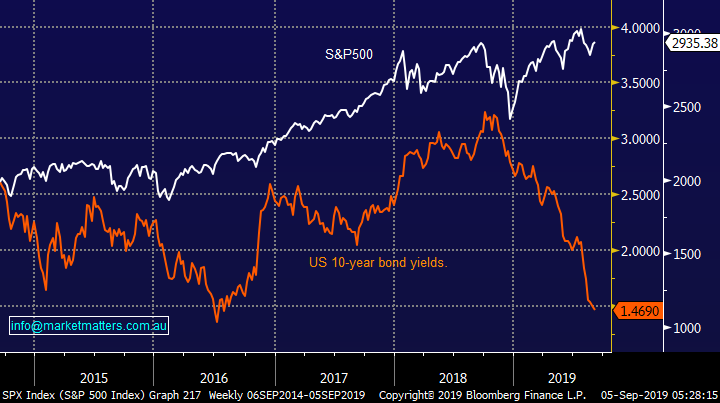
Historically US 10-year bond yields have led equities but so far the latest plunge by the US 10-year bond yield has been totally ignored by the S&P500, if anything its been touted as a reason that equities have remained buoyant. There have been 5 major tops over the last 30-years with bond yields leading the decline by an average of 8.5 months, bond yields have been falling this time for 9-months telling us at MM to not underestimate the possibility that stocks can endure a decent correction.
Our initial target for a pullback by US stocks is ~6% lower.
US S&P500 v 10-year bond yields Chart
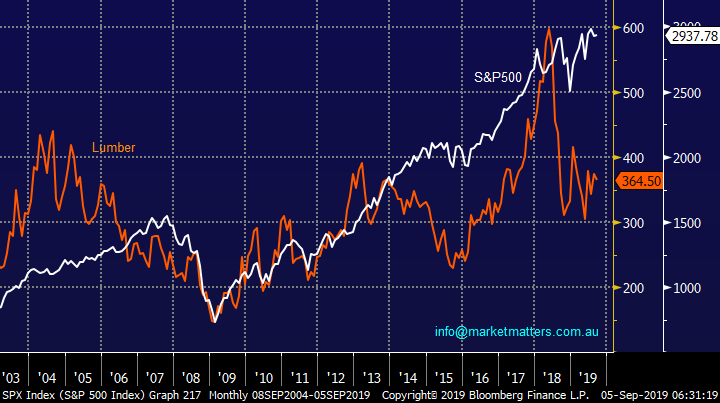
Lumber is another leading indicator used by many market players for obvious reasons i.e. the lumber price dictates economic activity. Lumber topped out around 3-years before the GFC and it was hammered in early 2018, another warning for stocks but as we saw between 2004 & 2007 equities can keep rallying when things look worrying around them, especially when interest rates are this low.
US S&P500 v Lumber Chart
Is it time to ditch defensives for cyclicals?
Since early 2018 we have seen the defensive stocks enjoy a strong bid tone as bond yields headed lower, conversely many cyclical names have struggled over the same period as concerns over a global recession increased – this makes total sense. The question is when will investors start rotating from the arguably overbought defensives into cyclicals – a move that would probably see large volatility under the hood as opposed to on the index level.
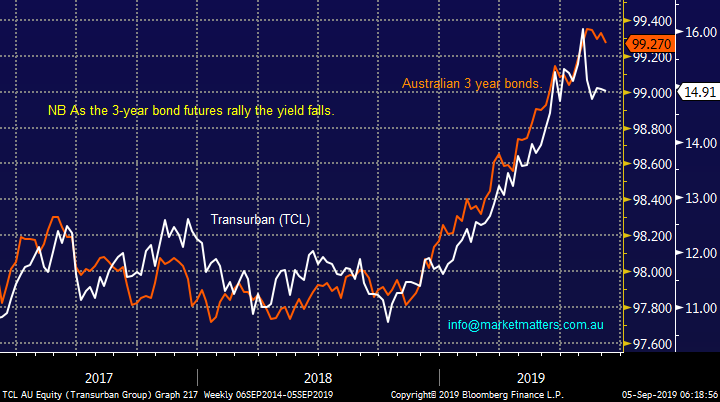
The chart below shows how defensive / yield-play favourite Transurban (TCL) has been dancing the tango with Australian 3-year bonds until recent weeks (although a capital raise has been an influence here). If / when the market decides that interest rates have bottomed, not necessarily going up, a snap back in such stocks is expected, just imagine if investors simply take a small % of their position off the table – a major risk when everybody is positioned the same way.
Recent economic data and RBA comments makes us feel that positioning for more than 1 additional rate cut is potentially too optimistic.
Australian 3-year bond yield v Transurban (TCL) Chart
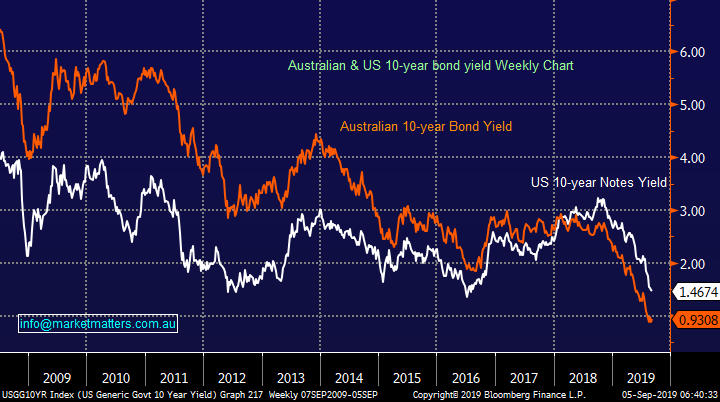
Both the US and Australian 10-year bond yields have been falling aggressively over the last 12-months but the trend remains well and truly intact. Our view is bonds will soon stabilise which is not a reason to walk away from high yielding defensives but as “the market” feels positioned aggressively for lower rates a short term “hissy fit” would not surprise e.g. a bit like we saw in Q4 of 2018 when the growth stocks were unceremoniously thrown into the naughty corner as the crowd ran for the exits, led by the momentum traders.
MM believes this a very dangerous time to buy the “owned” defensive stocks.
US & Australian 10-year bond yield Chart
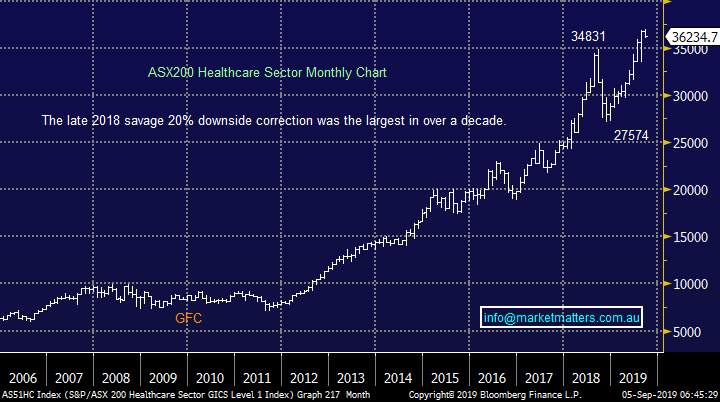
I am especially concerned for the defensive stocks who don’t provide a sustainable yield like the healthcare sector – not just because they fell last night! There are some great companies within this sector but at MM we’re concerned they have become the go to / safe option for many fund managers who have become understandably very risk averse – all stocks have a fair value, however good they are.
Technically we can see a retest of the 2018 Q4 lows by the sector, hardly a blip on the decade long bull market but still a 20% correction.
MM is neutral / bearish the Healthcare sector short-term.
ASX200 Healthcare Sector Chart
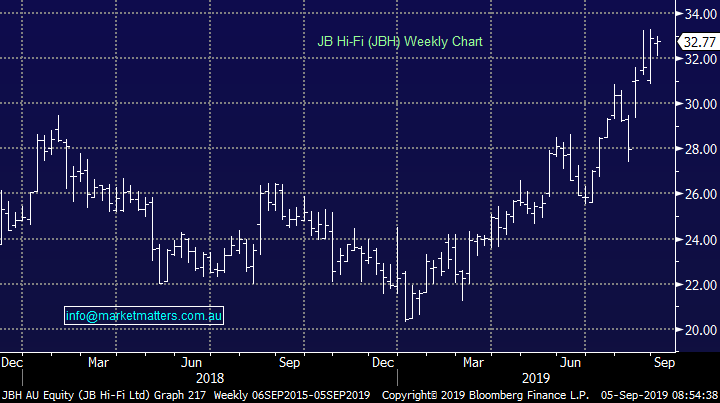
As for cyclicals, do we buy them if /when we see stocks have another decent sell-off, the answer is a mixed one. Some traditional parts of the cyclical cohort have already bounced strongly, retailers are a case in point here with the likes of JB Hi-Fi (JBH) defying its position as the markets 13th most short sold stock to rally ~12% over the past month and trade at all-time highs.
JB Hi-Fi (JBH) Chart
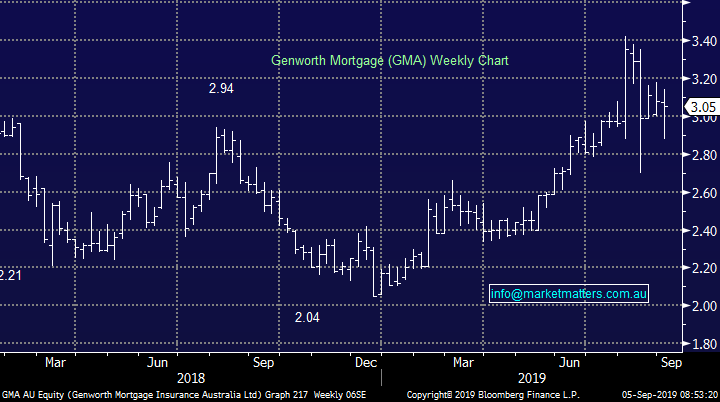
Stocks exposed to the construction cycle are considered cyclical businesses’, many of which are trading at very depressed levels, Adelaide Brighton (ABC), Boral (BLD) and Bluescope Steel (BSL) are examples here despite the current infrastructure boom however others in the sector have done well, like Bingo (BIN) which has doubled since bottoming out in February. Australia’s largest car yard, AP Eagers (APE) is a cyclical business that has just traded to new highs contrary to the doom and gloom about new vehicle sales and the indebtedness of the Australian consumer, while mortgage insurer Genworth (GMA) has rallied more than 20% over the past year despite concerns about a property crash.
Genworth (GMA) Chart
Obviously we are cashed up planning what to buy if we see a correction in September / October, and having a bias towards defensives or cyclicals does shape our thinking on the sectors / stocks to target, however we should always remember that we own stocks, and picking the right stocks at the right time remains the key. Ultimately, we’ll wait and see what value presents itself across the various stocks / sectors, similar to how we reacted in late 2018 – the key message being, remain open minded.
If we see another 5% down leg in stocks MM will be open-minded what stocks to buy.
Conclusion (s)
MM sees no reason to switch aggressively from defensives to cyclicals but 3 things are dominating our thoughts:
1 – If we see another sharp leg lower by equities, a distinct possibility in our opinion, the defensive – cyclical elastic band will probably stretch too far making a short-term switch appealing.
2 – The defensives feel a very crowded trade which could be sold aggressively if the momentum players exit stage left and fund managers decide that’s as good as it gets for interest rates.
3 – Overall equities remain an “Active Investors” playground as stocks and sectors go in / out of vogue far more often than we’ve seen throughout history – this trend will only increase in our view.
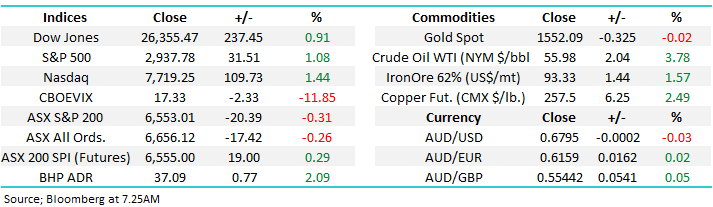
Global Indices
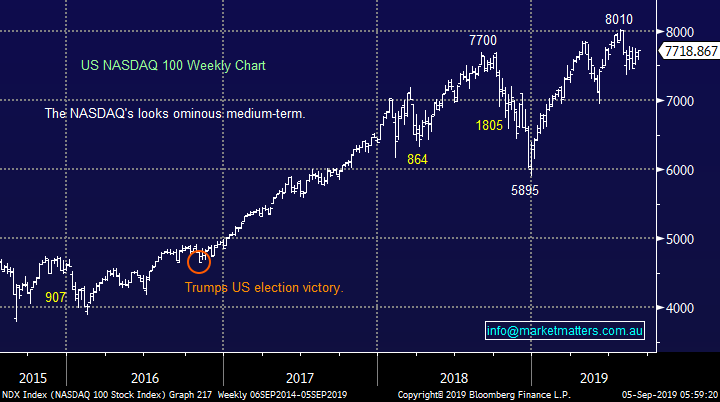
No change, we believe US stocks are now bearish as discussed over recent weeks, the tech based NASDAQ’s short-term resistance comes in around 7800, only 1% higher, while initial support is around 9% lower.
US stocks have generated technical sell signals medium-term.
US NASDAQ Index Chart
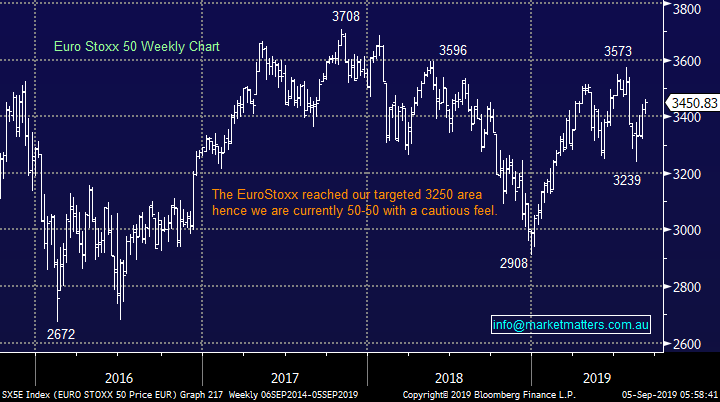
No change again with European indices, while we remain cautious European stocks as their tone has become more bearish over the last few months, however we had been targeting a correction of at least 5% for the broad European indices, this has now been achieved.
The long-term trend is up hence any “short squeezes” might be harder and longer than many anticipate.
Euro Stoxx 50 Chart
Overnight Market Matters Wrap
· Global equity markets gained as risk seemed to ease following political tensions in Hong Kong and the UK subsided as well as global growth looking stronger than first thought.
· In the Asian region, Hong Kong equities yesterday gained the most this year following leader Carie Lam, formally withdrawing the legislation to allow extraditions to China.
· The materials sector is expected to outperform the broader market today, with BHP ending its US session up an equivalent of 2.09% from Australia’s previous close.
· The September SPI Futures is indicating the ASX 200 to open 10 points higher towards the 6565 level this morning.
Have a great day!
James & the Market Matters Team
Disclosure
Market Matters may hold stocks mentioned in this report. Subscribers can view a full list of holdings on the website by clicking here. Positions are updated each Friday, or after the session when positions are traded.
Disclaimer
All figures contained from sources believed to be accurate. All prices stated are based on the last close price at the time of writing unless otherwise noted. Market Matters does not make any representation of warranty as to the accuracy of the figures or prices and disclaims any liability resulting from any inaccuracy.
Reports and other documents published on this website and email (‘Reports’) are authored by Market Matters and the reports represent the views of Market Matters. The Market Matters Report is based on technical analysis of companies, commodities and the market in general. Technical analysis focuses on interpreting charts and other data to determine what the market sentiment about a particular financial product is, or will be. Unlike fundamental analysis, it does not involve a detailed review of the company’s financial position.
The Reports contain general, as opposed to personal, advice. That means they are prepared for multiple distributions without consideration of your investment objectives, financial situation and needs (‘Personal Circumstances’). Accordingly, any advice given is not a recommendation that a particular course of action is suitable for you and the advice is therefore not to be acted on as investment advice. You must assess whether or not any advice is appropriate for your Personal Circumstances before making any investment decisions. You can either make this assessment yourself, or if you require a personal recommendation, you can seek the assistance of a financial advisor. Market Matters or its author(s) accepts no responsibility for any losses or damages resulting from decisions made from or because of information within this publication. Investing and trading in financial products are always risky, so you should do your own research before buying or selling a financial product.
The Reports are published by Market Matters in good faith based on the facts known to it at the time of their preparation and do not purport to contain all relevant information with respect to the financial products to which they relate. Although the Reports are based on information obtained from sources believed to be reliable, Market Matters does not make any representation or warranty that they are accurate, complete or up to date and Market Matters accepts no obligation to correct or update the information or opinions in the Reports. Market Matters may publish content sourced from external content providers.
If you rely on a Report, you do so at your own risk. Past performance is not an indication of future performance. Any projections are estimates only and may not be realised in the future. Except to the extent that liability under any law cannot be excluded, Market Matters disclaims liability for all loss or damage arising as a result of any opinion, advice, recommendation, representation or information expressly or impliedly published in or in relation to this report notwithstanding any error or omission including negligence.