Can growth stocks maintain their momentum? – (GDX, WSA, APX, ALU, WTC, XRO, APT)
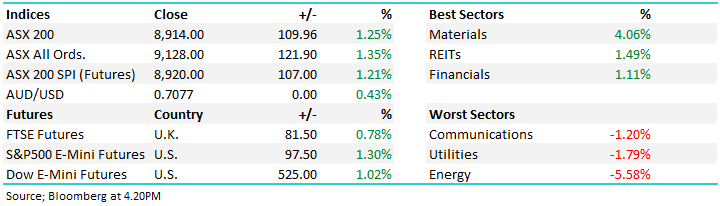
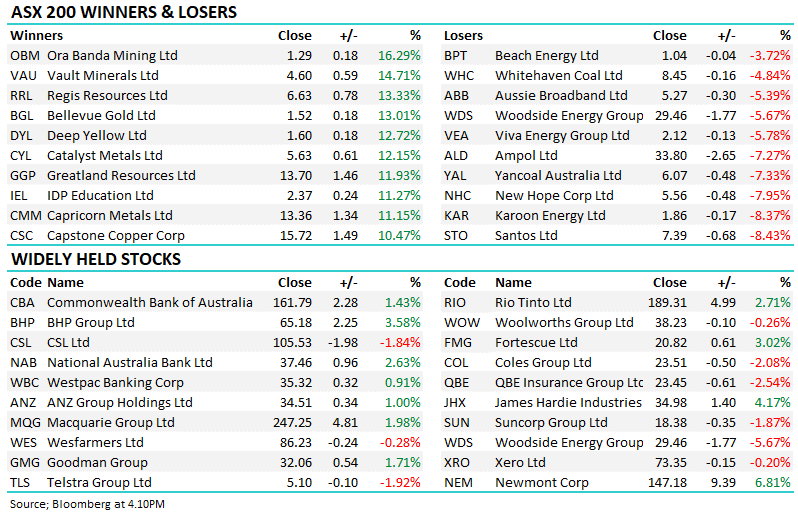
The local market meandered through an extremely lacklustre Monday to finally close up less than 1-point with a firm banking sector offsetting losses in some resource stocks, specifically the selling was focused in the gold names, a number of major names fell by a hefty 5% - decent risk / reward opportunities look to be slowly presenting themselves. Overall volumes were extremely light across the board giving no meaningful leads on stocks, sectors or the index itself.
The only thing vaguely catching our eye yesterday was a few significant market underperformers caught a bid tone including Orocobre (ORE) +5.6%, Adelaide Brighton (ABC) +5.4%, CIMIC Group (CIM) +4.7% and AMP Ltd (AMP) +2.9%. As we alluded to above when volumes are so light it’s hard to read too much into standout movers on any level but perhaps fund managers are chasing the last remnants of perceived value with their elevated cash levels – remember in the latest Bank of America Fund Manager’s Survey showed 34% of respondents expected a recession in the next 12-months implying they were cashed up waiting for lower prices before buying stocks – sounds a touch unsettlingly familiar to our short-term stance.
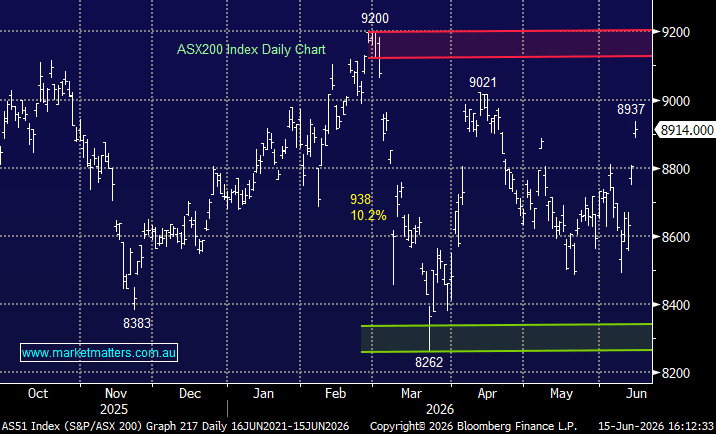
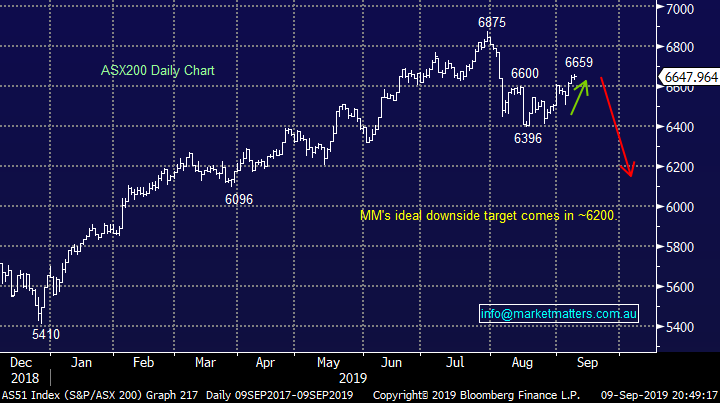
No change to our preferred scenario at MM, following the rally above the psychological 6600 area courtesy of the planned US - China trade talks in Washington next month we are now bearish from a simple risk / reward perspective. Hence as planned MM is now holding an elevated 29% cash position in the Growth Portfolio while also increasing our bearish US S&P500 ETF positions in both the International and ETF Portfolio’s.
Short-term MM remains comfortable adopting a conservative stance towards equities around this 6600 area for the ASX200.
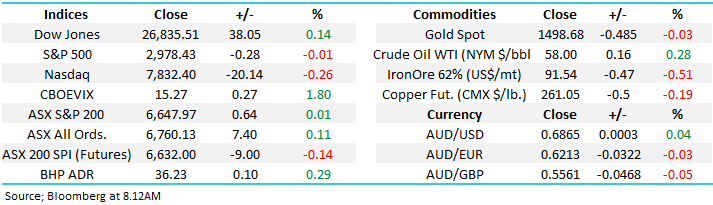
Overnight US stocks were again mixed with the Dow rallying +0.1% while the NASDAQ slipped -0.3%.
This morning MM is going to revisit the Australian growth end of town as the tech based NASDAQ starts to underperform in the US.
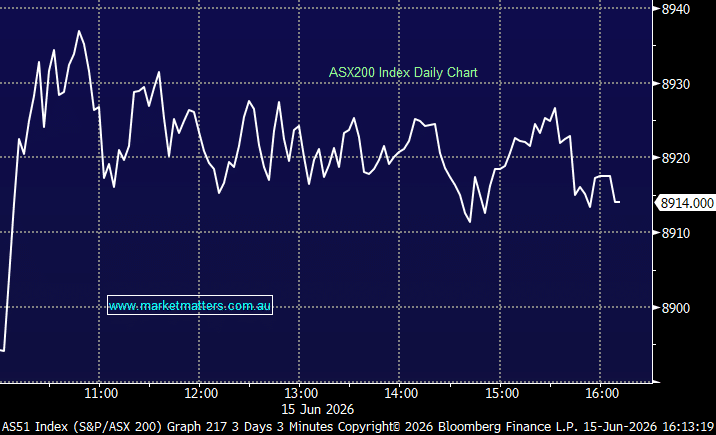
ASX200 Chart
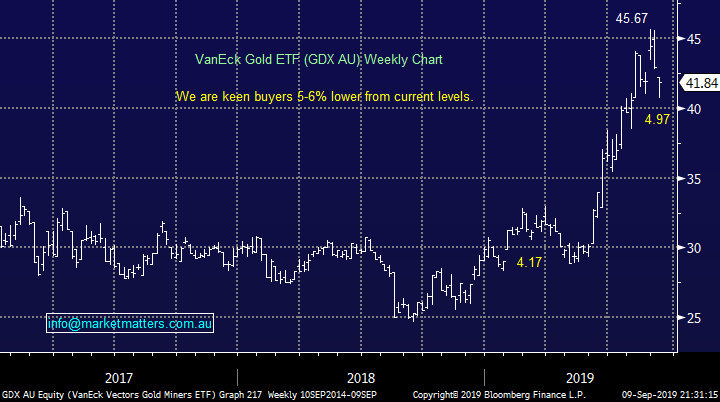
Gold has corrected almost 5% in $A terms compliments of both the bounce in the $A and minor pullback in the precious metal, hence leading to a deeper pullback in our domestic sector compared to their global peers overseas e.g. Northern Star (NST) -21%, Regis Resources (RRL) -30% and Resolute Mining (RSG) -30% - a great example of how markets can unravel when investors find themselves positioned in the same direction. The local Gold EDTF (GDX AU) has corrected a more orderly 11% with our optimum entry now ~5% lower.
MM’s favourite 2 stocks at this point in time are Evolution Mining (EVN) around $4.75 and Newcrest (NCM) under $33.50, both 4-5% lower
MM is bullish Australian gold stocks into further weakness.
VanEck Gold ETF (GDX AU) Chart
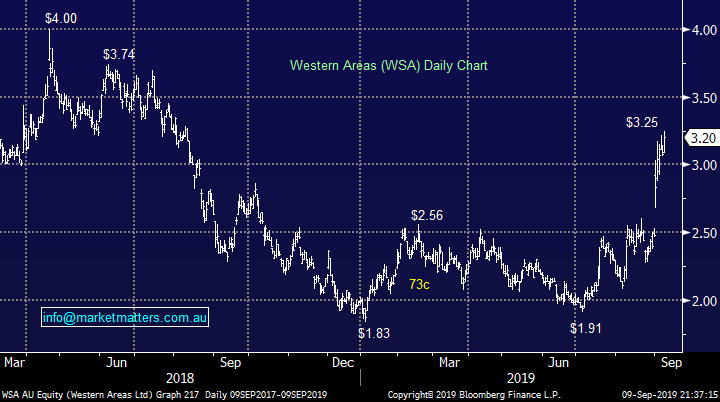
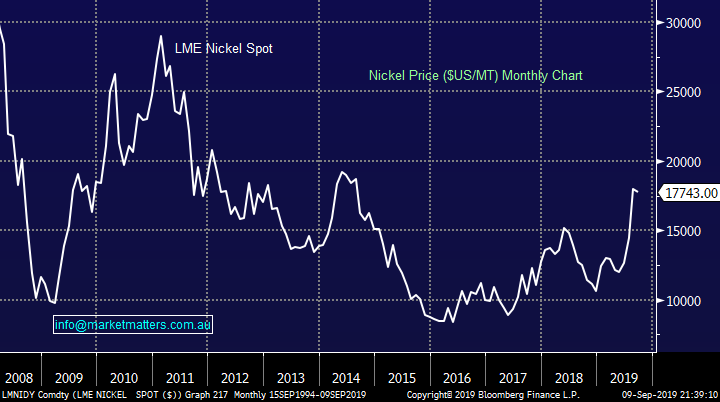
Volatile nickel producer Western Areas (WSA) has maintained its upside momentum, following the industrial metal higher. As we have witnessed recently with bulk iron ore falling 30% in under 2-months commodities can swing around in an aggressive manner. At MM we like WSA but from a risk / reward perspective the $3 area is where we are more likely to consider pressing the “buy button”.
MM currently likes WSA around $3.
Western Areas (WSA) Chart
LME Nickel Spot ($US/MT) Chart
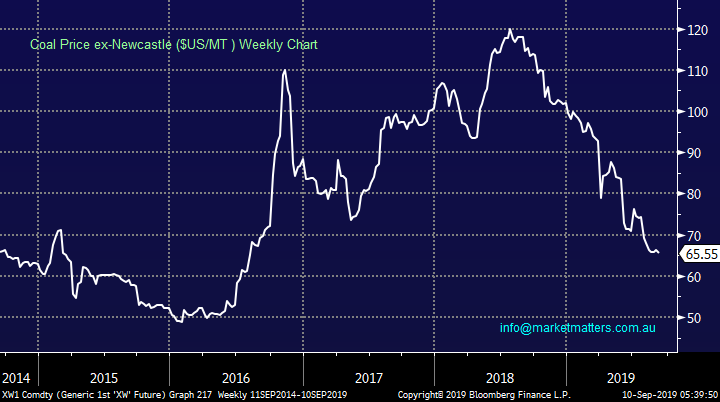
We’ve had a number of questions around coal stocks like Whitehaven (WHC) over recent months and the chart below of the coal price almost halving in the Last year illustrates why many are concerned. We feel the worst is behind us for now although no obvious catalysts have surfaced to buy the sector, except yield – hence our small WHC position in the MM Income Portfolio.
With close to 20% of coal projects appearing to be cash flow negative at current levels further downside might eventually lead to supply contraction which would eventually offer support for prices but this might all take time.
MM is neutral coal at current levels.
Coal Price ($US/MT) Chart
Can growth stocks maintain their momentum?
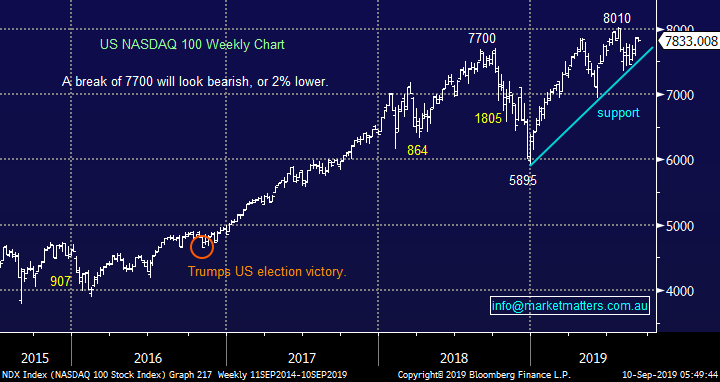
Overnight the US tech based NASDAQ fell -0.3%, not a huge decline but this index often leads in the US hence when it has 2 consecutive down days while the Dow rallies we watch for anything more sinister brewing beneath the surface. Our “Chart of the week” in the Weekend
Report was indeed the NASDAQ and if we see a break around 2% lower we get bearish sell signals generated – it’s a simple question: will investors sell into the good news on US-China trade or are we about to pop again and make fresh all-time highs.
MM is looking for a break ~2% lower to turn negative US tech / growth stocks.
US NASDAQ Chart
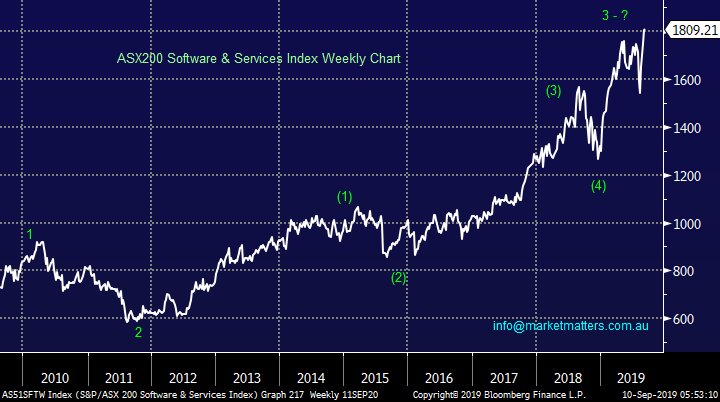
There is a strong correlation between the Australian leading growth names, which reside primarily in the Software & Services Index, and the NASDAQ. Impressively in 2019 the Australian names have outperformed their US peers, primarily in our opinion because there’s a smaller selection of candidates to buy compared to on the American market, thus driving up the valuation of the Australian names. We saw in Q4 of 2018 that when the momentum traders exit this group a 20% sharp fall can almost be a win but now well under a year later this tumultuous time has already become a distant memory.
The core of this index has even been given its own name – the WAAAX stocks which comprises of Wisetech Global (WTC), Appen (APX), Altium (ALU), Afterpay (APT) and Xero (XRO). The average gain for these 5 stocks over the last year is now over 70%, a huge increase in valuation for a group of stocks whose P/E’s are all above 50x and amazingly over 100x is actually the norm i.e. they are priced for perfection, especially in a market whose average P/E is sub 18x.
At MM when we see a group of stocks which trade with huge volatility and valuations we classify them as “Active / Trading Vehicles” hence our technicals play a huge role when / if we choose to invest i.e. risk / reward is more important than ever.
MM is currently not keen on the ASX200 Software & Services Index on a risk / reward basis.
ASX200 Software & Services Index Chart
Today I have updated our thoughts on the 5 well known WAAAX stocks in the sector with one-eye firmly on where we would consider buying the stocks for the MM Growth Portfolio – as mentioned above the emphasis is on risk / reward.
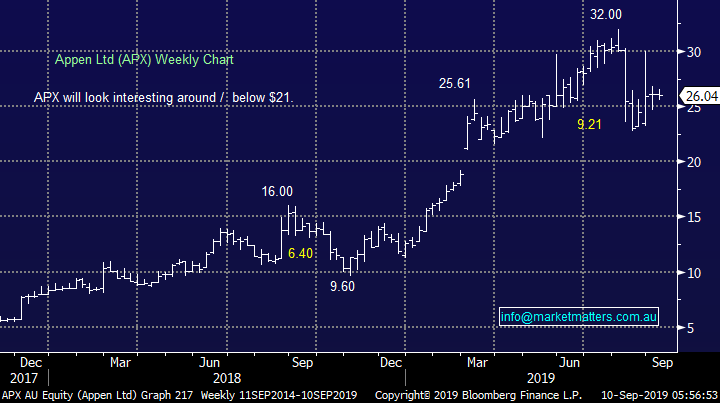
1 Appen Ltd (APX) $26.04
Artificial intelligence and machine learning business Appen (APX) has corrected over 25% from its 2019 high making it one of the poorer performers in the WAAAX stocks. The market clearly didn’t like the companies recent profit report which showed revenue growth of 60%, most companies can only dream of such growth but that’s the issue when your stock is priced for perfection.
APX is valued at over $3.1bn when its profit is below $30m, its simple maths to see there’s room for disappointment. Technically the stock will look more attractive under $21, at MM we believe it’s time to be patient and be comfortable if we miss the boat and APX again starts to rally.
MM likes APX below $21.
Appen Ltd (APX) Chart
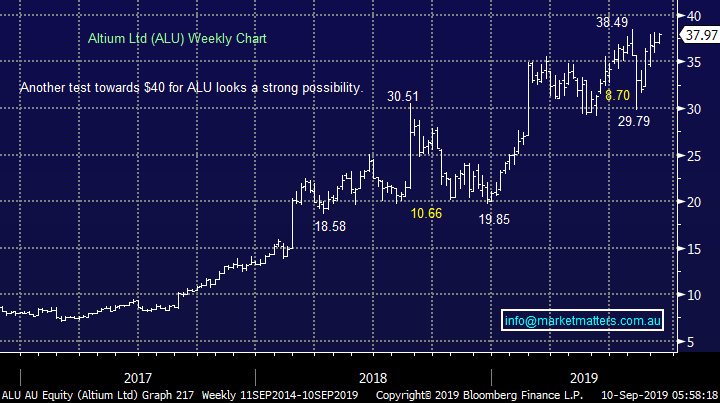
2 Altium Ltd (ALU) $37.97
Altium (ALU) is the market leader in printed circuit boards (PCB) but its shares have actually traded sideways for 6-months, consolidating strong gains earlier in the year. The company has delivered full year revenue close to $US180m, up over 22% year on year.
Technically ALU looks very capable of testing $40 in the short-term but were not interested in chasing strength preferring to consider the stock if / when it tests major $30 support.
MM likes ALU closer to $30.
Altium Ltd (ALU) Chart
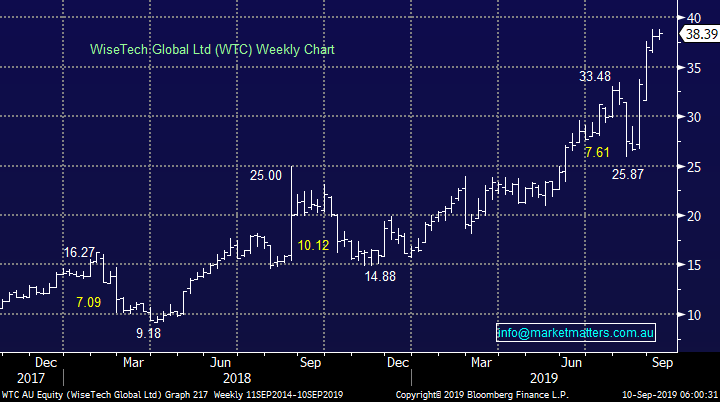
3 WiseTech Global Ltd (WTC) $38.39
WiseTech Global (WTU) is a designer / developer of cloud based a logistics software solution which continues to grow strongly and invest over 30% of its earnings into R&D. This year the company delivered revenue growth of 57%, a strong result that was reflected by the impressive share price appreciation.
Technically WTC is clearly solid while it can hold above $33 but the upside momentum appears to be slowly waning. From a risk / reward perspective we are currently only interested sub $30 but that feels very optimistic at present.
MM likes WTC closer sub $30.
WiseTech Global Ltd (WTC) Chart
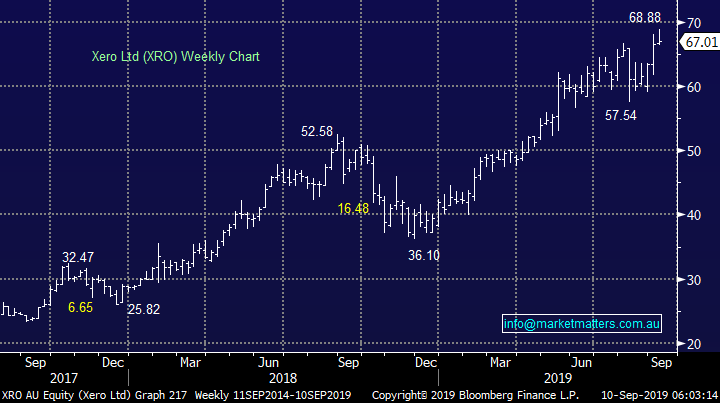
4 Xero Ltd (XRO) $67.01
On-line accounting business Xero Ltd (XRO) has enjoyed an excellent 2019 but I’m concerned it’s become a “go to” stock which investors are almost too comfortable to own. Interestingly this week XRO has started to pullback and a break below $66 will look pretty average short-term.
We like the business but believe there’s a strong possibility of being able to buy the stock sub $60, more than 10% lower.
MM likes well under $60.
Xero Ltd (XRO) Chart
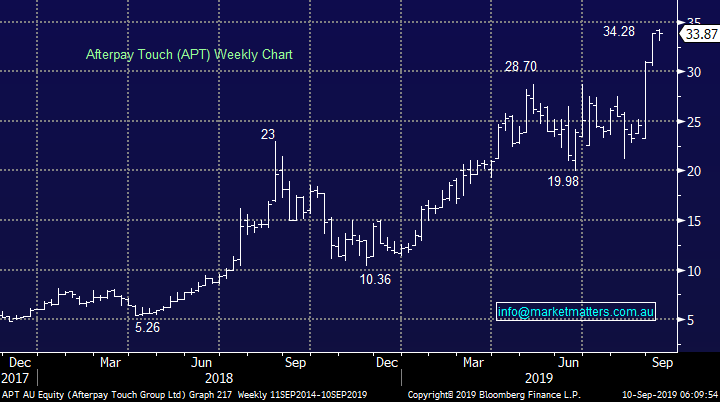
5 Afterpay Touch (APT) $33.87
The “buy now, pay later” business Afterpay (APT) has outperformed our most bullish thoughts as it continues to grow in Australia, NZ and the US. Over the last year the business delivered an impressive 86% increase in income to $264m, on sales of $5.2bn with ~30% from the US.
We find it extremely hard to buy this stock which is now valued at over $8.5bn but made a loss last year plus it’s about to experience significant increased levels of competition on a global basis – but we were wrong not buying around $20 earlier in the year!
MM now likes closer to $20.
Afterpay Touch (APT) Chart
Conclusion (s)
MM likes the WAAAX group of stocks but from a risk / reward perspective only into a decent pullback.
We are not keen to chase the extremely highly valued sector into any strength believing a correction similar to Q4 of 2018 is a strong possibility.
Global Indices
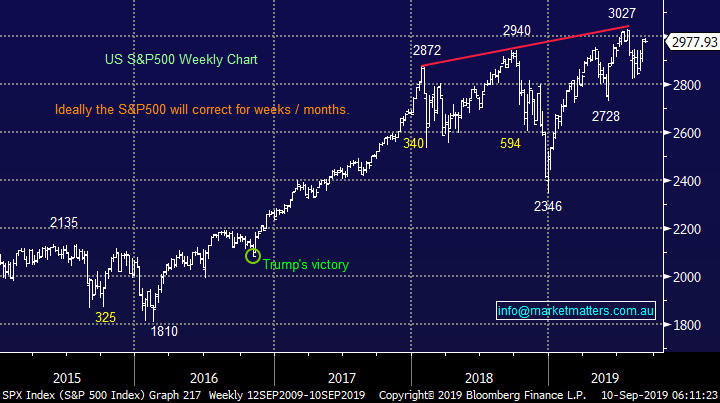
No change yet, we believe US stocks are now bearish as discussed over recent weeks however we now need to see some rejection of current levels before specific sell signals are triggered – note at the moment we still feel a break to fresh all-time highs will fail to aggressively follow through to the upside.
US stocks will generate a short-term sell signal below 2935, or 1.4% lower.
US S&P500 Index Chart
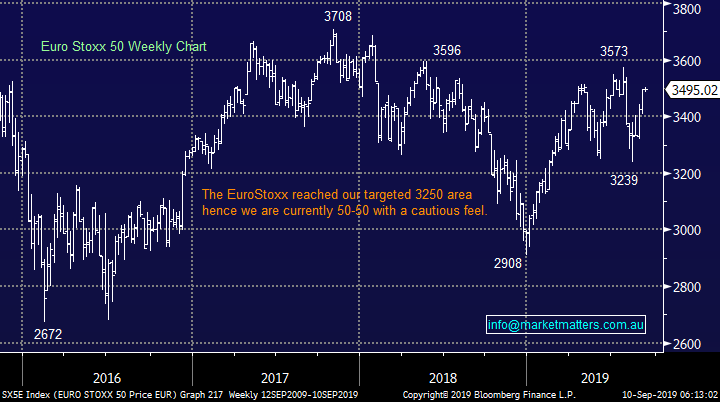
No change again with European indices, while we remain cautious European stocks as their tone has become more bearish over the last few months, however we had been targeting a correction of at least 5% for the broad European indices, this has now been achieved.
The long-term trend is up hence any “short squeezes” might be harder and longer than many anticipate, perhaps one is currently unfolding.
Euro Stoxx 50 Chart
Overnight Market Matters Wrap
• A relatively quiet session in both the US and Euro regions overnight as no change is currently seen with the current main event – US-China trade talks.
• US Bond yields closed higher following strong labour data, shifting investors back to ‘riskier’ assets, while in the Euro region, most expect the ECB to announce a stimulus package.
• BHP is expected to outperform the broader market after ending its US session up an equivalent of 0.29% from Australia’s previous close.
• The September SPI Futures is indicating the ASX 200 to open marginally lower, testing the 6640 level this morning.
Have a great day!
James & the Market Matters Team
Disclosure
Market Matters may hold stocks mentioned in this report. Subscribers can view a full list of holdings on the website by clicking here. Positions are updated each Friday, or after the session when positions are traded.
Disclaimer
All figures contained from sources believed to be accurate. All prices stated are based on the last close price at the time of writing unless otherwise noted. Market Matters does not make any representation of warranty as to the accuracy of the figures or prices and disclaims any liability resulting from any inaccuracy.
Reports and other documents published on this website and email (‘Reports’) are authored by Market Matters and the reports represent the views of Market Matters. The Market Matters Report is based on technical analysis of companies, commodities and the market in general. Technical analysis focuses on interpreting charts and other data to determine what the market sentiment about a particular financial product is, or will be. Unlike fundamental analysis, it does not involve a detailed review of the company’s financial position.
The Reports contain general, as opposed to personal, advice. That means they are prepared for multiple distributions without consideration of your investment objectives, financial situation and needs (‘Personal Circumstances’). Accordingly, any advice given is not a recommendation that a particular course of action is suitable for you and the advice is therefore not to be acted on as investment advice. You must assess whether or not any advice is appropriate for your Personal Circumstances before making any investment decisions. You can either make this assessment yourself, or if you require a personal recommendation, you can seek the assistance of a financial advisor. Market Matters or its author(s) accepts no responsibility for any losses or damages resulting from decisions made from or because of information within this publication. Investing and trading in financial products are always risky, so you should do your own research before buying or selling a financial product.
The Reports are published by Market Matters in good faith based on the facts known to it at the time of their preparation and do not purport to contain all relevant information with respect to the financial products to which they relate. Although the Reports are based on information obtained from sources believed to be reliable, Market Matters does not make any representation or warranty that they are accurate, complete or up to date and Market Matters accepts no obligation to correct or update the information or opinions in the Reports. Market Matters may publish content sourced from external content providers.
If you rely on a Report, you do so at your own risk. Past performance is not an indication of future performance. Any projections are estimates only and may not be realised in the future. Except to the extent that liability under any law cannot be excluded, Market Matters disclaims liability for all loss or damage arising as a result of any opinion, advice, recommendation, representation or information expressly or impliedly published in or in relation to this report notwithstanding any error or omission including negligence.