Markets believe there’s a 70% chance of an RBA rate cut In October, how should we invest? (CBA, TCL, SYD, BLD, BHP)
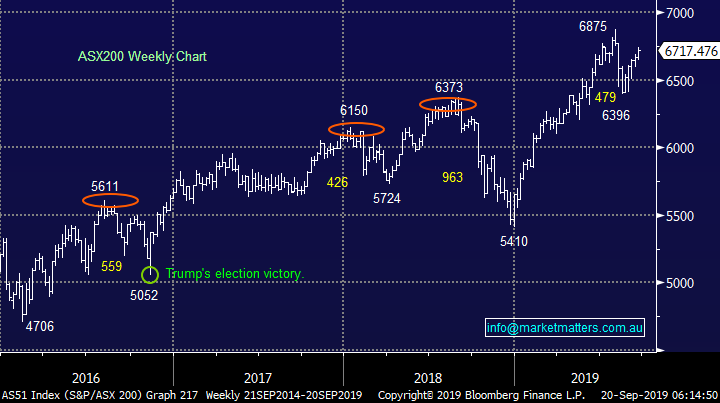
The ASX200 rallied on its September option and futures expiry yesterday morning – pretty much as expected however what was a little surprising was the poor Australian employment data. The unemployment rate in July rose unexpectedly to 5.3% with weakness in full-time employment an issue, the deterioration surprised most economists and sent the Aussie dollar tumbling back below 68c in the process. The surge in anticipation for a rate cut in a few weeks’ time helped support stocks throughout the day but the gains had already been registered before 10.30am – never ignore a potential “short squeeze” on expiry. Over recent weeks the ASX200 has continued to climb a wall of worry as investors in general have felt either short, or simply underweight stocks.
We should not underestimate the degree of negativity in many fund managers minds which in itself is a bullish influence on stock prices, at least short-term. The latest Bank of America Fund Managers Survey released this week showed the greatest belief of a pending recession since 2009. Almost 40% of those surveyed expect a US recession within 12-months hence it’s not surprising that investors find themselves underweight equities however with the US – China receiving the main blame for the health of the global economy a hasty resolution to this issue from Octobers meeting in Washington could easily lead to another leg higher in risk assets.
The US Fed cut rates from 2% to 1.75% on Tuesday morning (AEST) and now ~70% of market players believe the RBA will follow suit in October taking its rate down from 1% to 0.75%, dream stuff for mortgage holders and house prices alike. While 3 of the “Big Four” banks now expect a rate cut in October arguably the more important fact is they also expect a second cut taking the Official Cash Rate down to 0.5%, that’s half of today’s already record low 1%!
Trump was on Twitter this week following the Fed Decision – this quote stood out! "Jay Powell and the Federal Reserve Fail Again. No “guts,” no sense, no vision! A terrible communicator!" Only in America - imagine if ScoMo unleashed this sort of tirade on Philip Lowe.
Short-term MM remains comfortable adopting a more conservative stance towards equities around current market levels.
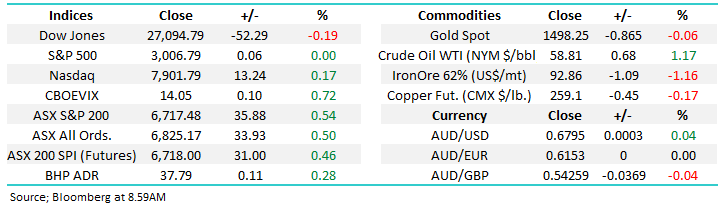
Overnight global stocks were mixed with the Dow closing down 52-points while the tech based NASDAQ bounced +0.2%. No great lead in either direction with the SPI futures calling the ASX200 to open up around 10-points.
This morning MM has looked at 5 of the ASX200’s stocks which are usually impacted by interest rate cuts, “should we sell or should we buy now?” – sorry but it is Friday!
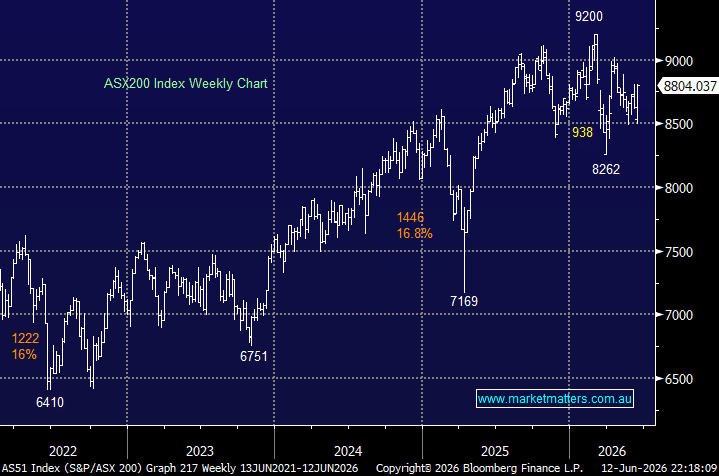
ASX200 Chart
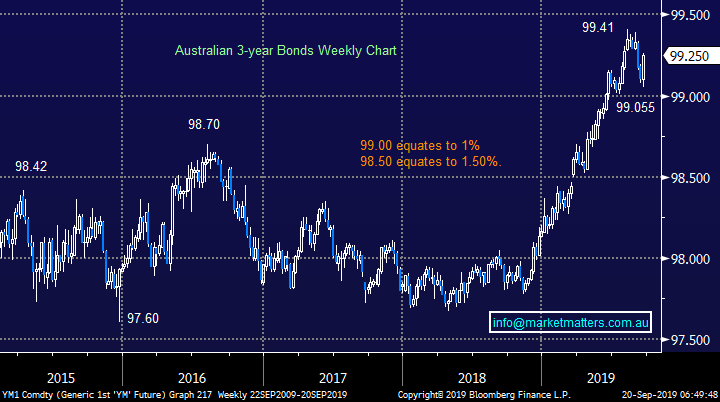
Yesterday we paid a timely visit to the Australian 3-year bond market targeting a rally to fresh highs in the weeks ahead, we saw a major part of this move unfold yesterday after the poor employment data. MM anticipates this bull market in local bonds to continue into October , sending yields lower in the process, but as we’ve discussed previously we believe this will provide a decent risk / reward opportunity to fade the move i.e. rotate from growth & traditional yield to cyclical stocks.
MM is still targeting the 99.50 area for Australian 3-year bonds i.e. 0.5%.
Australian 3-year Bonds Chart
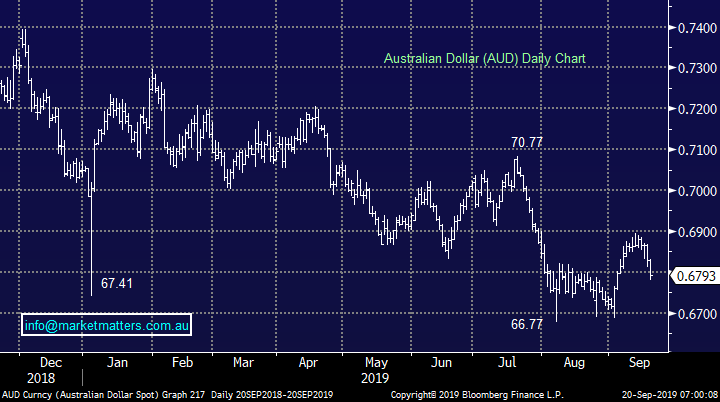
Similarly the Australian Dollar reacted to the employment data by falling back below 68c in anticipation of a rate cut in October. This is potentially the move we have been waiting for to increase our $A exposure in the MM Global Macro ETF Portfolio – Watch this space! : https://www.marketmatters.com.au/new-global-portfolio/
MM is looking for a catalyst to buy the $A.
Australian Dollar ($A) Chart
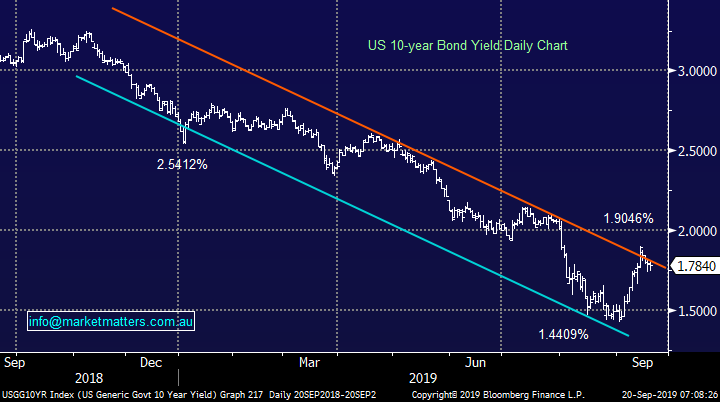
Overnight US bond yields pulled back away from illustrated overhead trendline resistance, no great surprise at this stage. We can see fresh lows but not as clear as our own bond yields hence the renewed weakness in the $A is easy to understand.
MM is neutral US bonds at present.
US 10-Year Bond Yield Chart
Looking at 5 stocks who usually dance the interest rate tune.
Its hard to comprehend the RBA Cash Rate up around 17%, albeit ~30-years ago. However the most eye catching part of the comparative yield chart below is the huge differential between an official Cash Rate appearing destined for 0.5% and the yield on Australia’s largest stock which currently sits at 5.24% fully franked i.e. why hold cash. It reminds me of the below quote:
“Stocks are ridiculously cheap if interest rates stay at these levels” – Warren Buffett in early May 2019.
However since this comment, global bond yields have actually fallen a lot further, he must now believe stocks are almost a steal but yet he’s holding high cash levels implying the belief is actually rates cannot remain here.
Australian comparative yield Chart

Today I have briefly looked at 5 stocks who are influenced by interest rates. NB We no longer consider Telstra (TLS) in the group due to its lower payout. Its recycling more of its earnings into growth than it has in the past, making it ‘less bond like’ – an approach we support however it does change the factors that influence the stock price.
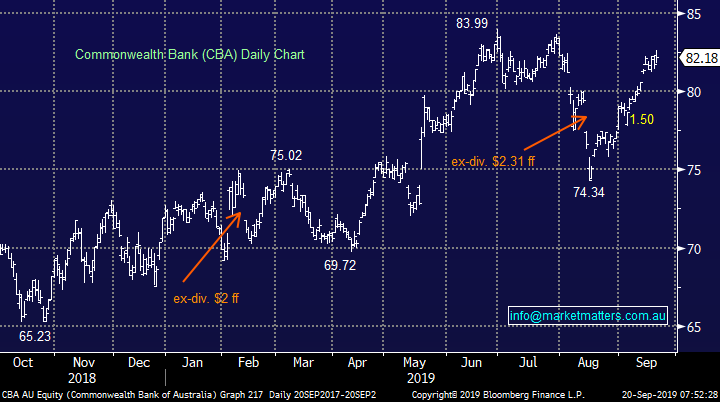
1 Commonwealth Bank $82.18
CBA is positioned beautifully for today’s economic landscape on 2 simple but important fronts:
1 – The bank pays an excellent yield of 5.2% fully franked compared to Term Deposits closer to 1.5%, and likely to fall further – critically we believe this yield is sustainable unless the economy deteriorates significantly from its current levels.
2 – When interest rates eventually turn higher banks should benefit from a margin perspective.
Hence Australian banks find themselves in an ideal win – win position with the Royal Commission in the rear view mirror, paying an excellent yield while not being afraid of an eventual ‘gradual’ uptick in interest rates.
MM likes CBA with an initial target around $85.
Commonwealth Bank (CBA) Chart
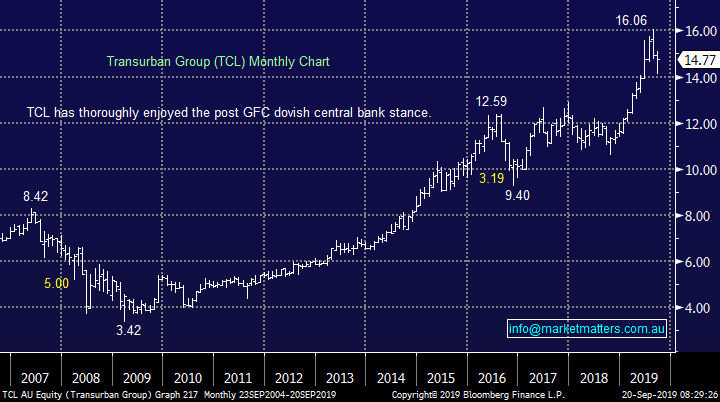
2 Transurban (TCL) $14.77
MM recently bought TCL for our income portfolio following its 12% correction which we believe reinstated some value in the toll road operator – its sustainable 4% part franked yield remains attractive. As we wrote at the time, adding TCL to the portfolio clearly implies that we’re fading the recent upward move in bond yields, or in other words, we’re trading the belief that the short term spike in rates was just that and the engrained downtrend remains intact – for now.
The change in implied rates following yesterday’s employment data certainly supports that view, however I do caution that this is a shorter term play. As interest rates look for a low, TCL should look for a high, and we’ll be likely sellers into that move.
MM likes TCL as a shorter term position targeting a retest of all-time highs.
Transurban (TCL) Chart
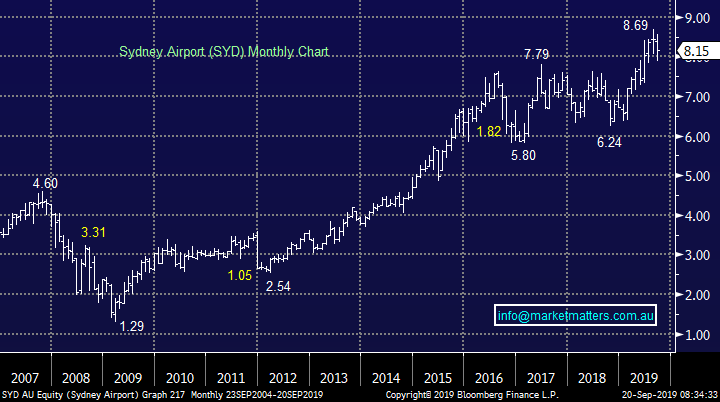
3 Sydney Airports (SYD) $8.15
SYD has remained firm in the current low intertest rate (dovish) economic environment, but with clearly slowing upside momentum. As Alan Joyce (Qantas CEO) & co harped on about this week, Airports are incredibly profitable businesses, particularly in Australia.
SYD currently yields 4.7% unfranked higher than TCL but we see more upside in the toll operators share price short term. If bond yields pullback in the short term as we expect, SYD should trade to new highs again, which becomes a selling opportunity.
MM prefers TCL over SYD.
Sydney Airports (SYD) Chart
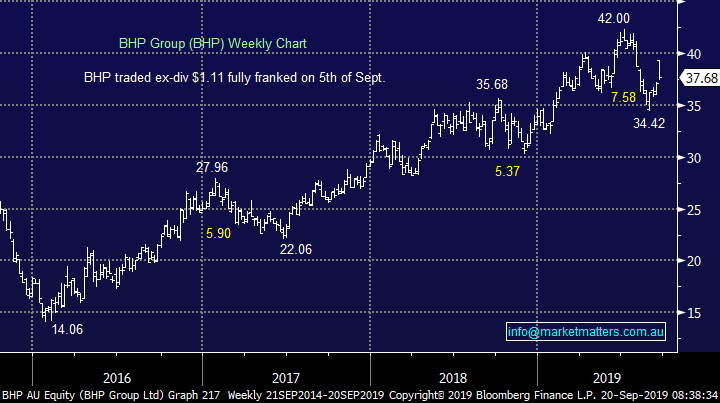
4 BHP Group (BHP) $37.68
“The big Australian” has now been relegated to being the 3rd largest stock on the ASX200 behind CBA and CSL. While we think bond yields pullback short term, this is a fairly micro / short term stance – overall, rates are ‘looking for a low’ in the medium term. If this view proves correct, then we will see a move from growth / traditional yield towards cyclicals such as the resources which would likely enjoy another leg higher.
In terms of BHP, we think the chance of a new trading range between $35 and $45 is high – a 5.5% fully franked dividend is also an attractive component for the stock.
MM remains bullish targeting a rally back above $40.
BHP Group (BHP) Chart
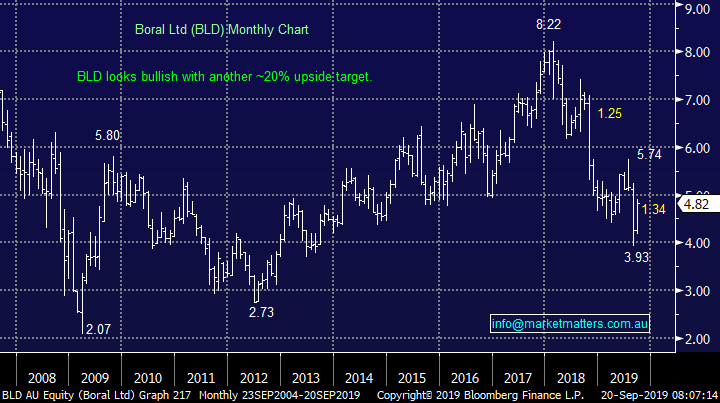
5 Boral Ltd (BLD) $4.82
Buildings product manufacturer BLD is positioned nicely for a major rotation from growth / yield to cyclical stocks – a move MM expect in the medium term. We believe that with interest rates reaching their nadir on the downside that central banks / governments will be looking for economic stimulus from fiscal spending, which should be good news for the construction industry.
Also after almost 2-years in the “naughty corner” the fundamentals are looking good from a risk / reward perspective with BLD’s Est P/E of 13.4x for 2020 not too scary and its 5.7% fully franked yields very attractive.
MM likes BLD with an initial target around 20% higher.
Boral (BLD) Chart
Conclusion (s)
Of the 5 stocks looked at today MM likes all 5 but especially CBA, TCL (short term) and BLD at todays prices with BHP a close 4th.
We also believe another bout of stock / sector rotation back into cyclicals is just around the corner.
Global Indices
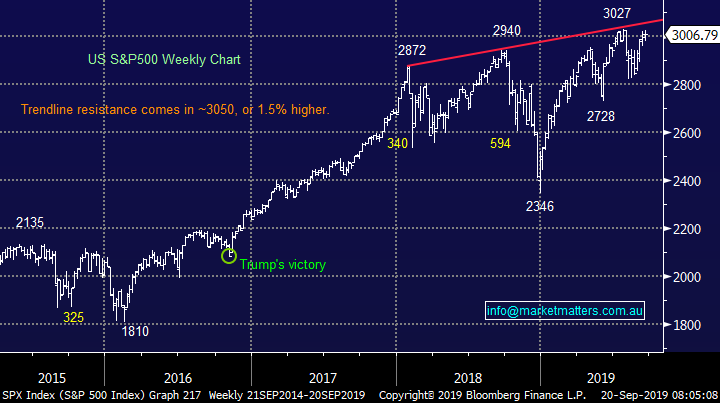
No major change yet, we are looking for a decent pullback for US stocks but no specific sell signals have been triggered – note at the moment we still feel a break to fresh all-time highs will fail to aggressively follow through to the upside.
US stocks remain clearly firm but with little upside momentum.
US S&P500 Index Chart
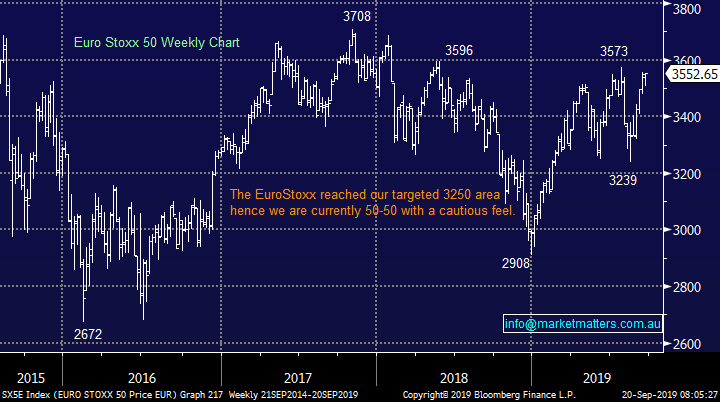
No change again with European indices, while we remain cautious European stocks as their tone has become more bearish over the last few months, however we had been targeting a correction of at least 5% for the broad European indices, this was achieved.
The long-term trend is up hence any “short squeezes” might be harder and longer than many anticipate, potentially one is currently unfolding.
Euro Stoxx 50 Chart
Overnight Market Matters Wrap
· The Australian market is set to end the week on a positive note despite US markets losing early gains to close little changed. All three key US indices earlier came within a whisker of all- time highs, but lost ground throughout the day following Chinese media reports that suggested the US could be set to further escalate the trade war if there was no near term deal. The Dow closed 50pts lower, having given up early 100pt gains, the S&P 500 was flat and the NASDAQ marginally ahead. European markets earlier closed about 0.6% firmer.
· US and Chinese officials are currently meeting in the US, to set the scene for high level trade talks on October. Investors remain wary about the prospects of any near term resolution of the current trade dispute. Oil prices rallied on concerns that the market will remain tight even after the Saudis restore full production soon from their bombed oil facilities, as Middle East tensions remain elevated. The Brent price jumped 1.9% to just under US$65/bbl.
· Other commodities were mixed, with spot gold firming to around US$1500/oz, iron ore 3.3% weaker at US$93.2/tonne, aluminium slightly firmer and copper slightly weaker. Locally yesterday’s weaker than expected jobs report has raised expectations of another 25bp rate cut by the RBA at next month’s meeting, pushing the A$ back below US68c.
Have a great day!
James & the Market Matters Team
Disclosure
Market Matters may hold stocks mentioned in this report. Subscribers can view a full list of holdings on the website by clicking here. Positions are updated each Friday, or after the session when positions are traded.
Disclaimer
All figures contained from sources believed to be accurate. All prices stated are based on the last close price at the time of writing unless otherwise noted. Market Matters does not make any representation of warranty as to the accuracy of the figures or prices and disclaims any liability resulting from any inaccuracy.
Reports and other documents published on this website and email (‘Reports’) are authored by Market Matters and the reports represent the views of Market Matters. The Market Matters Report is based on technical analysis of companies, commodities and the market in general. Technical analysis focuses on interpreting charts and other data to determine what the market sentiment about a particular financial product is, or will be. Unlike fundamental analysis, it does not involve a detailed review of the company’s financial position.
The Reports contain general, as opposed to personal, advice. That means they are prepared for multiple distributions without consideration of your investment objectives, financial situation and needs (‘Personal Circumstances’). Accordingly, any advice given is not a recommendation that a particular course of action is suitable for you and the advice is therefore not to be acted on as investment advice. You must assess whether or not any advice is appropriate for your Personal Circumstances before making any investment decisions. You can either make this assessment yourself, or if you require a personal recommendation, you can seek the assistance of a financial advisor. Market Matters or its author(s) accepts no responsibility for any losses or damages resulting from decisions made from or because of information within this publication. Investing and trading in financial products are always risky, so you should do your own research before buying or selling a financial product.
The Reports are published by Market Matters in good faith based on the facts known to it at the time of their preparation and do not purport to contain all relevant information with respect to the financial products to which they relate. Although the Reports are based on information obtained from sources believed to be reliable, Market Matters does not make any representation or warranty that they are accurate, complete or up to date and Market Matters accepts no obligation to correct or update the information or opinions in the Reports. Market Matters may publish content sourced from external content providers.
If you rely on a Report, you do so at your own risk. Past performance is not an indication of future performance. Any projections are estimates only and may not be realised in the future. Except to the extent that liability under any law cannot be excluded, Market Matters disclaims liability for all loss or damage arising as a result of any opinion, advice, recommendation, representation or information expressly or impliedly published in or in relation to this report notwithstanding any error or omission including negligence.