Revisiting 5 underperformers for opportunities (CGC, GDX US, A2M, PME, SGM, WEB, APX)
Welcome to a new month and quarter, less than 3-months until Christmas - is it just me or does the year feel like it’s simply flown by!
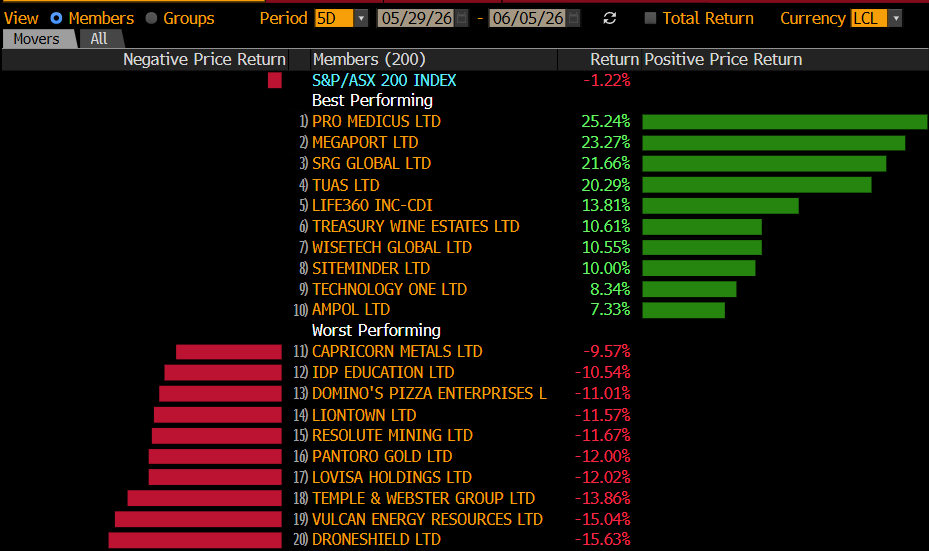
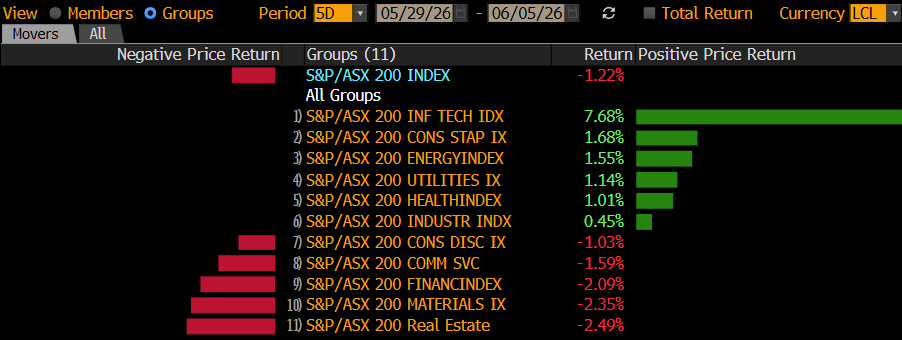
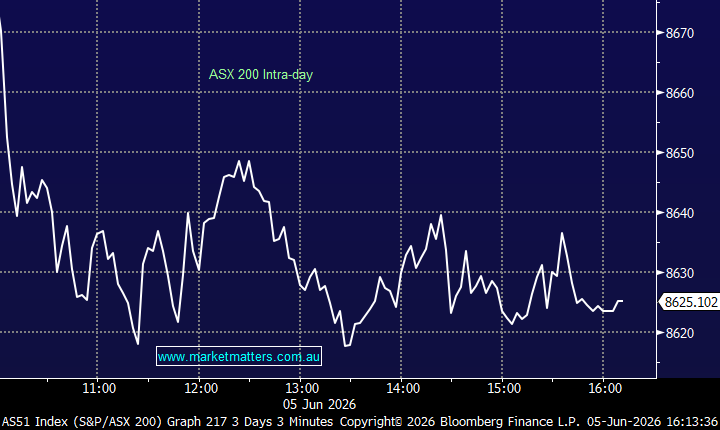
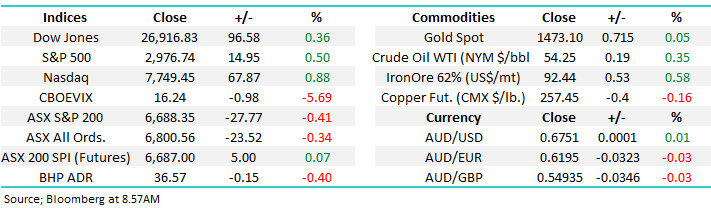
Under normal circumstances I would say that yesterday smelt pretty bad with the market trading down all afternoon, falling almost 50-points from its high to close down -0.4% but end of month & quarter book squaring / shenanigans is usually unpredictable and volatile hence not too much should be read into the selling, particularly given the large futures volume into the close. Under the hood we saw double the number of stocks close down with the Energy sector best on ground just closing positive while the IT stocks carried the wooden spoon led by Appen (APX) and Technology One (TNE) both of whom closed down -2.6% - I can see 100% reversion on this today.
Markets are expecting the RBA to cut official interest rates at 2.30pm today to 0.75%, the lowest in history as we all probably know. Local 3-year bond yields remain under 0.75% and all the surprises will be if the RBA fails to satisfy investors insatiable need for monetary policy “sugar” hits with the most likely risk probably in the boards rhetoric moving forward as equities are also pricing in a second cut to 0.5% in 2020. The action taken by local banks will also be scrutinised today, if they don’t pass on most of any cut why would the RBA bother in 2020!
As we’ve touched on before, equities are walking a fascinating tightrope between historically expensive valuations and unprecedentedly low interest rates which makes stocks arguably incredibly cheap i.e. comments earlier in the year by a relatively cashed up Warren Buffett. To put things into perspective local valuations are very stretched trading at their highest level in the last 15-years if we remove the big iron ore miners from the equation, just when the world appears to be teetering on the edge of a recession but these can be justified by almost zero interest rates across the globe – to MM simply a stock pickers market.
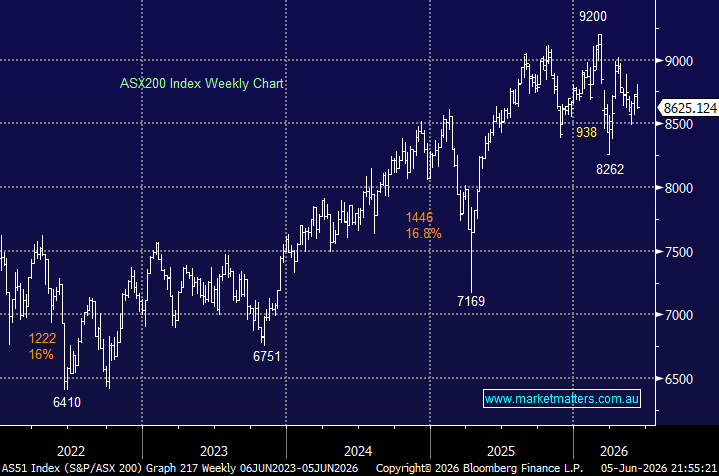
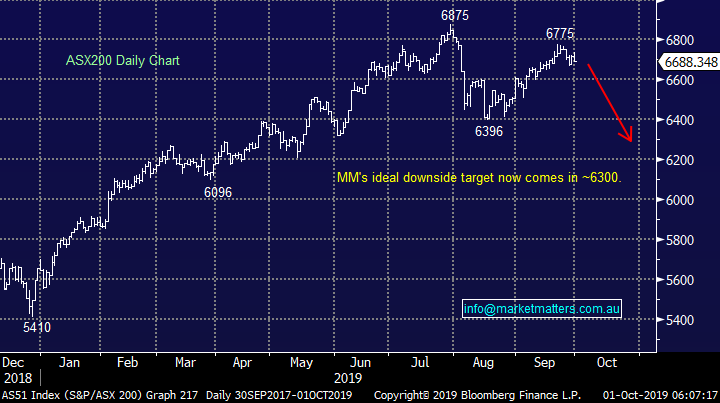
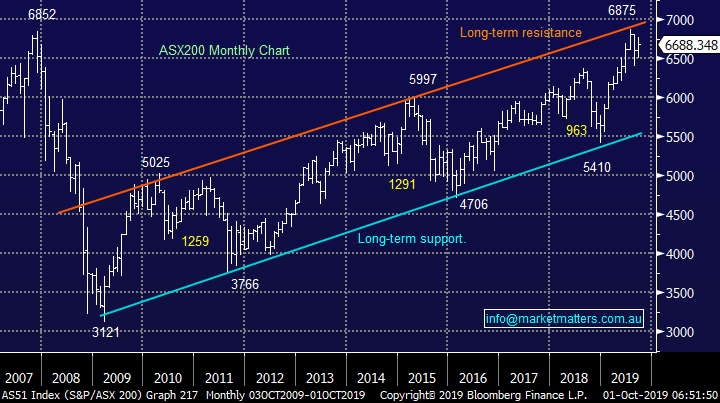
MM will get a technical sell signal on a close by the ASX200 below 6640, only 0.7% lower but yet again there are no sell signal yet for the bears.
Short-term MM remains comfortable adopting a more conservative stance towards equities around current market levels.
Overnight global stocks were firm with the S&P500 rallying +0.5% after the tech based NASDAQ bounced strongly, the SPI futures are calling the local market to open up around ~15-points today with Energy and Gold stocks looking likely to struggle.
This morning MM has looked at 5 stocks which have fallen by more than 10% over the last month in case opportunities are emerging in this richly priced market.
ASX200 Chart
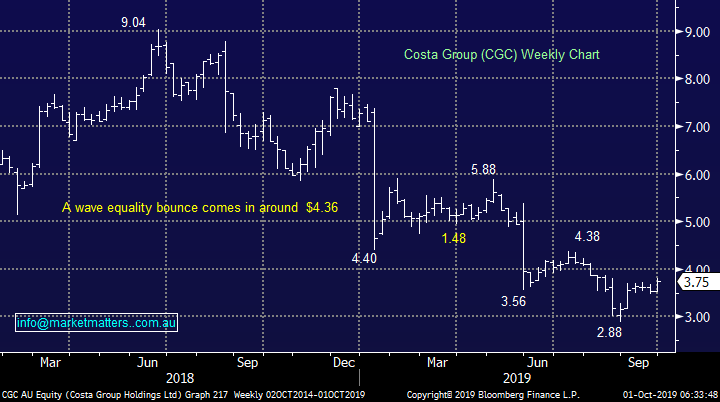
Yesterday Costa Group (CGC) which has been a distinct laggard in the MM Growth Portfolio rallied over 6% which put a smile on my face – a rare occurrence for this stock during our holding period. We have been deliberating switching half of the position to the likes of Ingham’s (ING) at lower levels but at this stage were going to give CGC room, its currently enjoying strong upside momentum which targets levels 10-15% higher, building on its ~20% recovery during September.
MM is currently bullish CGC initially targeting the $4.20 area.
Costa Group (CGC) Chart
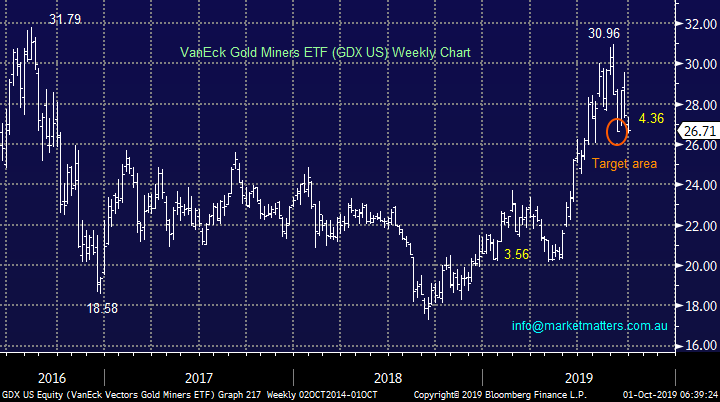
Overnight as we feared gold was whacked almost $US30/oz taking the gold miners ETF which we follow closely down over 2.5%, not too bad but another few % lower would not surprise hence we don’t intend to increase our position just yet.
MM will remain patient for now with regard to adding to our gold position.
VanEck Gold Miners ETF (GDX US) Chart
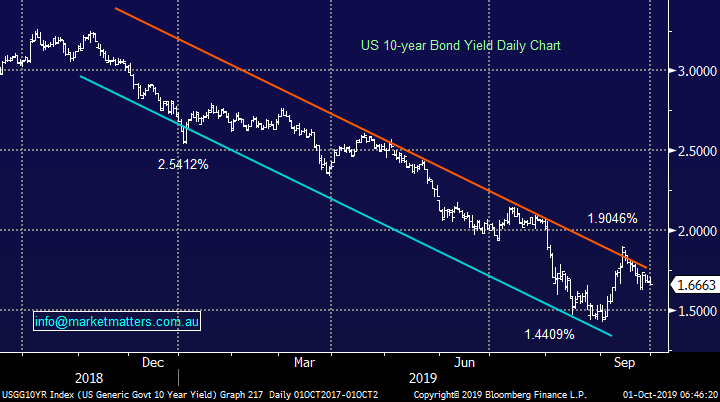
Overnight US bond yields continued their drift to the downside but interesting the $US and gold again ignored the fall. The $US which often plays the music for the gold and oil price dance traded to its highest level since May 2017 putting pressure on both respective commodities.
MM remains neutral / bearish US bond yields at present.
US 10-Year Bond Yield Chart
Looking at 5 stocks that have fallen by over 10% in the last month.
For most of 2019 the ASX200 has climbed a wall of worry largely ignoring an increasing number of geo-political concerns. Generally when stock markets are cashed up and feeling bearish it offers significant support into weakness while a few companies often come strongly into favour. It feels to MM like fund managers are continuing to scour the market for value in a “rich market” – remember the comment earlier, ex the large iron ore stocks the ASX is trading on its highest valuation in 15-years.
Hence we are seeing some battered stocks like CGC yesterday come back into favour with a bang, today we’ve looked at 5 candidates for the next potential jewel in the crown.
ASX200 Index Chart
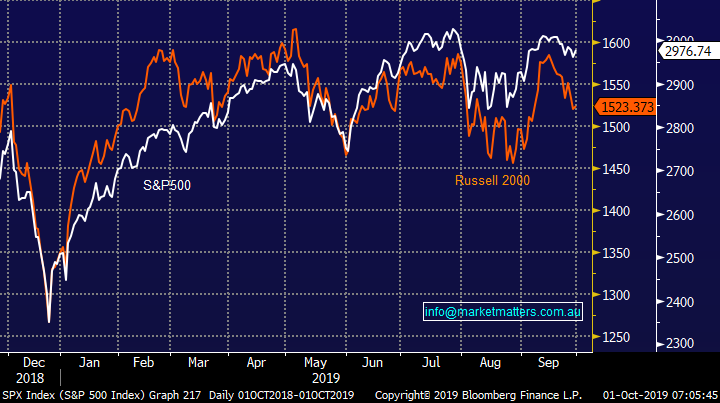
Last week we looked at the relative strength in US indices illustrating investors are becoming nervous with the large cap US S&P500 trading close to its all-time high while the small cap Russell 2000 Index appears to have already commenced a correction i.e. investors are seeking the perceived safety of larger stocks, often with sustainable dividends – this warning signal continues.
The Russell 2000 is telling us all is not well short-term with US stocks.
US S&P500 v Russell 2000 Index Chart
Today I have briefly looked at 5 stocks who endured falls of around 10%, or more, over the last month.
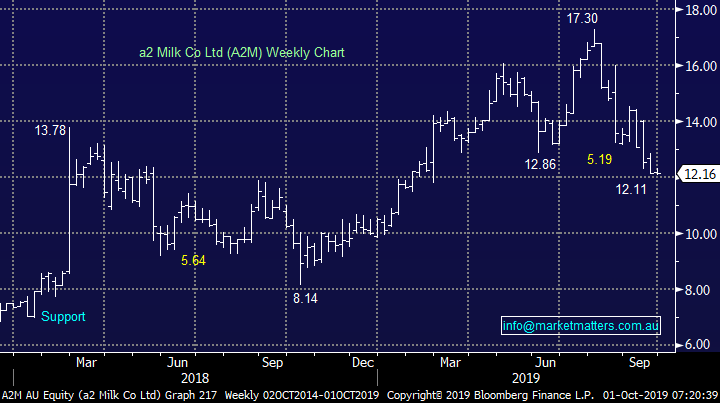
1 a2 Milk (A2M) $12.16
A2 Milk (A2M) has now fallen over 12% in the last month illustrating how stocks can decline when things become too optimistic and everybody’s basically long – A2M is now down ~30% from its 2019 high. The race to gain market share of the Chinese baby formula market is intensifying forcing A2M to spend far more $$ on marketing its product hence the companies margins are slipping. The company disappointed with its recent FY19 result which showed a 46% gain in EBITDA but forward guidance has led to concerns that earnings growth has peaked along with margins, not ideal for a stock priced for continued strong expansion.
The is still trading on a rich Est P/E for 2020 of 29x while technically A2M looks to be headed under $10.
MM is now neutral A2M, although it’s a quality business we feel patience is warranted today.
A2 Milk (A2M) Chart
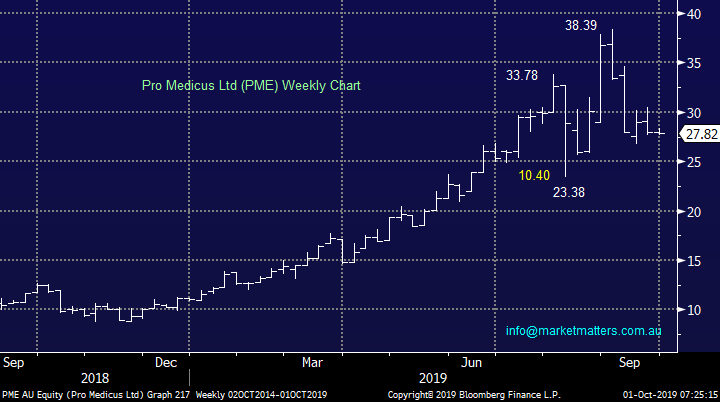
2 Pro Medicus (PME) $27.82
PME has fallen a painful 24% over the last month bringing to an end the shares great run up since Christmas. The health imaging IT business has suffered since 2 of its founders cashed in their chips in a major fashion around $36 no less! While the claim is it was in an effort to improve liquidity of the shares the markets clearly voted with both feet.
This is another business where the market is focussed on growth over and above current earnings which essentially means that it’s a stock that is going to suffer when any less than positive news comes across the ticker, either specifically towards the company or more generally towards the high growth / high valuation stocks. In the last few weeks we’ve seen this theme ‘ sort of’ unwind, with the market becoming a lot more targeted towards members of the sector.
PME’s recent first half numbers were strong showing an almost 60% in crease in revenue to $25m, plus net profit advanced almost 80% to $9m, which is undoubtedly exciting growth if we take a deep breath and not focus too heavily on the current market cap of ~$2.8bn
MM thinks sub $25 PME will look interesting.
Pro Medicus (PME) Chart
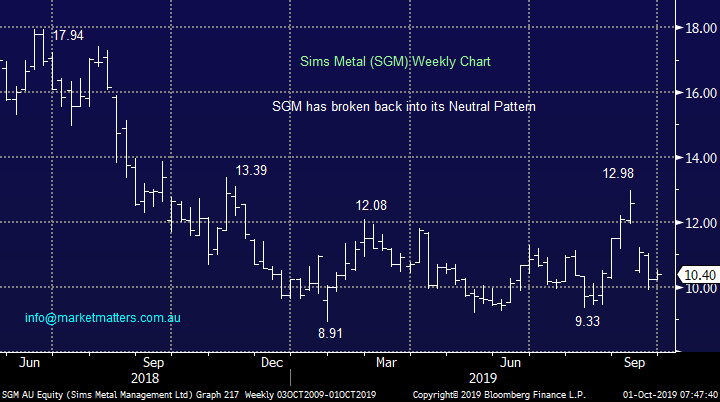
3 Sims Metal (SGM) $10.40
SGM is a slight cheat as its down only -9.5% over the last month but its been a serial disappointer over the last year including catching us once. The stock was hammered last month after a trading update which disappointed the market in a big way – the company said the its next result would be “materially lower” than over the corresponding period last year, not nice rhetoric for any investor.
The companies still trading on an Est P/E for 2020 close to 17x which feels too rich under the current circumstances, although a yield close to 5% unfranked is supportive. At this stage fresh 2018 / 19 lows feel almost inevitable hence we have no interest at current levels.
MM feels SGM is too hard at best.
Sims Metal (SGM) Chart
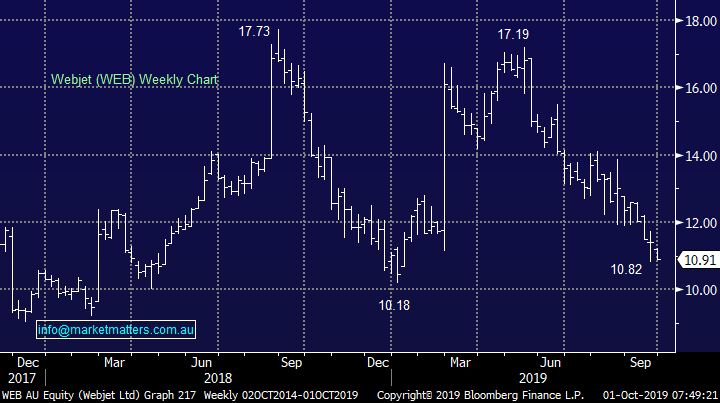
4 Webjet (WEB) $10.91
On-line travel agent WEB has dropped almost 12% over the last month in what’s been a very volatile month for the stock. The stocks suffered badly since the demise of Thomas Cook which we have covered in previous notes but we believe this is a one-off issue, albeit a huge one in terms of a large “right off” and earnings forecast falling ~10% in 2020 and 2021 but the stocks down 36% i.e. the elastic band is stretching.
The downside momentum is falling but a test of $10 still feels a strong possibility, we like the business and would love a final panic lower to establish a position.
MM is interested in WEB around $10.
Webjet (WEB) Chart
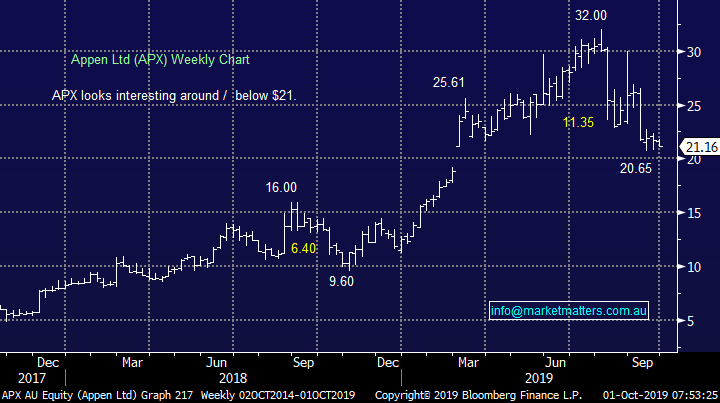
5 Appen (APX) $21.16
Another previous market darling APX has fallen over 18% over the last month illustrating as with A2M that getting married to a stock can be dangerous – it’s a fine art knowing when to run profits or take the $$, an area we continually evaluate across our portfolios.
In isolation APX looks ok as its tests our $21 target area, down almost 35% from its high just a few months ago but we have an issue with the high valuation WAAAX stocks at present – Wisetech (WTC), Appen (APX), Altium (ALU), Afterpay (APT) and Xero (XRO). Our feeling is another anti-growth, valuation contraction, pullback is a strong possibility just as we saw in Q4 of 2018 hence we’re happier being square the group for now.
MM is neutral APX at present.
Appen Ltd (APX) Chart
Conclusion (s)
Of the 5 stocks looked at today MM likes PME and WEB at lower levels which look achievable in Q4 of 2019.
Global Indices
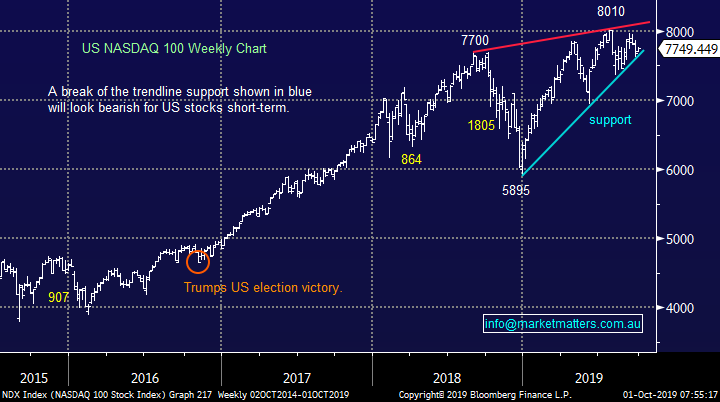
No major change yet, we are looking for a decent pullback for US stocks but no specific sell signals have been triggered – note at the moment we still feel a break to fresh all-time highs will fail to aggressively follow through to the upside.
US stocks remain clearly firm but with little upside momentum.
US NASDAQ Index Chart
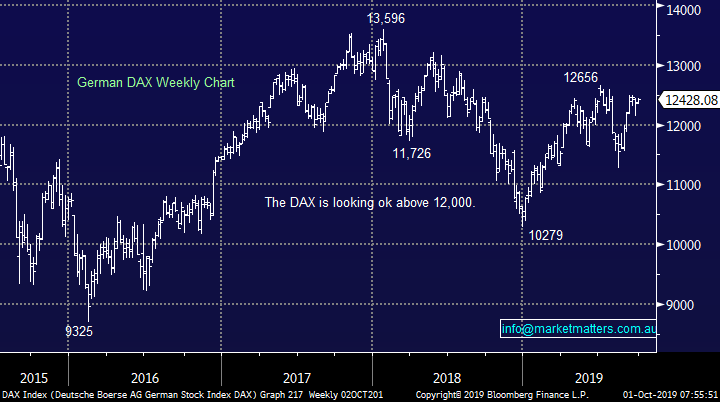
No change again with European indices, while we remain cautious European stocks as their tone has become more bearish over the last few months, however we had been targeting a correction of at least 5% for the broad European indices, this was achieved.
The long-term trend is bullish hence any “short squeezes” might be harder and longer than many anticipate, potentially one is currently unfolding.
German DAX 50 Chart
Overnight Market Matters Wrap
- The US equity markets ended its last session for the September quarter as the Trump administration issued a partial and qualified denial that it is in talks of imposing limits on US investments in Chinese companies and financial markets.
- A quiet session is expected in the Asian region with both China and Hong Kong closed to mark the People’s Republic of China’s 70th anniversary, with traders eager for signals before trade talks resume next week.
· Commodity markets were generally weaker with both gold and crude oil off over 1.9% to around US$1478/Oz and US$53.90/bbl. respectively. The slide in Crude oil was on reports that Saudi production is now back towards pre- September attack levels of 11.3m bbl./day.
- The December SPI Futures is indicating the ASX 200 to open 23 points higher towards the 6710 level with a consensus of 75% chance of a rate cut of 0.25% to be announced this afternoon at 2.30PM.
Have a great day!
James & the Market Matters Team
Disclosure
Market Matters may hold stocks mentioned in this report. Subscribers can view a full list of holdings on the website by clicking here. Positions are updated each Friday, or after the session when positions are traded.
Disclaimer
All figures contained from sources believed to be accurate. All prices stated are based on the last close price at the time of writing unless otherwise noted. Market Matters does not make any representation of warranty as to the accuracy of the figures or prices and disclaims any liability resulting from any inaccuracy.
Reports and other documents published on this website and email (‘Reports’) are authored by Market Matters and the reports represent the views of Market Matters. The Market Matters Report is based on technical analysis of companies, commodities and the market in general. Technical analysis focuses on interpreting charts and other data to determine what the market sentiment about a particular financial product is, or will be. Unlike fundamental analysis, it does not involve a detailed review of the company’s financial position.
The Reports contain general, as opposed to personal, advice. That means they are prepared for multiple distributions without consideration of your investment objectives, financial situation and needs (‘Personal Circumstances’). Accordingly, any advice given is not a recommendation that a particular course of action is suitable for you and the advice is therefore not to be acted on as investment advice. You must assess whether or not any advice is appropriate for your Personal Circumstances before making any investment decisions. You can either make this assessment yourself, or if you require a personal recommendation, you can seek the assistance of a financial advisor. Market Matters or its author(s) accepts no responsibility for any losses or damages resulting from decisions made from or because of information within this publication. Investing and trading in financial products are always risky, so you should do your own research before buying or selling a financial product.
The Reports are published by Market Matters in good faith based on the facts known to it at the time of their preparation and do not purport to contain all relevant information with respect to the financial products to which they relate. Although the Reports are based on information obtained from sources believed to be reliable, Market Matters does not make any representation or warranty that they are accurate, complete or up to date and Market Matters accepts no obligation to correct or update the information or opinions in the Reports. Market Matters may publish content sourced from external content providers.
If you rely on a Report, you do so at your own risk. Past performance is not an indication of future performance. Any projections are estimates only and may not be realised in the future. Except to the extent that liability under any law cannot be excluded, Market Matters disclaims liability for all loss or damage arising as a result of any opinion, advice, recommendation, representation or information expressly or impliedly published in or in relation to this report notwithstanding any error or omission including negligence.