Overseas Wednesday – International Equities & ETF Portfolios (BABA US, V US, MSFT US, DTYS US)
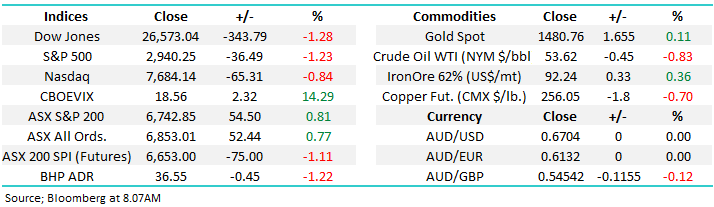
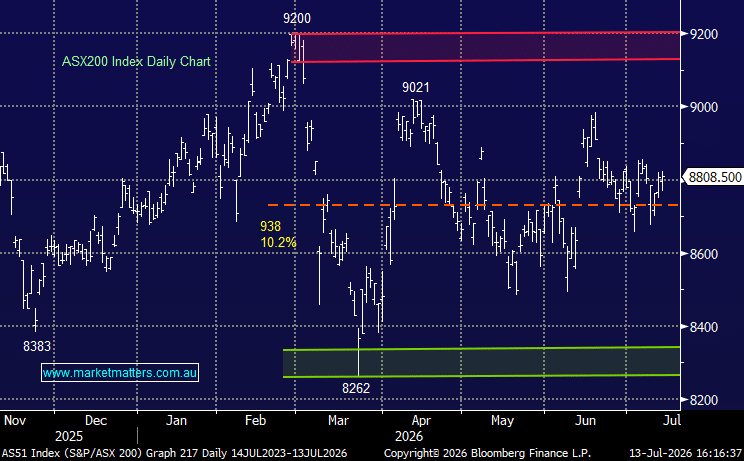
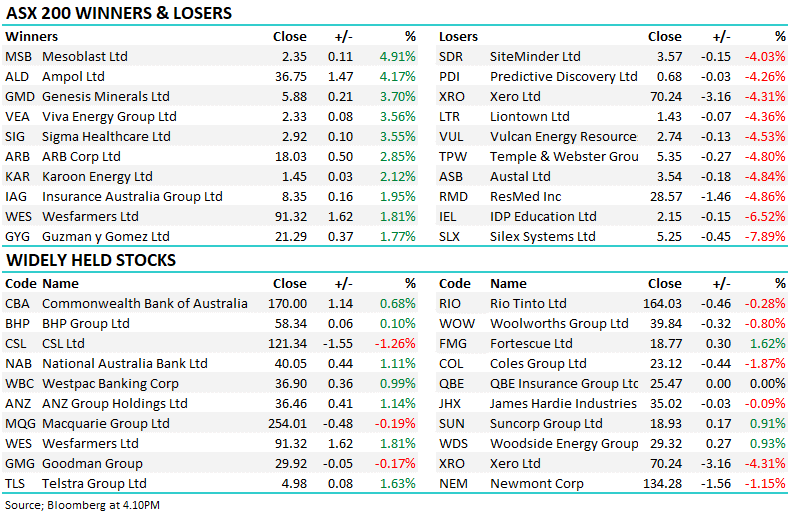
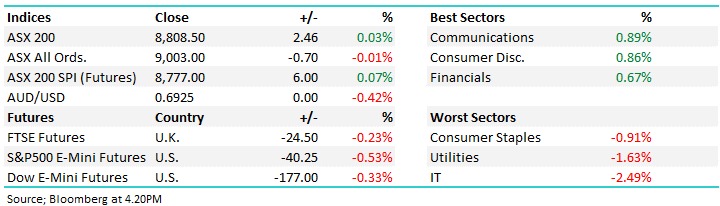
The ASX200 enjoyed a rate cut induced rally on Tuesday eventually closing up over 50-points with all the gains coming after the RBA cut its Official Cash Rate from 1% to 0.75% at 2.30 pm, a move which subscribers know was largely expected. The buying yesterday was broad-based with winners dominating losers by 3-1, only Energy & Gold stocks struggled as did the banks but to a far lesser extent – two of these pockets of weakness are likely to continue this morning with both the US Energy and Financial sectors tumbling by over 2% last night.
At MM we were surprised how strongly local stocks embraced the rate cut yesterday as it was already priced into the market however the RBA’s ongoing clear “Easing bias” has many economists now expecting another 0.25% sooner rather than later plus the potential for “unconventional monetary policy” as Goldman Sachs put it following the RBA’s statement. In simple English the RBA is going to throw the proverbial kitchen sink at our economy in an attempt to kick start inflation – while nobody I know feels particularly rich at the moment -Mal who sits up the desk from me is even trying to offload his Chalet in Thredbo, most people are describing things as tough but not dire…..I ponder what are the RBA seeing percolating beneath the surface, or it is simply a case of relativity versus other central banks?
Overall our stance remains the same, this does not feel like a market where strength should be chased, especially if we consider the ASX200 still sits almost 25% above last Decembers low however equally, lower interest rates will support stocks into weakness. I was chatting with Martin Crabb our Chief Investment officer at Shaw yesterday about what valuation the local market could hold with rates at zero. Right now, expected earnings per share (EPS) for the market is 420 and with the index at 6700,that implies a PE of 16x. With zero interest rates a market could hold a valuation of 20x, or 8400 for the ASX 200 with no earnings growth!
While valuations are on the expensive side – in fact they sit at their highest level in 15-years ex-the major iron ore plays, interest rates remain the key.
Overall MM remains comfortable holding higher cash levels / being more defensive than during the first 6-months of 2019.
Overnight US stocks were sold off aggressively following weak manufacturing data from both the US and Europe, a session where the increasing risks of a recession in 2020 clearly trumped the recent sugar hits for asset prices of lower interest rates and likely QE. The SPI futures are calling the ASX200 to open down almost 75-points this morning, wiping off all of yesterday’s gains, and some. Today will be a fascinating session i.e. will we focus on the RBA’s huge tailwind for stocks or will the ASX again become a global index and tumble along with both the US and Europe.
In today’s report as usual we are going to look at our International and ETF Portfolio’s after firstly looking at some of our evolving broad macro opinions on markets – please excuse the general repetition on the portfolios but were currently floating in no-mans land hence our opinions / plans are not changing significantly week to week. We remain net bearish short term international markets and have positioned that way.
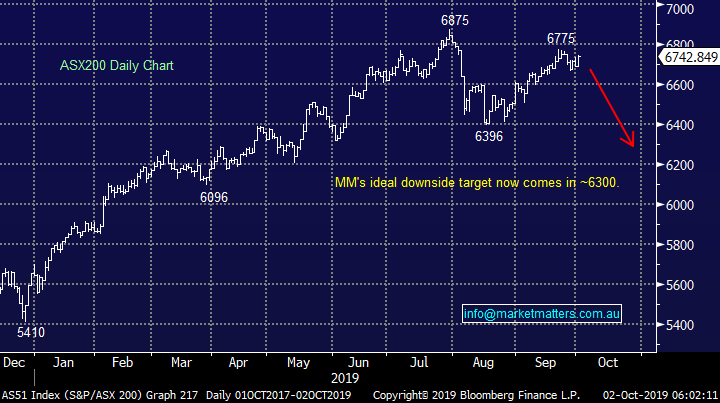
ASX200 Chart
Where to now for US stocks?
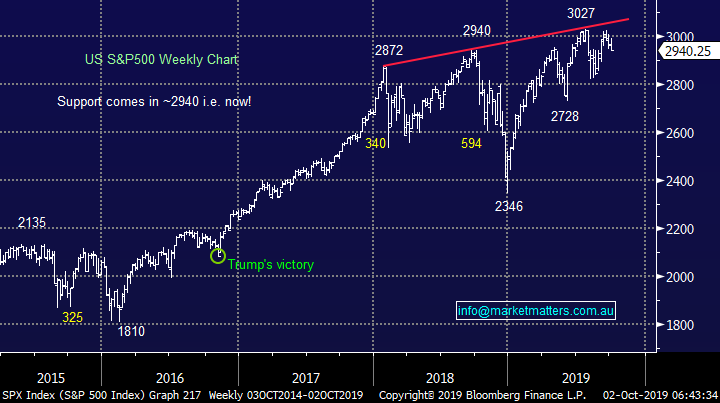
Last night’s aggressive decline by US stocks hasn’t triggered any sell signals for MM but it’s starting to feel like when, not if, we see a decent pullback. Importantly MM will be looking to buy such a pullback, not sell into the weakness. The major US indices basically all closed on their technical support levels at 6am this morning, further weakness tonight and MM will get clear technical sell signals.
MM believes US stocks are poised to correct at least 5%.
US S&P500 Chart
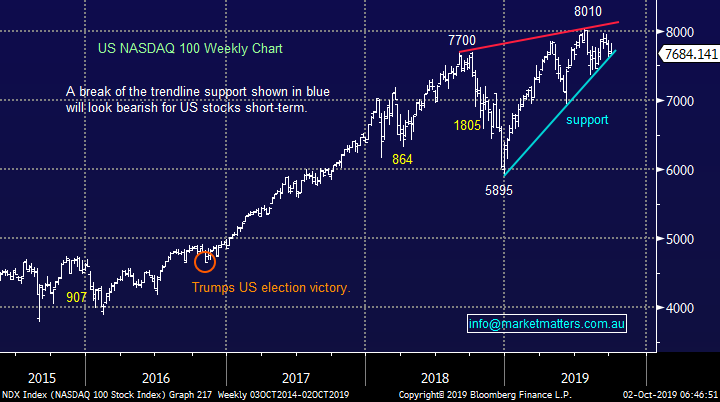
US NASDAQ Chart
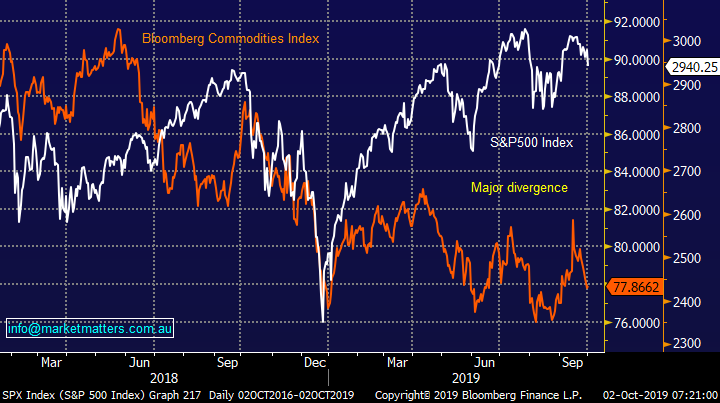
At MM we like our charts and the below one of the US S&P500 Index against the Bloomberg Commodities Index is a clear concern for equities. Historically these 2 move fairly well in tandem which makes sense as they both measure economic health and activity but today we can see significant divergence implying stocks should fall or commodities rally, or of course a bit of both.
MM believes US stocks are poised to correct at least 5%.
US S&P500 v Bloomberg Commodities Index Chart
Do bond yields remain the key?
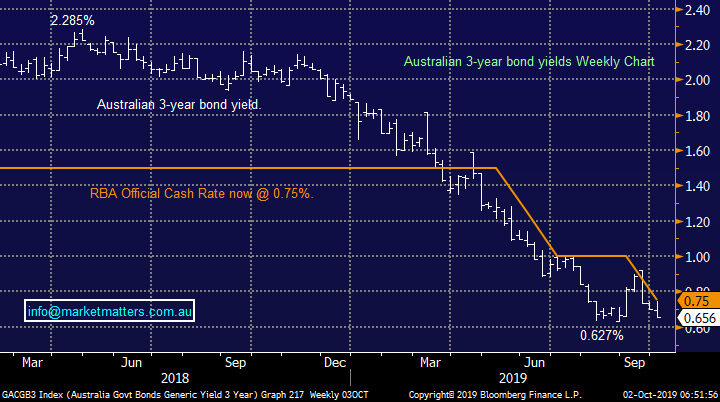
As we’ve anticipated Australian 3-year bonds yields remain on course to make fresh all-time lows as markets factor in yet another rate cut by the RBA in the coming months. However we reiterate a move towards 0.5% is one MM is likely to fade as opposed to embrace i.e. avoid “yield play” stocks in preference to cyclicals moving forward.
We can envisage 2 scenario’s unfolding into new lows for Australian bond yields:
1 – Official Interest rates stabilise at 0.5%, in a similar manner as they did through 2016 to 2018, as the RBA waits to see the impact of their current extremely accommodative policy on our economy.
2 – Housing prices and inflation kicks up faster than expected and the RBA are forced to hike rates in the years ahead – certainly wouldn’t be the first time they’ve gone too far in one direction.
In both scenarios the risk / reward we feel is rapidly diminishing to the downside.
Australian 3-year bond yields Chart
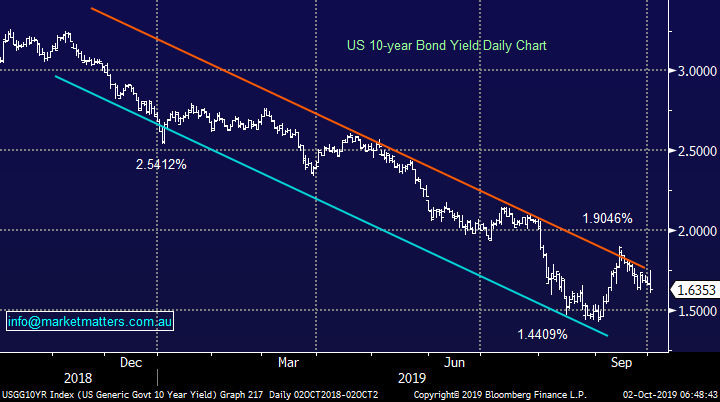
No major change with bond yields, the US 10-years often exert a large influence on equities but an ongoing correction in stocks would more than likely see the safety of bonds again enjoy a strong bid tone sending their respective yields lower i.e. stocks lead bond yields for a while.
MM believes the bear market for bond yields is very mature but new lows would not surprise.
We believe the risk / reward favours the cyclicals into any pullback towards / below 1.5% for the US 10-year bond yield, MM is likely to invest accordingly.
US 10-year bond yields Chart
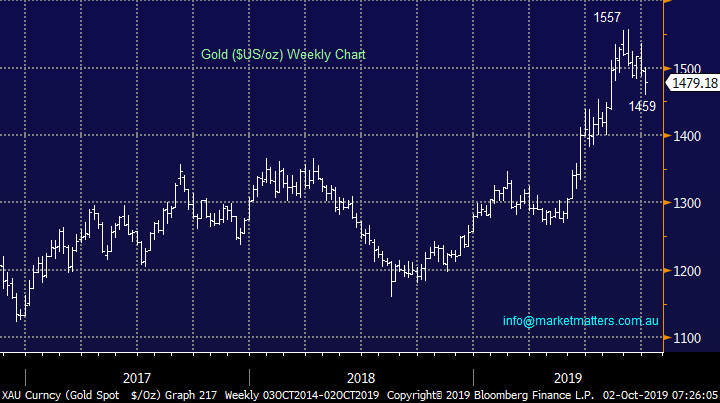
Where to now for Gold?
No major change, MM has used the recent weakness in the gold sector to buy Evolution Mining (EVN) and Newcrest Mining (NCM) – note we currently anticipate holding these stocks for weeks, not months.
Over the last few weeks gold has corrected almost $US100/oz, or 6.5%, we feel its now close to turning back up and generating a strong buy signal, another $US10/oz will do the trick.
MM will become very bullish gold on a close above $US1490.
Gold ($US/oz) Chart
Currencies are following bond yields
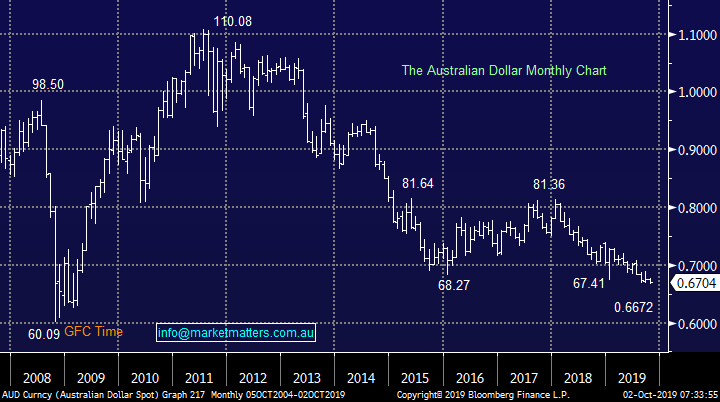
Lastly the Aussie dollar which is coming under fundamental pressure from most angles but especially interest rates / bond yields, the RBA cutting faster and deeper than the US. However we continue to look for a major bottom in the $A, on the news front, I cannot imagine it getting too much worse!
MM believes the $A is looking for / has reached a major point of inflection.
Australian Dollar Chart
International Equites Portfolio
No change again, our MM International Portfolio continues to perform steadily supporting our patient approach to this relatively new offering: https://www.marketmatters.com.au/new-international-portfolio/
MM still hold 72% in cash looking to buy weakness through October, plus we hold 8% in bearish S&P500 ProShares ETF (SH US) and 5% in Barrick Gold (Gold US) both of which will probably be closed / switched if our anticipated pullback scenario unfolds and these securities trade higher.
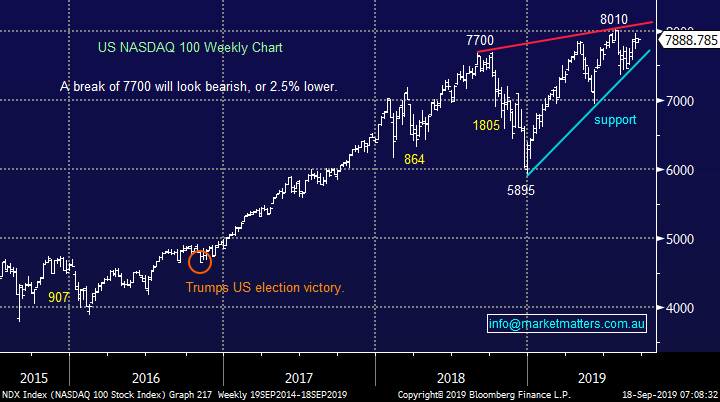
MM still believes the risk / reward for US stocks is on the downside into October, they may have just started to listen.
As discussed earlier last nights drop by US stocks feels like we may be off to the races on the downside BUT no sell signals have been triggered just yet.
US NASDAQ Index Chart
Although the saying “what goes down must come up” usually makes zero sense when investing in the stock market but if like today we are looking for a buying opportunity into weakness it has more foundation hence we are looking for opportunities in stocks we like which may get hit hard – we can actually see some selling unfolding in a few of the recent “go to” stocks which investors feel complacently long.
Below are 3 of our favourites, all of which we have touched on multiple times before, but patience is a virtue with investing and forcing issues generally leads to poor returns.
Importantly subscribers should understand that if / when we get the buying opportunities MM has been patiently waiting for we are likely to deploy over 50% of our free cash into the market over only a few days.
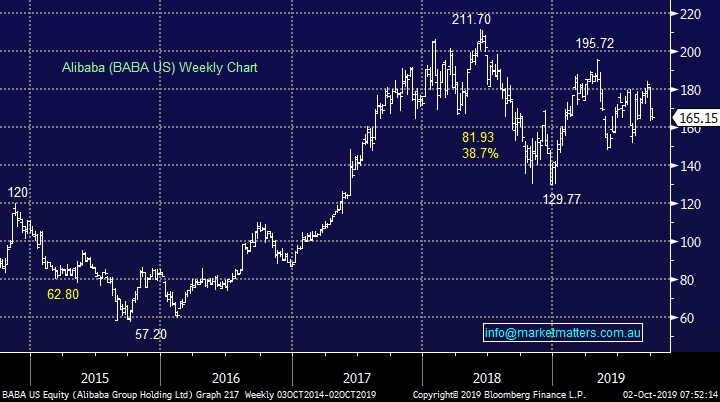
1 Alibaba (BABA US) $US165.15
MM believes Alibaba is poised for a sharp drop in line with the weak Hong Kong / Emerging Market Indices. We are a fan of the China based internet and e-commerce based business which is currently on the nose due to US - China trade issues.
MM initially likes BABA around $US140.
Alibaba (BABA US) Chart
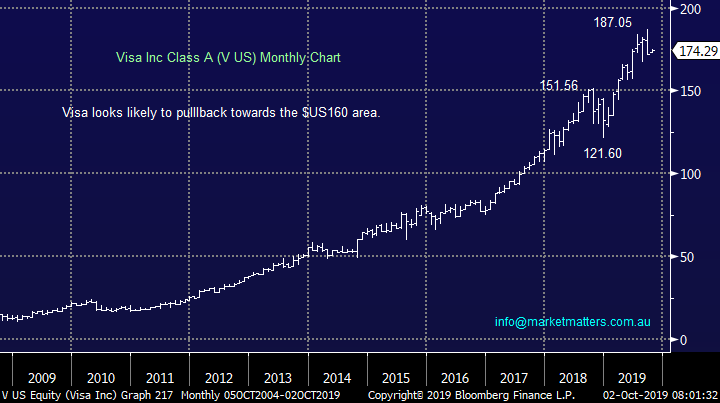
2 Visa Inc (V US) $US174.29
Household name Visa has been revelling in the tap-to-pay / passé cash society which is evolving before our eyes, a fact that’s clearly illustrated by the chart below.
However this is one stock that feels very owned and hence vulnerable to a decent correction, a move that will have MM accumulating as others potentially bail out.
MM likes Visa to weakness starting ~$US160.
Visa Inc (V US) Chart
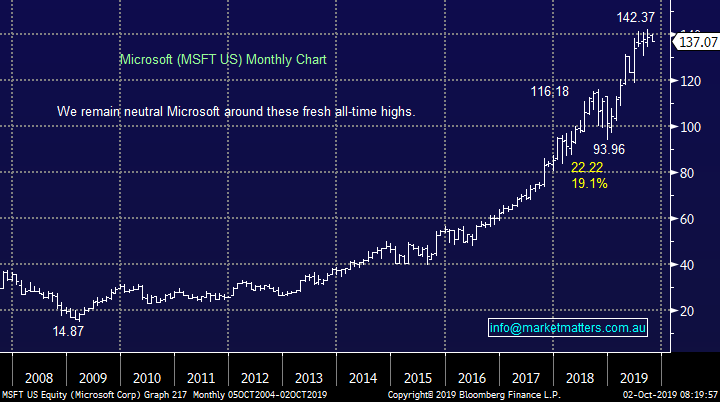
3 Microsoft (MSFT US) $US137.38
Another candidate for a “crowded trade” pullback is Microsoft - the best companies whose shares have been performing strongly often become rapidly oversold on profit taking when markets have a pullback, we will be very keen buyers of Microsoft if this occurs, ideally around $US120.
MM is bullish MSFT around $US120.
Microsoft (MSFT US) Chart
MM Global Macro ETF Portfolio
No change again, MM increased our portfolio holdings last month by buying into the Silver ETF (SLVP US) plus increasing our ProShares Short S&P500 ETF & $A positions, we now have 69.5% in cash : https://www.marketmatters.com.au/new-global-portfolio/
We remain comfortable with our 4 positions but further tweaks are set to unfold in the weeks ahead:
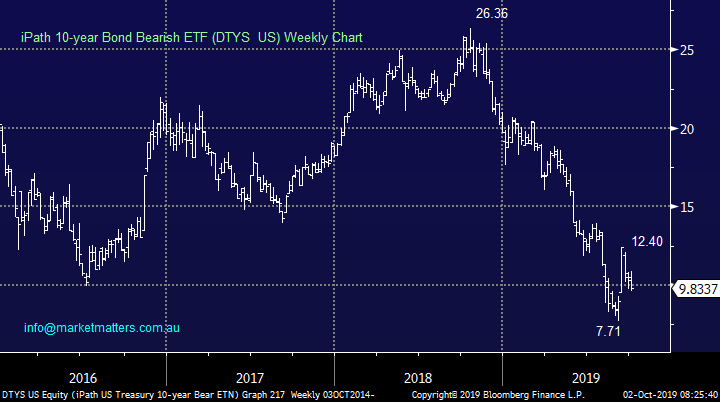
1 – The very topical bond market; we feel that US 10-year bonds are in their final leg of declining yields for 2019. MM are keen buyers of a dip to fresh lows in the Bear ETF (DTYS US), ideally around the ~7.50 area.
Details of this ETF are explained on this link : https://etfdb.com/etf/DTYS/
iPath 10-year Bond Bearish ETF (DTYS US) Chart
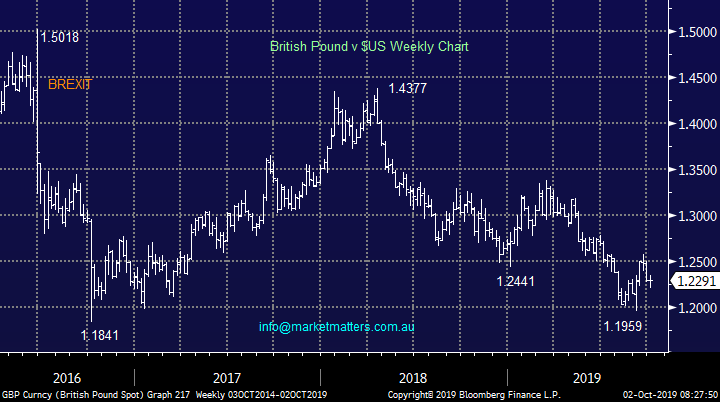
2 – Secondly, the debacle called BREXIT which we believe is slowly but surely coming to conclusion although it might still claim its last casualty with Prime Minister Boris Johnson enduring a tough time at present. MM is watching for any panic spike lower in the Pound as a potential buying opportunity because we believe things wont be as bad as many fear in the years ahead i.e. markets hate the unknown!
Details of our preferred British Pound ETF are explained on this link : https://etfdb.com/etf/UGBP/
British Pound Chart
Conclusion (s)
MM remains net bearish global stocks in the weeks ahead and will be looking for opportunities to switch our “book of positions” around if a pullback unfolds.
Overnight Market Matters Wrap
- Global equity markets sold off overnight, as investors fear of a slowdown in global growth following a weak reading on American manufacturing data.
- The ‘safe haven’ assets such as gold and treasuries were the stars overnight following the concerns of a contagion effect into the services economy as investors now sit tight for the employment data tonight and Fed Reserve Chair, Powell to speak this Friday.
- On the commodities front, crude oil slid further, currently sitting back at US$53.62/bbl. with BHP expected to underperform the broader market after ending its US session down an equivalent of -1.22% from Australia’s previous close.
- The December SPI Futures is indicating the ASX 200 to open 64 points lower towards the 6680 level this morning. Geopolitical tensions may help the market lower with reports of a misile being launched by North Korea this morning.
Have a great day!
James & the Market Matters Team
Disclosure
Market Matters may hold stocks mentioned in this report. Subscribers can view a full list of holdings on the website by clicking here. Positions are updated each Friday, or after the session when positions are traded.
Disclaimer
All figures contained from sources believed to be accurate. All prices stated are based on the last close price at the time of writing unless otherwise noted. Market Matters does not make any representation of warranty as to the accuracy of the figures or prices and disclaims any liability resulting from any inaccuracy.
Reports and other documents published on this website and email (‘Reports’) are authored by Market Matters and the reports represent the views of Market Matters. The Market Matters Report is based on technical analysis of companies, commodities and the market in general. Technical analysis focuses on interpreting charts and other data to determine what the market sentiment about a particular financial product is, or will be. Unlike fundamental analysis, it does not involve a detailed review of the company’s financial position.
The Reports contain general, as opposed to personal, advice. That means they are prepared for multiple distributions without consideration of your investment objectives, financial situation and needs (‘Personal Circumstances’). Accordingly, any advice given is not a recommendation that a particular course of action is suitable for you and the advice is therefore not to be acted on as investment advice. You must assess whether or not any advice is appropriate for your Personal Circumstances before making any investment decisions. You can either make this assessment yourself, or if you require a personal recommendation, you can seek the assistance of a financial advisor. Market Matters or its author(s) accepts no responsibility for any losses or damages resulting from decisions made from or because of information within this publication. Investing and trading in financial products are always risky, so you should do your own research before buying or selling a financial product.
The Reports are published by Market Matters in good faith based on the facts known to it at the time of their preparation and do not purport to contain all relevant information with respect to the financial products to which they relate. Although the Reports are based on information obtained from sources believed to be reliable, Market Matters does not make any representation or warranty that they are accurate, complete or up to date and Market Matters accepts no obligation to correct or update the information or opinions in the Reports. Market Matters may publish content sourced from external content providers.
If you rely on a Report, you do so at your own risk. Past performance is not an indication of future performance. Any projections are estimates only and may not be realised in the future. Except to the extent that liability under any law cannot be excluded, Market Matters disclaims liability for all loss or damage arising as a result of any opinion, advice, recommendation, representation or information expressly or impliedly published in or in relation to this report notwithstanding any error or omission including negligence.