Month: May 2016
How we intend to play Gold from here… Commodities tumbled last night as we’d predicted over recent weeks with Gold -2.2%, Oil -3.2%, Iron Ore -5.7% and Copper -2.5%. Obviously like all market calls we may ultimately be proven wrong but while prices unfold as expected “plans” need to be prepared to profit from these movements. Ultimately we believe this gold weakness will create some excellent buying opportunities but at this stage we continue to believe the banks will be the best performing sector in May, and perhaps June. Our main concern remains with the health of the iron ore and copper sectors however we believe Gold has an exciting 12 months ahead. Gold has rallied US258/oz (24.6%) from its lows of December 2015, topping out last week. Our current view is this initial advance is complete and gold will now undergo a significant correction to this year’s gains and we will be looking to buy this retracement if it unfolds. Last night gold ETF’s in the US were down over 6% and it will be interesting to see if this weakness continues locally. At this point in time the US1200/oz area is the ideal area to buy – see chart 1. Gold Weekly Chart
“Doctor Copper” remains bearish on the world economy Copper has long been famed for its ability to forecast the turning points in the global economy. Simply because copper is used in most sectors of the economy the demand for copper is often regarded as a reliable leading indicator for the world’s economic health. Rising copper prices indicate strong demand for the base metal and hence a growing economy but falling prices implies sluggish demand and a potential economic slowdown ahead / underway Technically we maintain our bearish view on copper, that we have held for over 2 years, targeting the 150 area, or a further 30% fall in prices – not a particularly aggressive prediction considering copper has already more than halved in price (see chart 1). It was interesting that copper did not get too excited when iron ore and oil enjoyed explosive short covering rallies of late. Copper is topical at the moment as last week we saw Rio Tinto (RIO) give the green light to their Oyu Tolgoi copper project, with the commitment to Phase 2 (underground) expansion with a capex investment of US$5.3bn for 1st production in 2020 and full production in 2027 at a run rate of 560ktpa between 2025 & 2030. It’s clear right now the Copper market is oversupplied and will be until at least 2018, which is supportive of our bearish case scenario for the metal over the next 12-18 months HOWEVER, on most assumptions, the market becomes more balanced and prices should track higher up into this projects guided time frame. So, lower prices first, another 30% in our view before a recovery plays out. Copper Monthly Chart
Is there still value in the strong REIT’s sector? The REIT’s (Real Estate Investment Trusts) sector has rallied strongly since the recent interest rate cut albeit without the fanfare of the local banking sector. The REIT sector is up 3.6% over the last 5 days with four of the sector heavyweights rallying over 5% during the same period. Today we will look at these four stocks as we continue to search for value, plus risk / reward, in today’s volatile market. The press has recently been full of the risks for the Australian property market making many investors shy away from the correlated REIT sector. The REIT’s own property and derive income from rental returns hence the below are some of the obvious factors relevant to the sector:
Do we see opportunities in the stocks that have recently been smacked? We are currently holding an aggressive 40% of our portfolio in cash and are hence scouring the market for solid risk / reward opportunities in stocks / sectors we like. As our subscribers know, at times, we are not afraid of buying stocks that are totally unloved, hence today we cast our eyes over 3 large cap stocks that have literally plummeted over the last few days.
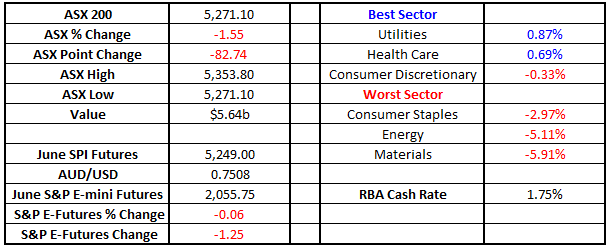
The RBA unleashes a beast! Please excuse two consecutive titles with exclamation marks however yesterday was no ordinary day for the ASX200. The local market was trading up around +30 points at 2.30pm yesterday following our script nicely of banks up and resources lower, then BANG the RBA surprisingly cut interest rates to 1.75%, the lowest level in history. The impact on high yielding stocks was almost unprecedented with the market surging an additional 80 points led by the banking sector which closed up over 3% for the day, after actually opening in the red. ANZ had an amazing +8.4% turnaround, hopefully some subscribers managed to get on board from our alert. There was literally only a few minutes window of opportunity. The market is already looking for another rate cut from the RBA as they rarely cut once in isolation – the futures market is pointing to a better than even chance of a second cut by August to 1.5%. This morning we’ve turned on our Bloomberg machines to see US equities down almost 1% and the SPI futures pointing to a 40 point fall for the ASX200 on the open led by BHP which is down ~~$1 (4.8%) in the US. With such volatility in world markets its time to again clarify how we currently see equities going forward. ASX200 Daily Chart
Really bullish, there's more to go in the reflation rally

Please enter your login details
Forgot password? Request a One Time Password or reset your password
One Time Password
Check your email for an email from [email protected]
Subject: Your OTP for Account Access
This email will have a code you can use as your One Time Password for instant access
To reset your password, enter your email address
A link to create a new password will be sent to the email address you have registered to your account.
Enter and confirm your new password
Congratulations your password has been reset
Sorry, but your key is expired.
Sorry, but your key is invalid.
Something go wrong.

Only available to Market Matters members
Hi, this is only available to members. Join today and access the latest views on the latest developments from a professional money manager.

Smart Phone App
Our Smart Phone App will give you access to much of our content and notifications. Download for free today.

