Month: April 2016
Show more…
You need to be a member to view this article
REGISTER FOR FREE INSTANT ACCESS
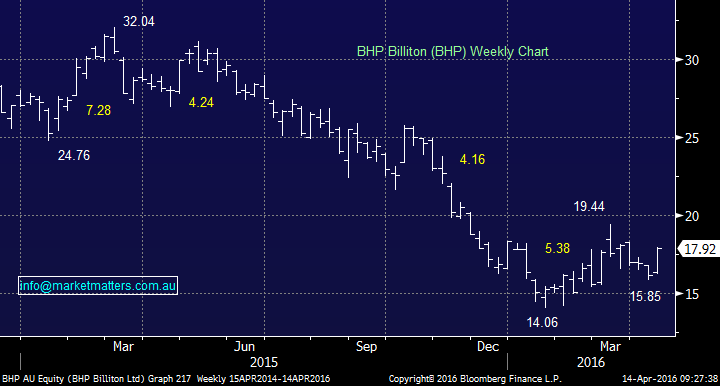
What a difference a few days and months make! In Monday’s report, we discussed the CRB Index and resource stocks, specifically stating we would only consider buying BHP around $13. This morning, BHP is set to open over $18.50, up an impressive 15% for the week!
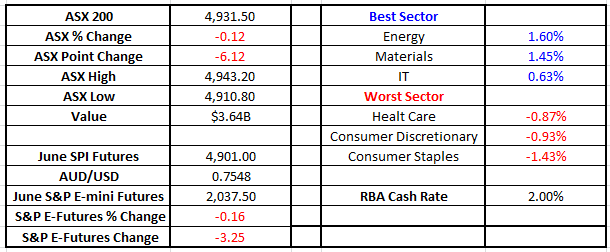
The IMF lowers world growth forecasts & commodities rally? Last night the International Monetary Fund (IMF) lowered world growth forecasts to 3.2% from 3.4%, a figure we still believe may prove optimistic. However, as these negative headlines hit the newswires there was no reaction from markets, the reason is simple – the IMF, like ratings agencies, are behind the curve unfortunately generally playing catch up to market economists/traders. For example world interest rates have remained rooted at historically low levels, indicating no anticipated imminent pickup in economic activity – German 2 year rates are at minus 0.514%. The market will tell you how it sees things going forward and this is where Market Matters looks for clues to the direction of markets. 1. Canadian S&P Composite Index Technically the ASX200 is tricky at present as weakness from the local banking sector has more than offset the strength in the resources sector. However, when we look at the highly correlated Canadian Index the picture becomes clearer. Short term we expect:
Show more…
You need to be a member to view this article
REGISTER FOR FREE INSTANT ACCESS
The CRB Index (Commodities Index) led stocks into significant falls in both the May / June and October / November periods last year, things are again looking interesting.
Really bullish, there's more to go in the reflation rally

Please enter your login details
Forgot password? Request a One Time Password or reset your password
One Time Password
Check your email for an email from [email protected]
Subject: Your OTP for Account Access
This email will have a code you can use as your One Time Password for instant access
To reset your password, enter your email address
A link to create a new password will be sent to the email address you have registered to your account.
Enter and confirm your new password
Congratulations your password has been reset
Sorry, but your key is expired.
Sorry, but your key is invalid.
Something go wrong.

Only available to Market Matters members
Hi, this is only available to members. Join today and access the latest views on the latest developments from a professional money manager.

Smart Phone App
Our Smart Phone App will give you access to much of our content and notifications. Download for free today.

