Month: April 2016
Sell in May and go away” is looming for stocks, is 2016 different? Over the last 64 years the Dow Jones has on average been down between May and October, compared to significant gains between November and April – the take out from those numbers is not rocket science. The regularly quoted phrase that brokers / investors commence citing at this time of year….”sell in May and go away”, clearly does have some foundation. As we all know most statistics can be structured to tell the story the commentator is spruiking so today we will attempt to be totally objective when applying this seasonal factor to today’s markets post the GFC, while keeping everything simple:
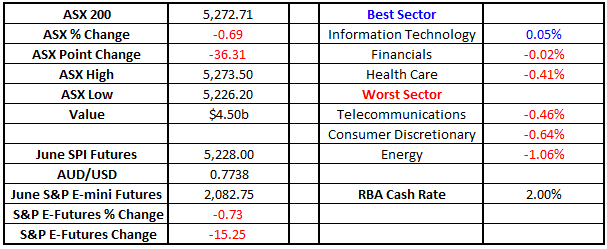
Inflation collapses and people mention the “D” word Australia’s extremely weak inflation numbers released at 1130am yesterday shook the markets to their core with the $A plummeting from 77.5c to 76c as a rate cut, potentially as soon as next Tuesday, became a very strong possibility. This was the first fall in inflation since 2008 and totally unexpected. Initially equities embraced the possibility of an imminent rate cut sending the ASX200 up ~60 points before the larger concern of deflation hit home and aggressive selling, primarily focused on the banks, took hold reversing the market almost 100 points / -1.8% to close down 33 points. The actual fall was not that concerning especially with the Dow futures pointing to an APPLE led retreat and most of Asia also giving up early gains but if the market does take deflation as a serious threat things could get ugly for equities. If inflation keeps falling banks are likely to struggle to maintain margins and bad debts will rise as unemployment increases – a vicious cycle which makes the economy weaker. The RBA will be very conscious of this and we’re starting to see changing expectations around a cut next week….NAB the latest to change their official forecast from no change in the cash rate to a 0.25% cut next Tuesday. So far the Australian bond market is not as excited about future rate cuts as it was in April of 2015 when 3 year bond yields were trading ~1.6% – see chart 1. Australian 3 year Bonds Daily Chart
Show more…
You need to be a member to view this article
REGISTER FOR FREE INSTANT ACCESS
Good Morning everyone, Our short term view and plan for equities World stock markets hardly moved overnight but we saw further weakness from our resource stocks with BHP looking to open ~ $19.80 down another 2.8%. BHP will now be down 6.9% from its high last Thursday. We stick with our view that on number of matrices, which includes risk / reward, we cannot be long iron ore stocks now. However, as we outlined in the Weekend Report we have switched cautiously bullish on the local banks short term, keeping a close eye on ANZ, NAB and WBC which go ex-dividend next month – some attractive fully franked dividends will be on offer. This view is short term in nature only and we still anticipate lower levels for the banks in the medium term. However we believe the S&P500 is poised for a decent correction which may easily become 5% as investors become scarred of the May factor approaching – “sell in May and go away”. Hence while we must remain conscious of our medium / long term negative view for US equities decent risk / reward opportunities should arise if this pullback in US equities unfolds in the near term. In short, we expect weakness now in the U.S, one more bounce then a bigger correction. The US S&P500 Daily Chart We will look at the three above mentioned banks individually with a specific eye on risk / reward. ANZ Bank (ANZ) Weekly Chart ANZ Bank has been the worst performing “Big Four” Bank in recent times being punished for its relatively large exposure to both Asia and resource / energy companies. After falling 41.3% from its highs of 2015 a short squeeze similar to that enjoyed by the resources sector would be easy to imagine. Ideally we can buy ANZ ~$23 with stops under $22 but this may be tweaked depending on coming days / weeks price action. National Australia Bank (NAB) Weekly Chart
Short term caution is definitely warranted for equities World stock markets have enjoyed an exceptional rally since late January with the S&P500 up 15.5%, and the ASX200 up 12% having enjoyed a strong recovery from the resources sector. We believe this 11 week rally is overdue for a correction, or consolidation at best, the nature of this potential pullback will determine our view on what comes next for US equities. The ASX200 concerns us because a number of major stocks hit our long term targets yesterday and have backed off overnight. BHP for example is looking to open over 50c lower this morning even with iron ore rallying a massive 8.8% last night in the US. In this morning’s report we are going to focus on four major stocks that have hit / approached our long term targets in the last 24 hours and we are now negative / neutral at best The US S&P500 Daily ASX200 Daily The ASX200 tested strong resistance at 5300 yesterday and a pullback to at least short term support ~5200 looks very likely in the coming days. BHP Billiton (BHP) Weekly Chart BHP has hit our long term “abc” and wave equality retracement target ~$21.20. We advise taking at least 50% profit on any longs, a break back under $19 would be very negative technically. S32 Daily Chart
Really bullish, there's more to go in the reflation rally

Please enter your login details
Forgot password? Request a One Time Password or reset your password
One Time Password
Check your email for an email from [email protected]
Subject: Your OTP for Account Access
This email will have a code you can use as your One Time Password for instant access
To reset your password, enter your email address
A link to create a new password will be sent to the email address you have registered to your account.
Enter and confirm your new password
Congratulations your password has been reset
Sorry, but your key is expired.
Sorry, but your key is invalid.
Something go wrong.

Only available to Market Matters members
Hi, this is only available to members. Join today and access the latest views on the latest developments from a professional money manager.

Smart Phone App
Our Smart Phone App will give you access to much of our content and notifications. Download for free today.

