Should we buy the classic “yield play” stocks as bond yields plunge? (SYD, TCL, ALX, SKI, AGL)
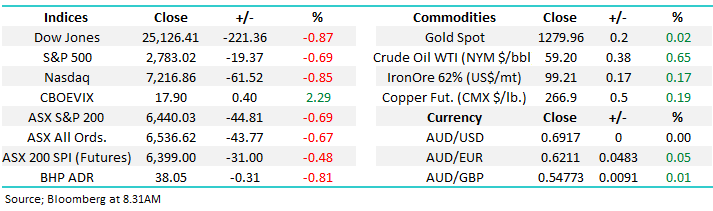
The ASX200 was sold off pretty hard yesterday finally closing down 45-points but it never actually “felt” that bad – by 4pm only the Telco’s closed positive while most sectors were down ~1%. The selling felt futures led throughout the day and hence generally broad based as we followed a weak US futures lead – the S&P500 futures were already down another -0.6% at 930pm last night, compounding the losses from Tuesdays -0.8% fall in this shortened week.
Australian bond yields continued to make fresh all-time lows and our Bloomberg screens lit up during the day to the news that our 10-years had broken below the official RBA targeted cash rate closing at 1.483%, a very attractive carry rate for the yield seekers i.e. even after yesterdays 26c rally NAB shares are paying 6.9% fully franked, it’s very hard to comprehend the “Big Four” banks falling too far until we see an end to falling interest rates.
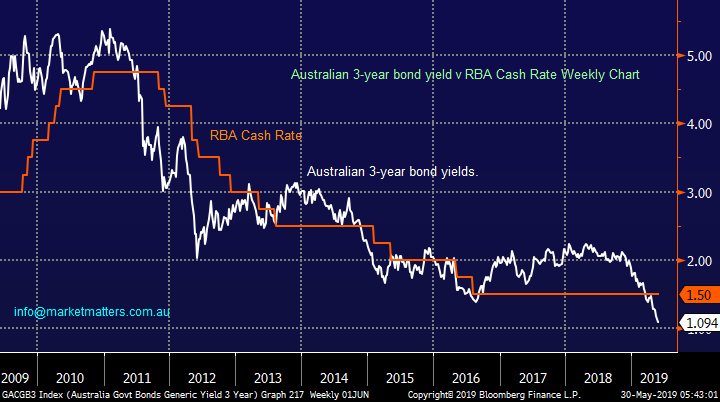
It now seems that forecasters are on a race to the bottom with targets for the RBA cash rate, most now believe 2 cuts to 1% is a given with some calling another 0.5% on the cards, that would make the differential ~6.5% between the RBA rate and NAB’s yield – not hard to guess where many investors will choose to invest their hard earned money. With 3-year bond yields closing below 1.1% yesterday its soon going to be hard to find anyone not forecasting 3 rate cuts by the RBA over the next 12-months.
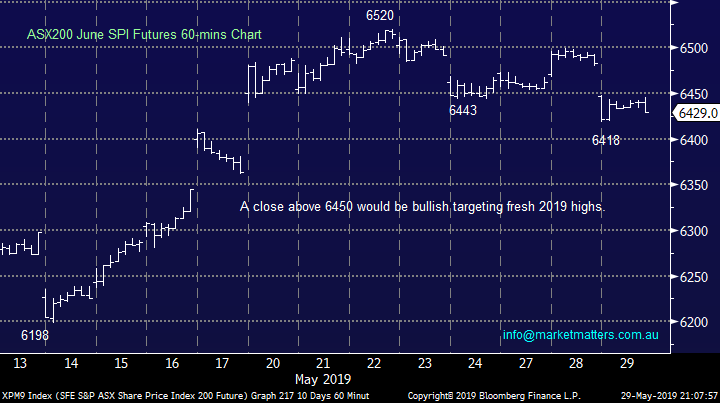
MM remains bullish the ASX200 technically while the index can hold above 6350
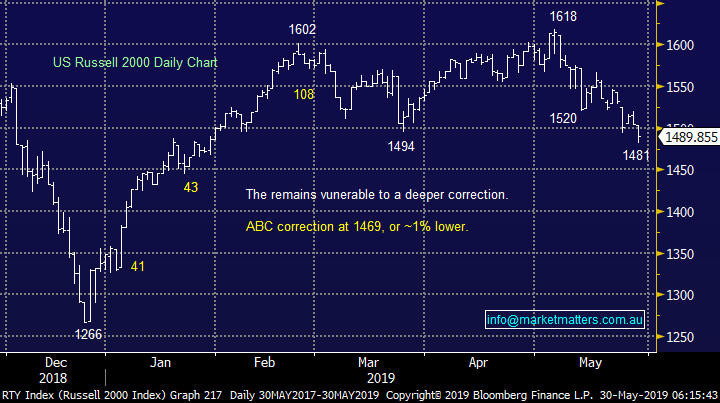
Overnight US stocks had another tough session with the Dow falling 220-points but the Russell 2000 is now within 1% of our pullback target. The SPI futures are calling the ASX200 down over 40-points with BHP down almost 1% in the US.
In today’s report we are going to take a look at the “yield play” stocks as bond yields continue to fall.
ASX200 June SPI Futures Chart
Below we have compared the RBA Cash Rate with the Australian 3-year bond yield as the differential continues to widen. The main takeout from the chart to MM is that when 3-year bond yields fall below the RBA rate, official cut (s) to rates usually follow.
MM expects 2 rate cuts in 2019.
Australian RBA Target Cash Rate v 3-year bond yields Chart
We have a saying at MM – “look after your losers and the winners will look after themselves”. Not particularly revolutionary stuff just a catchy phrase which reinforces that vital discipline for successful trading – “run your profits and cut your losses”.
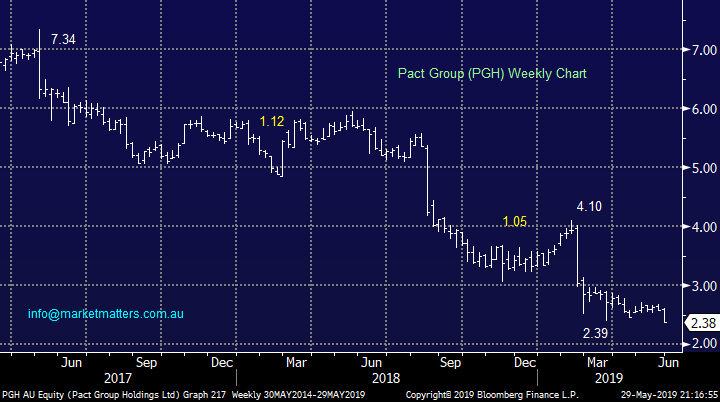
We went long packaging company Pact Group (PGH) in late February and its been looking ok as a “dog pick” until this week’s ~9% decline – that takes the stocks collapse to ~70% in just one year (we’re in at a $2.73 average). Our thesis for buying centred on the market becoming too negative on earnings along with the companies high debt levels – in both instances, we could see a way out for PGH led by their Chair and largest shareholder Ruffy Germinder.
While the stock is clearly cheap, trading on an Est P/E for 2019 on around 10x plus they now have a new CEO in place – Sanjay Dayal who was ex-strategy head at Bluescope, there is the possibility they will need to raise capital.
At this stage, MM will give it more room BUT we have no intention of averaging.
Pact Group (PGH) Chart
Can the “yield play” stocks continue to embrace yet lower rates?
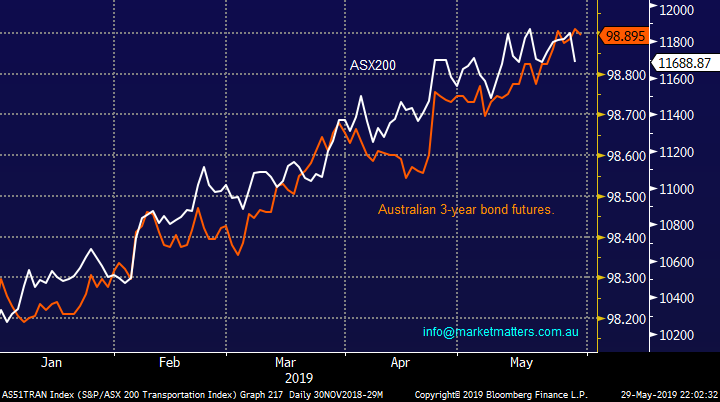
The “yield play” stocks are often characterised by the ASX200 Transportation sector, which includes the likes of Sydney Airports (SYD) and Transurban (TCL), clearly this has been tracking the market as a whole extremely closely in 2019. This month has seen slight underperformance by the group of stocks but nothing that can be called trend changing at this juncture.
The “yield play” stocks appear to be an excellent guide to the health of the ASX200.
ASX200 v Transportation sector Chart
![]()
The Australian share market has enjoyed an excellent post-election rally outperforming its global peers along the way with in MM’s opinion the most meaningful driver of stocks remaining falling bond yields. The correlation between the Australian 3-year bonds and ASX200 is extremely close as they walk an almost identical path.
The question we must continually ask is “has all the good news on rates already been built into stocks?”, hence are we headed towards a “buy on rumour sell on fact” scenario. At this stage we do believe markets are getting a little ahead of themselves on interest rates but as there’s every chance rates can stay at these extremely low levels for a long period of time it’s not yet a major concern – the Achilles heel for stocks is likely to be inflation, any tick up in this measure of activity / demand usually pressures stocks in a very meaningful manner.
ASX200 v Australian 3-year bonds Chart
Now moving onto a few stocks within the group to see if any nuggets of opportunity exist or signs that the equity party is coming to an end.
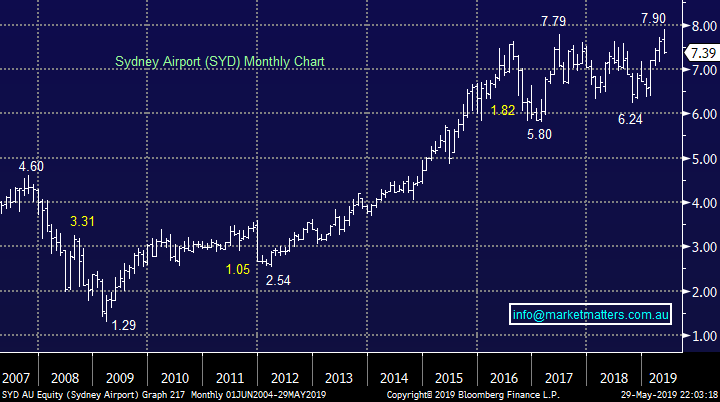
1 Sydney Airport (SYD) $7.39
SYD made fresh all time highs this month but its backed off from the $8 region fairly aggressively. We are not that keen on SYD believing it to be simply expensive for a stock facing some headwinds to increasing passenger volumes after years of capacity expansion.
While the yield is attractive (5.1% unfranked) the influence of low interest rates is huge for infrastructure owners like Sydney Airport, and from a risk /reward perspective, buying at these elevated levels is very hard to justify.
MM has no interest in SYD and is currently neutral / bearish.
Sydney Airport (SYD) Chart
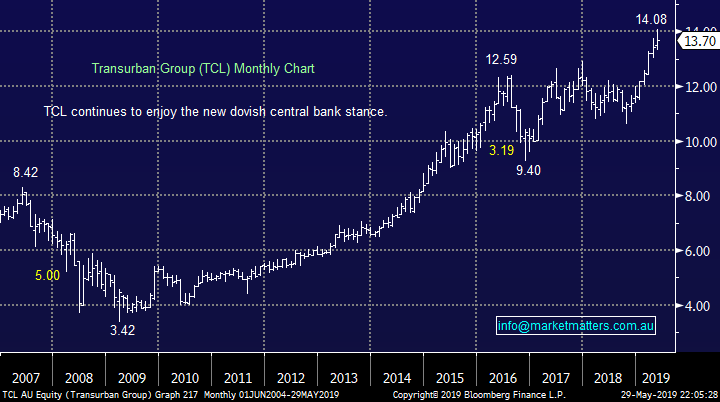
2 Transurban (TCL) $13.70
Like Sydney Airports TCL has made fresh all-time highs this month as declining bond yields clearly helped both the sector and stock. While falling interest rates have been a clear tailwind for the company, underlying earnings have been strong, plus TCL have done a phenomenal job of sensibly expanding existing toll roads while also ploughing on with new projects. Toll pricing has been running ahead of inflation plus the volume of users across their network has been increasing – clearly a positive backdrop.
While we’ve underestimated management’s operational abilities – hence we don’t own the stock – low interest rates have certainly been the other supportive factor over the past few years.
The stock is regarded as a relatively defensive dividend play although 4.1% part franked is now looking stretched. While it’s hard to envisage the stock falling too far until the RBA considers raising, as opposed to cutting, interest rates, again the risk/reward favours the sellers at these levels.
MM is currently neutral TCL but we prefer it over SYD.
Transurban (TCL) Chart
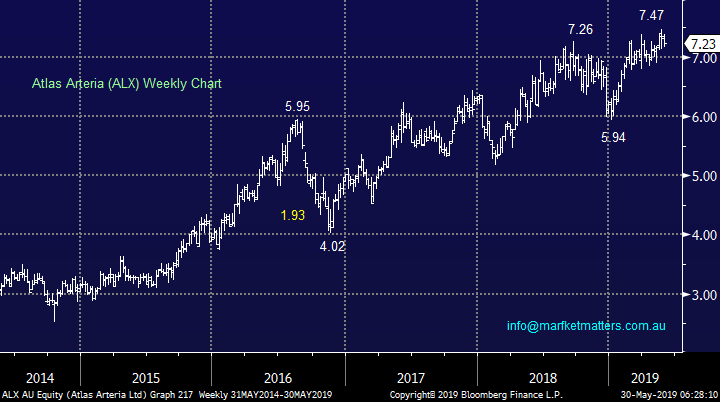
3 Atlas Arteria (ALX) $7.23
Infrastructure developer & operator ALX has also made fresh highs in recent weeks but its upside momentum is lower than both SYD and TCL, which is probably no surprise with its lower yield of 3.7% unfranked yield.
The former Macquarie Atlas Roads has become one of the world’s largest players in the private toll space and its stock having doubled over the last 5-years illustrates they have done a good job. However we believe the often lightly named “easy money” may have already been made in this stock.
MM is currently neutral ALX.
Atlas Arteria (ALX) Chart
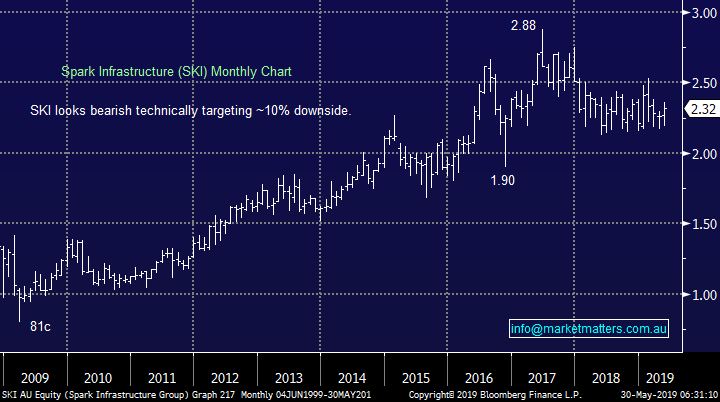
4 Spark Infrastructure (SKI) $2.32
SKI operates in the regulated utility infrastructure space in Australia but as a stock it has significantly underperformed many of its sector friends. There are some non-operational reasons for this, such as the announcement that they will likely become a tax paying entity which would reduce their unfranked yield, however the obvious offset being franking credits could be passed through in the future – something that has clearly more value under the newly appointed Coalition Government.
The stock is currently yielding 6.9% unfranked which is clearly attractive but at this point in time we are only considering the stock closer the $2 region.
MM remains neutral SKI.
Spark Infrastructure (SKI) Chart
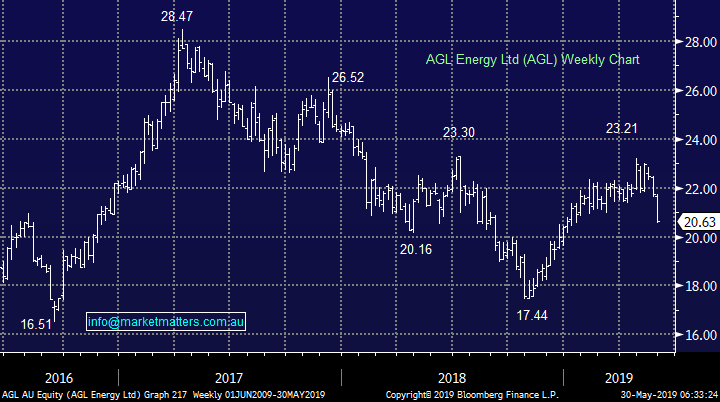
5 AGL Energy (AGL) $20.63
This seller / distributor of gas and electricity is clearly far more volatile than the 4 other stocks mentioned earlier today partly because it operates in a more politically sensitive market place, however I included it as AGL has had a very poor couple of weeks.
AGL is currently yielding an attractive 5.7% mostly franked and around the $20 region it will be tempting as an income play, especially with the next dividend due in August.
MM is neutral AGL but interested ~$20.
AGL Energy (AGL) Chart
Conclusion (s)
Of the 5 stocks looked at today none jumped out of the page at us but we prefer TCL over SYD and may consider AGL ~$20.
Global Indices
Nothing new with our preferred scenario the current pullback is a buying opportunity although we are only looking for a test of / slight new 2019 highs from US indices.
US Russell 2000 (small cap) Index Chart
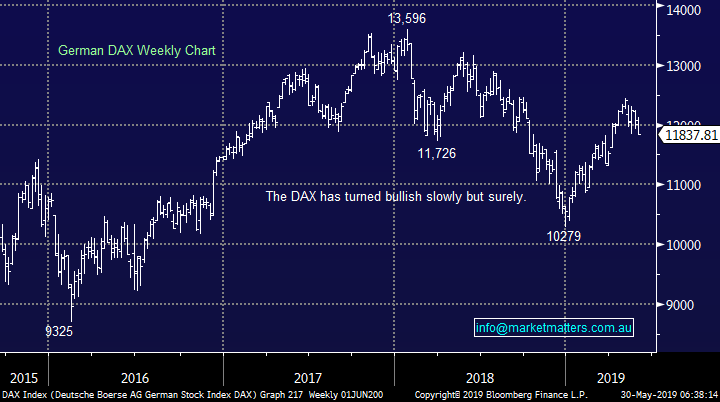
No change with European indices, we remain cautious European stocks but the tone is improving fast.
German DAX Chart
Overnight Market Matters Wrap
· The US equity markets experienced a sell off overnight on continuing concerns around slowing US and global economic growth as risks rise of an escalation in the US-China trade war. The three key indices closed between 0.7% and 0.9% lower, even after a late rally from their earlier lows, which saw the Dow at one stage down 360pts, before late buying saw it close 220pts lower (-0.87%).
· It was a sea of red across commodities and European equity markets on the growing growth concerns. Bonds hit fresh lows not seen since September 2017, with ten years trading as low as 2.21% before closing around 2.25% as investors sought defensive assets. Base metals and oil were weaker, while gold and iron ore were steady.
· BHP is expected to underperform the broader market after ending its US session down an equivalent of 0.81% from Australia’s previous close.
· The June SPI Futures is indicating the ASX 200 to open 45 points lower, towards the 6400 level this morning.
Have a great day!
James & the Market Matters Team
Disclosure
Market Matters may hold stocks mentioned in this report. Subscribers can view a full list of holdings on the website by clicking here. Positions are updated each Friday, or after the session when positions are traded.
Disclaimer
All figures contained from sources believed to be accurate. Market Matters does not make any representation of warranty as to the accuracy of the figures and disclaims any liability resulting from any inaccuracy. Prices as at 30/05/2019
Reports and other documents published on this website and email (‘Reports’) are authored by Market Matters and the reports represent the views of Market Matters. The MarketMatters Report is based on technical analysis of companies, commodities and the market in general. Technical analysis focuses on interpreting charts and other data to determine what the market sentiment about a particular financial product is, or will be. Unlike fundamental analysis, it does not involve a detailed review of the company’s financial position.
The Reports contain general, as opposed to personal, advice. That means they are prepared for multiple distributions without consideration of your investment objectives, financial situation and needs (‘Personal Circumstances’). Accordingly, any advice given is not a recommendation that a particular course of action is suitable for you and the advice is therefore not to be acted on as investment advice. You must assess whether or not any advice is appropriate for your Personal Circumstances before making any investment decisions. You can either make this assessment yourself, or if you require a personal recommendation, you can seek the assistance of a financial advisor. Market Matters or its author(s) accepts no responsibility for any losses or damages resulting from decisions made from or because of information within this publication. Investing and trading in financial products are always risky, so you should do your own research before buying or selling a financial product.
The Reports are published by Market Matters in good faith based on the facts known to it at the time of their preparation and do not purport to contain all relevant information with respect to the financial products to which they relate. Although the Reports are based on information obtained from sources believed to be reliable, Market Matters does not make any representation or warranty that they are accurate, complete or up to date and Market Matters accepts no obligation to correct or update the information or opinions in the Reports. Market Matters may publish content sourced from external content providers.
If you rely on a Report, you do so at your own risk. Past performance is not an indication of future performance. Any projections are estimates only and may not be realised in the future. Except to the extent that liability under any law cannot be excluded, Market Matters disclaims liability for all loss or damage arising as a result of any opinion, advice, recommendation, representation or information expressly or impliedly published in or in relation to this report notwithstanding any error or omission including negligence.


