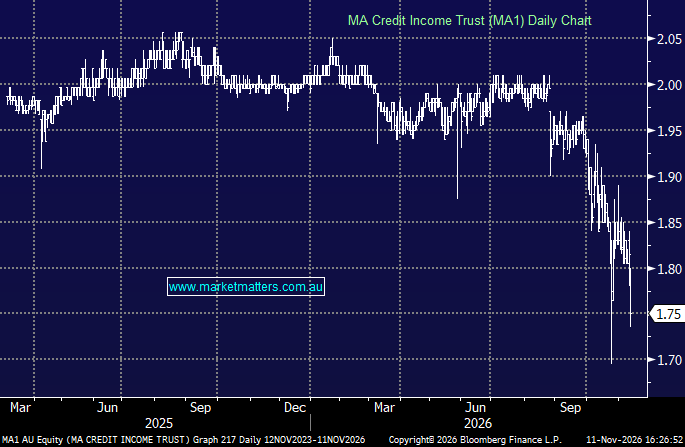
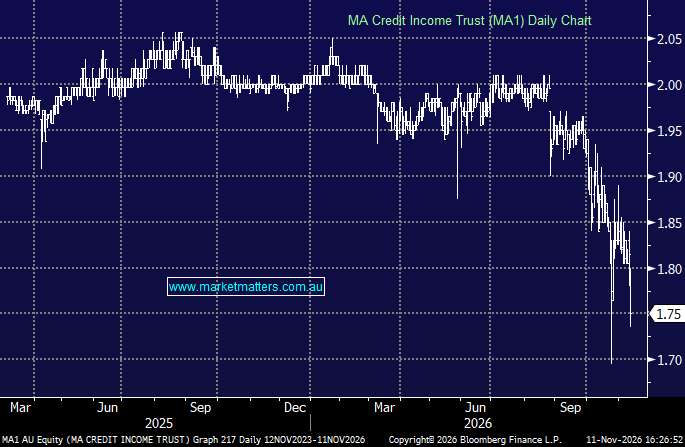
MA1 -3.58%: In an update to the market today, MA1 has reported a noteworthy dip in monthly income which requires some explanation for those interested in the private credit /lending space. MA1 returned 0.39% for October, against a target of 0.75%. The monthly distribution is usually 0.67– 0.73% equating to around 8.5% annually. It’s not a big change, but worth unpacking. It could either be a one off, or the start of something more meaningful + it’s worthwhile to explain in the context of broader concerns around private credit.
The cause was a downgrade in expected recoveries on property loans. The write-down equalled about 1.8% of MA’s real estate credit book, or about 0.4% of MA1. The write down related to eight property loans in October. Unitholders took a 40% cut to the monthly distribution, but NAV didn’t budge from $2.00. Here’s how a loan write-down works, and why this one barely registered in the headline NAV.
A write-down is the manager’s estimate of what it will actually recover, booked as a loss before any cash changes hands. It typically runs in five steps.
- The loan sits at what’s owed. A healthy loan is carried at its outstanding balance: the money lent plus any interest added to the balance. It doesn’t move with property prices or rates while full repayment is expected. MA1notes most loans are carried at cost under Australian accounting standards, not marked to market.
- Something triggers a review. Missed payments, a builder going under, a project running late, a lower valuation, or sales falling over. For MA1, it was “new information” on eight watch-list loans, picked up in the monthly valuation review.
- The manager estimates the recovery. It starts with what the security is worth today, usually from a fresh valuation or comparable sales. From there it deducts:
- selling costs: agents, legal and GST
- holding costs until sale: rates, insurance, receiver fees
- the cost to finish the project, if it’s an incomplete development
- anything owed to lenders ranked ahead
Money received in 18 months is worth less than money today, so the expected recovery is discounted back to a present value.
- The loan is marked down to that number. The gap between the carrying value and the expected recovery is the write-down. It hits the fund’s income in the month it’s recognised.
- Interest accrual stops. An impaired loan usually moves to “non-accrual”, so the fund stops booking interest it doesn’t expect to collect. Capitalised interest already on the balance that’s now unrecoverable is effectively written off. MA1 has 3.5% of the portfolio in non-accrual.
An example might be useful here: Assume $10m is lent to a developer at a 10% interest rate, with interest added to the loan rather than paid in cash. After 18 months, the borrower owes about $11.5m, and the fund has booked the extra $1.5m as income along the way. But then the project stalls, and the loan ends up being written down by $2.5m. The fund’s $1.5m of past income is reversed and $1m of capital is lost. (These are illustrative numbers, not MA1’s actual loans).
- Carrying value (loan plus capitalised interest): $11.5m
- New valuation of the site: $10.5m
- Less estimated selling, holding and legal costs: $0.7m
- Expected recovery in 12 months: $9.8m
- Discounted value today: approximately $9.0m
- Estimated write-down: approximately $2.5m
From here, the loan earns nothing until it’s resolved. Every number in this table is an estimate, and that’s the crux of it.
But MA1’s NAV didn’t move? The loss was absorbed by October’s income instead of capital, so investors felt it in their distribution rather than the unit price.
MA1 doesn’t hold these loans directly. The write-down passes up through layers of funds:
- MA Secured Loan Series, which holds about 71 property loans, writes down the eight affected ones.
- The underlying MA credit funds own part of that Series.
- The MA Credit Income Fund (Wholesale) holds those funds.
- MA1 holds the Wholesale fund.
Each layer takes its proportionate share. A hit worth 1.8% of the property-loan book ends up as about 0.4% at MA1, because property lending is only around 20% of the portfolio. The fund pays out roughly what it earns each month, so NAV normally sits near $2.00. In October, the loans still earned about 0.79%, or around 1.6c a unit. The write-down took out about 0.4%, or around 0.8c. That left a net 0.39%, and MA cut the distribution to 0.42% to roughly match it.
The result is that NAV only slipped by the gap between 0.42% paid and 0.39% earned. That’s about 0.06c a unit, invisible at two decimal places. Without the distribution cut, NAV would have shown about $1.99. Holders didn’t lose capital on paper, but they did forgo about 0.8c a unit of income.
At this stage, judgement is very important, and it’s not an exact science. Every input to a write-down is the manager’s call: the valuation, the costs, the timing and the discount rate. A 5% lower sale price or an extra six months to sell can shift the result materially.
If a property sells above the assumed price, part of the write-down reverses into a gain. If it takes longer or sells for less, there’s another write-down.
MA1’s loan book is still carried at 99.49c in the dollar, even though:
- 6.5% of the portfolio is 90+ days in arrears or in default, almost all of it in property lending
- 14 loans are in workout or enforcement, 10 of them property loans, and two developments are running with replacement builders
- 96% of the property loans capitalise interest rather than paying cash, so that income only becomes real if the loans are repaid in full.
On the other side of the ledger, about 95% of the portfolio is performing, spread across 245 positions, with the largest single loan at 1.5%. Fund-level leverage is just 1.8%, and property lending has been cut from about 30% of the fund to 20% over the year.
The $1.75 security price (relative to NTA of $2) says the market is applying a more conservative recovery estimate. Over the next few monthly updates, we’re watching three things:
- whether there are further write-downs in direct asset lending
- whether the distribution recovers toward 0.65–0.70% a month
- whether the discount to NAV narrows or widens
As we’ve written in the past, we think there is value emerging in these sorts of securities. We made a move today on the Kapstream Investment Trust (KIT), adding it to the Income Portfolio in the low $1.70’s, but we’re certainly not backing up the truck on these. The discount to NAV shows there is still plenty of uncertainty around, which is hard to argue with, though a ~15% discount is pricing in a pretty dire outcome.
MM is watching the property backed LIT’s such as MA1 closely
Add To Hit List