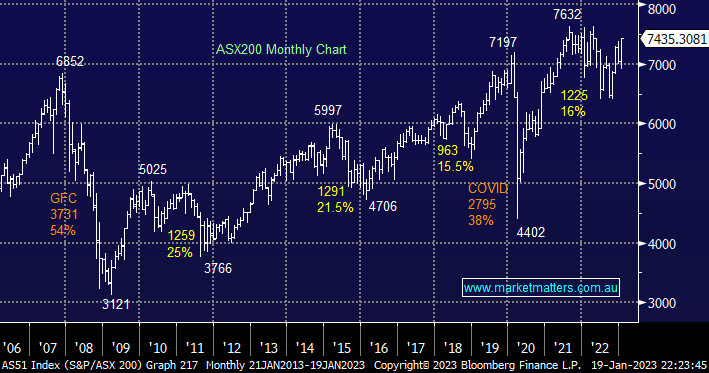
Markets often form significant highs/lows at the start of a year, the numbers for the ASX200 since the GFC tell the tale:
- Bottoms: 2021, 2019, 2017, 2016, 2014, 2013, 2009, 2007, 2006, 2005, 2004 and 2000 – 12.
- Tops: 2022, 2020, 2011, 2008, 2002 & 2001 – 6.
- Neither: 2018, 2015, 2012, 2010 & 2003 – 5.
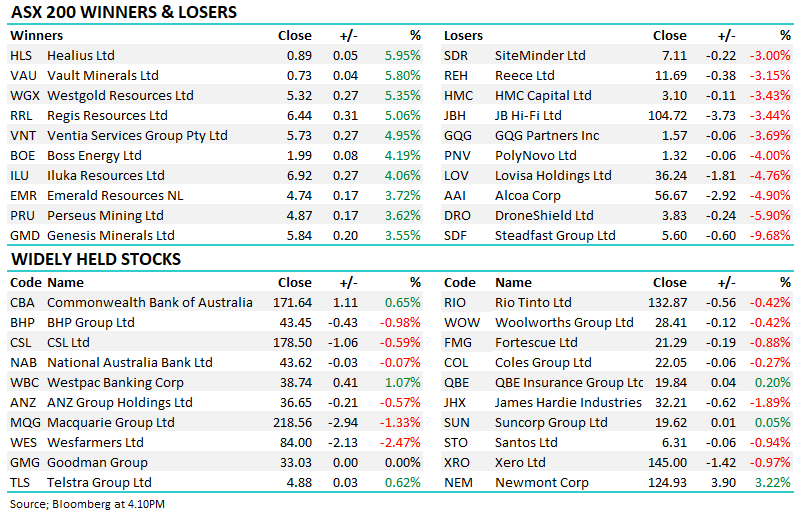
Without being too pedantic we’ve seen a decent market top/bottom almost 80% of the time with the same statistics usually holding true across all financial markets, including stocks! Hence in today’s report, we’ve briefly looked at 4 of the ASX200’s worst-performing stocks year-to-date, it may be early days but where there are extremes in January we often see opportunity.
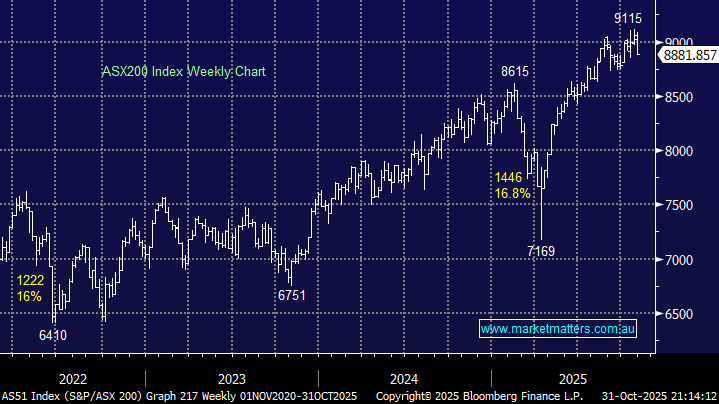
- We wouldn’t be surprised to see the local market experience a “False pop” up towards 8000 in Q1.
MM is neutral on the ASX200 as it approached all-time highs
Add To Hit List